

 PDF
PDF ePub
ePub Citation
 Print
Print


INTRODUCTION
Urodynamic study (UDS) is considered the gold standard for investigating the cause of lower urinary tract symptoms (LUTS) [1]. Involuntary detrusor contraction during filling cystometry is called urodynamic detrusor overactivity (DO) and may help to predict the outcome of transurethral prostatic surgery and influence treatment options [2]. Strict indication, quality control, and accurate analysis are needed as UDS is invasive, expensive, and can cause discomfort and complications [3]. Although filling cystometry as part of UDS can be measured in the supine, erect, or even sitting posture, there is no clear consensus about the optimal posture during filling cystometry in the international guidelines of UDS [34]. However, it is recommended that repeating filling cystometry in a different posture can be helpful when it is deemed clinically necessary [5].
It has been reported that posture and repetition of filling cystometry can influence urodynamic parameters. Awad and McGinnis [6] measured DO in 30% of women with urinary incontinence in supine posture versus 61% in the erect posture. Al-Hayek et al. [7] performed a systematic review and concluded that supine posture during filling cystometry would fail to detect a significant percentage of patients with DO. Ockrim et al. [8] observed a DO of 72%, 63%, and 48%, in the 3 sequential UDS, respectively.
To our knowledge, there has been no prospective randomized study on the combination of posture and repetition of filling cystometry. The aims of this study were to investigate the effect of posture and repetition of filling cystometry on urodynamic parameters and elucidate which posture might better correlate to patient symptoms.
MATERIALS AND METHODS
1. Patients and study design
A prospective randomized study was performed enrolling patients with benign prostatic hyperplasia (BPH) presenting to the urology department of Seoul National University Hospital (SNUH). The patients were recruited between September 2015 and August 2016. Inclusion criteria of this study included patients with LUTS/BPH aged over 45 scheduled for UDS in our urology outpatient clinic. Exclusion criteria included neurogenic bladder, bladder stone, acute urinary tract infection within one month, previous administration of anticholinergics within one month, history of prostate or bladder surgery, genitourinary cancer, urethral stricture, renal or hepatic insufficiency, serum prostate-specific antigen (PSA) higher than 10 ng/dL or patients who could not undergo UDS in a supine or erect posture. The following examinations were carried out for assessment: patient history, digital rectal examination, International Prostate Symptom Score (IPSS), overactive bladder symptom score (OABSS), frequency volume chart (FVC), serum PSA, and transrectal ultrasonography of the prostate. After informed consent was obtained, the patients were randomly assigned to one of 4 groups (SS [supine to supine], EE [erect to erect], ES [erect to supine], and SE [supine to erect]) (1:1:1:1) using an online randomization system at our hospital [9]. The patients then underwent UDS with 2-time filling cystometry in the assigned postures as described above. The Institutional Review Board of SNUH approved the study design (approval number: H-1507-128-689). Written informed consent was obtained from each participant. This study was performed according to the Helsinki Declaration.
2. Sample size
The sample size was calculated based on the data from review article of Al-Hayek et al. [7]. The incidence of DO in the supine posture was 11% and that in the erect posture was 48% in the article. The sample size calculation showed that 48 patients are required to have 80% power for detecting a significant difference of DO between the supine and erect postures. The aims of our study were not only to investigate the effect of posture but also to investigate the effect of repetition. Therefore, we decided to recruit double the number indicated in the calculated sample size. Finally, we planned 1-year recruitment of participants; the number of participants needed at least 48 and at most 96. We conducted mid-term analysis when the number of participants was 42. A significant difference in the occurrence of DO was seen between the supine and erect postures. However, other filling cystometric parameters showed no significant differences and the effect of repetition was not clear. Therefore, we decided to recruit more participants; the final number of participants was seventy one after 1-year recruitment.
3. Urodynamic procedures
The urodynamic procedures were carried out according to the guidelines of the International Continence Society [1]. The procedure and potential complications of UDS were explained to each patient a few days before the procedure. Immediately before the UDS was performed, medical history and laboratory data for each patient were collected for selecting candidates. Then the study design was explained to candidates and written informed consent was obtained from each participant. Participants were then registered on the online randomization system of our hospital [9] and randomly assigned to each previously mentioned group. Conventional UDS was carried out by the same nurse practitioners using the same protocol (UD-2000, Medical Measurement System, Enschede, The Netherlands) but filling cystometry was performed twice in the previously assigned postures.
The UDS procedure was as follows. First, free uroflowmetry was performed. Filling cystometry was then performed in the first assigned posture with normal saline mixed with contrast dyes at a filling rate of 50 mL/min at room temperature. An aseptic dual-lumen 6-French catheter (Medtronic Inc., Skovlunde, Denmark) was inserted to measure vesical pressure and infuse fluids. A rectal balloon catheter (Medical Measurement System) was inserted into the rectum to measure abdominal pressure. Then, a pressure flow study was performed and the second filling cystometry performed in the second assigned posture. Subsequently, a pressure flow study was performed, but only once or not at all in case of urinary incontinence or voiding failure. Finally, urethral pressure measurement was performed.
4. Clinical and urodynamic parameters
All patients underwent a baseline evaluation including the following: age, body mass index, IPSS, OABSS, prostate volume of transrectal ultrasonography of the prostate, and FVC. We examined total IPSS score, IPSS voiding subscore, and IPSS storage subscore. Overactive bladder (OAB) was diagnosed as an urgency score of OABSS ≥2 and a total score of at least 3 [10]. Maximum voided volume (MVV), 24-hour frequency, nocturia, and 24-hour production were examined in FVC.
Urodynamic parameters were also investigated. Maximal flow rate (Qmax) and postvoid residual urine volume were measured during uroflowmetry. First sensation of filling (FSF), first desire to void (FDV), strong desire to void (SDV), maximum cystometric capacity (MCC), bladder compliance, and DO were measured during filling cystometry. Bladder outlet obstruction index was measured during the pressure flow study using the following formula: detrusor pressure at maximum flow rate – 2 Qmax [11]. Maximum urethral closure pressure (MUCP) was measured during urethral pressure measurement. MCC was defined as the bladder volume at which the patient complained that they could not suppress urination, or at which time the filled volume reached 550 mL or 600 mL (in cases where MVV was over 550 mL). DO was defined as involuntary detrusor contraction over 5 cmH2O; volume and pressure of DO were also documented. If involuntary detrusor contraction occurred multiple times, the minimum volume and maximum pressure of DO were documented.
5. Effect of repetition and posture of filling cystometry on UDS parameters
Groups SS and EE underwent filling cystometry twice without a postural change; groups SE and ES underwent filling cystometry twice with a postural change. Thus, there was only an effect of repetition in groups SS and EE, while there was combined effect of repetition and postural change in groups SE and ES. The effect of repetition was evaluated by comparing the first filling cystometry with the second filling cystometry in the same posture groups. The effect of posture was evaluated by comparing supine posture with erect posture during the first filling cystometry.
6. Correlation between symptom and UDS parameters
The patients were also divided in 2 by 2 groups for each posture and filling cystometry time. For example, the patients of groups SS and SE underwent the first filling cystometry in the supine posture and the patients of groups SE and EE underwent the second filling cystometry in the erect posture. We also evaluated the correlation between DO and OAB and between MVV and MCC in each posture and filling cystometry time.
7. Statistical analysis
All parameters are represented by mean±standard deviation or number (percentage). One way analysis of variance was used to evaluate the difference between 4 groups. Paired samples t-test and McNemar test were used to evaluate the difference in filling cystometric parameters by repetition of filling cystometry in the same group. Two sample t-test and chi-square test were used to compare supine posture with erect posture during the first filling cystometry. Cohen Kappa was used to compare OAB with DO. Intraclass correlation coefficient (ICC) was used to compare MVV with MCC. Statistical significance was set at a p-value of less than 0.05. A Cohen Kappa of 0 to 0.20 was considered to be in slight agreement, 0.21 to 0.40 was considered fair agreement, and 0.41to 0.60 was considered moderate agreement [12]. An ICC value less than 0.40 was considered poor agreement, 0.40 to 0.59 was considered fair agreement, and 0.60 to 0.74 was considered good agreement, and 0.75 to 1.00 was considered excellent agreement [13].
RESULTS
1. Patient demographics
Patient demographics were shown in Table 1. There was no significant difference in clinical parameters between the 4 groups (p>0.05).
2. Effect of repetition of filling cystometry on UDS parameters
The changes of filling cystometric parameters in each group by repetition of filling cystometry were shown in Table 2. There were several significant differences by repetition of filling cystometry. FSF (p=0.017) and FDV (p=0.017) were significantly different in group SS; minimum volume of DO was significantly different in group EE (p=0.007).
3. Effect of posture of filling cystometry on UDS parameters
The comparison of clinical and urodynamic parameters between supine and erect posture during the first filling cystometry was shown in Table 3. All filling cystometric parameters showed significant differences between supine group and erect group for the first filling cystometry (p<0.05). OAB diagnosis and all of urodynamic parameters except filling cystometric parameters showed no significant difference, but MUCP showed a significant difference during the first filling cystometry (p=0.038).
4. Combined effect of posture and repetition of filling cystometry on UDS parameters
SDV (p=0.018), MCC (p=0.009), occurrence of DO (p=0.031), minimum volume of DO (p=0.008) and maximum pressure of DO (p=0.003) showed significant differences in group SE; all filling cystometric parameters showed significant differences in group ES (p<0.01) (Table 2).
5. Correlation between symptom and UDS parameters
Supine posture during the first filling cystometry (κ=0.329; 95% confidence internal [CI], 0.037–0.621) and erect posture during the second filling cystometry (0.375; 95% CI, 0.152–0.598) showed a better correlation to OAB symptoms compared to that in the other groups. In predicting OAB using DO during filling cystometry, supine posture during the first filling cystometry showed the highest specificity (81.3%) and erect posture during the second f illing cystometry showed the highest sensitivity (100%).
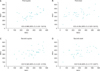
The correlation between MVV of FVC and MCC during filling cystometry is shown in Fig. 1. Supine posture during the first filling cystometry showed the best correlation between MVV and MCC (ICC=0.669; 95% CI, 0.431–0.819).
DISCUSSION
The primary aim of UDS is to reproduce the patient's symptoms [714]. Especially, filling cystometry is used to reproduce the storage phase of the bladder so that bladder sensation, bladder capacity, bladder compliance, and detrusor function can be evaluated through filling cystometry [1]. The UDS is the key to exploring the correlation between DO and OAB symptoms [7], but many factors can affect the occurrence of DO, including the temperature of the fluid, rate of filling, posture, repetition, and irritation by the catheter [78]. Due to these factors, the standard UDS has limitations in reproducing the physiological condition of the bladder; even in ambulatory UDS it is difficult to avoid catheter irritation completely [14]. Consequently, in our opinion, standard UDS is a more irritating condition compared to the natural physiological condition of the bladder.
The erect posture could trigger DO. Geirsson and Fall [15] reported that cold stimulation of the urethra caused a reflexive bladder contraction. During sitting or erect posture, some urine might enter the proximal urethra, which can stimulate DO [7]. The repetition of filling cystometry could have a suppressive effect on DO. Ockrim et al. [8] and Yıldız et al. [16] reported that repeated filling cystometry resulted in a reduced occurrence of DO.
In our study, the filling rate was 50 mL per minute and temperature of the fluid was room temperature. These factors might influence the occurrence of DO; therefore, we believed that supine posture during the first filling cystometry would offset irritating conditions. During the second filling cystometry, erect posture was shown a better correlation to OAB symptom than supine posture due to the effect of repetition.
Many studies have shown the correlation between posture and DO. Al-Hayek et al. [7] reported a review article on the effect of posture on the occurrence of DO. Sixteen articles were analyzed and there was a clear trend of reduced occurrence of DO in supine posture. However, some of these articles did not match DO and clinical parameters, and ignored the effect of repetition. In our study, patients were randomly assigned to the supine or erect posture, and the effect of posture was clearly shown. Supine posture caused the bladder to be less sensitive and less overactive. Ockrim et al. [8] and Yıldız et al. [16] reported the effect of repeated filling cystometry. They showed a trend of reduced bladder sensation and reduced occurrence of DO when filling cystometry was repeated. This trend was also seen in our study.
We evaluated the correlation between OAB and DO and between MVV and MCC. OAB and DO are different conditions, even though the overlap between them is substantial. OAB is a symptom-based diagnosis characterized by urinary urgency, while DO is a urodynamic observation characterized by involuntary detrusor contractions during filling cystometry [1]. Many of those with OAB do not have DO and those with DO do not always have urgency issues [17]. MVV and MCC are also different measurements even though they are very similar concepts. Although urodynamic parameters cannot perfectly correspond to symptoms, one principle is clear: the posture which shows the best correlation between urodynamic parameters and symptoms would be the most desirable posture. In our study, the supine posture during the first filling cystometry showed a better correlation between OAB and DO and between MVV and MCC compared to the others. Thus, we suggest that the supine posture is the ideal proper posture for the first filling cystometry.
There were several limitations in this study. First, we recruited only patients with BPH; other diseases, including neurogenic bladder, were excluded. This selection made participants homogeneous, and our results cannot represent other urologic conditions such as urinary incontinence and neurogenic bladder. Moreover, patient symptoms might be more severe compared to that in typical patients with BPH. Generally, we performed UDS in those who might undergo BPH surgery or who complained of severe symptoms. Second, we did not perform filling cystometry in the sitting posture. Adding sitting posture would be better choice to have a more complete evaluation of the effect of posture, but it would take larger group and more time. We decided to perform our study with the supine or erect postures because Al-Hayek et al. [7] reported that the most change occurred between the supine and erect posture.
CONCLUSIONS
There were significant differences in urodynamic parameters between the supine posture and erect posture and between the first filling cystometry and the second filling cystometry. Supine posture and repetition of filling cystometry caused the bladder to be less sensitive and less overactive. Supine posture showed a better correlation to patient's symptoms compared to that in the erect posture during the first filling cystometry.


 XML Download