

 PDF
PDF ePub
ePub Citation
 Print
Print


INTRODUCTION
One-third of men and women in the United States are obese according to the Centers for Disease Control and Prevention (CDC) [1]. Annual medical costs for obese patients are estimated to be US $1,429 higher than those of normal weight individuals [1]. As a result of rising obesity rates among Americans, the prevalence of obesity in the surgical population has also increased [2]. There is a general assumption that higher body mass index (BMI) is associated higher complexity of surgery and increased morbidity and mortality. However, prior large studies in the National Surgical Quality Improvement Project (NSQIP) have suggested, paradoxically, lower morbidity and mortality rates in overweight and obese elective general surgery patients when compared to the extremes of underweight and morbidly obese patients [3]. Little is known about longterm outcomes and quality of life by BMI category for most surgical procedures.
The most common treatment for clinically localized prostate cancer is radical prostatectomy, an extirpative procedure associated with quality of life side effects such as urinary incontinence and erectile dysfunction [4]. Current data regarding baseline and long-term urinary and sexual function outcomes in overweight and obese patients undergoing robotic-assisted laparoscopic prostatectomy (RALP) is limited and conflicting [567].
The purpose of our study was to assess the impact of BMI on recovery curve of urinary and sexual function after RALP. We hypothesized that overweight and obese men would have a significantly different recovery curve than normal and underweight men.
MATERIALS AND METHODS
1. Data/Cohort
This study was approved by the Geisinger Health System Institutional Review Board (approval number: 2014101). The primary data source was a retrospective review of all consecutive RALP's (n=712) performed by 6 surgeons for a diagnosis of prostate cancer in the Geisinger Health System Urology Department between December 2004 and January 2014. A detailed review of the electronic health record including inpatient and outpatient visit notes, patient questionnaires, operative reports, and pathology results was performed to ensure data accuracy. At each outpatient urology visit, patients completed a symptoms survey consisting of the following previously validated questionnaires: International Prostate Symptom Score (IPSS) [8], sexual health inventory for men (SHIM) [9], incontinence impact questionnaire (IIQ) [10], and the Bladder Health Questionnaire. The Bladder Health Questionnaire is further subdivided into the following urinary domains: urgency, behaviors, frequency, and leakage [11].
2. Outcomes
The primary outcome variables were sexual and urinary function as defined by the three questionnaires. SHIM was used to measure sexual function. IIQ and the Behaviors and Leakage domains of the Bladder Health Questionnaire were used to measure urinary function. The preoperative questionnaire was defined as any questionnaire completed within 6 months prior to RALP. If a patient had multiple questionnaires, the questionnaire closest to the date of RALP was selected. Data was analyzed from the time of RALP to 3 years after surgery. This cutoff was selected based on the time distribution of questionnaires available in our data and on prior studies that demonstrate recovery of urinary and sexual function several years after surgery [12]. The general clinical practice in our department is for men to return to clinic every 3 months for follow-up appointments for the first 1 to 2 years following surgery. Visit intervals following the first 1 or 2 years were at the surgeon's discretion. As a result, there was variability in return visit frequency across the sample.
3. Covariates
The predictor of interest for each outcome was preoperative BMI. BMI was defined as a categorical variable based on standard CDC definitions of underweight (below 18.5 kg/m2), normal weight (18.5–24.9 kg/m2), overweight (25–29.9 kg/m2), and obese (>30 kg/m2). We selected the BMI measurement that was prior to and closest to RALP. Those with missing BMI were excluded (n=19). Twelve morbidly obese patients (>40 kg/m2) were recategorized as obese. Two patients with BMI >60 kg/m2 were excluded as outliers. Nerve-sparing status was obtained from review of operative reports. Nerve-sparing was categorized as unilateral, bilateral, no preservation, or not reported.
4. Statistical analysis
Baseline demographic characteristics were described for all data and were compared across BMI categories using Pearson chi-square tests for categorical data and analysis of variance for continuous data. Baseline survey measures were defined as those measures closest RALP and no more than 6 months prior. A linear mixed model with an autoregressive covariance structure was used to evaluate unadjusted and adjusted associations between BMI category and each outcome (SHIM, IIQ, Behaviors and Leakage). Time was defined as the number of months from RALP to completion of the questionnaire and is a continuous variable since patients were not given this questionnaire at every visit. To understand how the measures changed over time, we examined person-specific plots of SHIM, IIQ, Behaviors and Leakage with time fit with cubic splines (data not shown). Based on the plots, time was reparametrized as a linear spline with 2 knots. Adjusted models controlled for factors that were selected a priori including age, race, smoking status, diabetes, surgery year, length of operation, preoperative serum prostate-specific antigen, pathologic staging, and nerve-sparing status. Surgery year was included in the models as a measure to control for surgeon learning curve.
Nerve-sparing status was missing for 69 patients (10%). There were significant differences in baseline demographics between those reporting nerve-sparing and those not reporting nerve-sparing. Differences were noted in cancer stage, node status, age, and transrectal ultrasound volume. Sensitivity analyses were performed categorizing those with missing status as nerve-sparing “yes” and then separately as nerve-sparing “no.” There were no significant differences and the subjects with missing nerve-sparing data were excluded from any additional analyses. Sensitivity analyses were performed removing those patients without data at baseline and those that lacked follow-up data between baseline and 3 months. There were no significant differences, therefore all patients with individual outcome data remained in the model. Sensitivity analysis models controlled for the same variables included in the other longitudinal models.
We utilized the methods delineated above due to the variation in clinical follow-up schedules of each physician. All statistical analyses were conducted using SAS 9.4 (SAS Institute Inc., Cary, NC, USA).
RESULTS
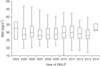
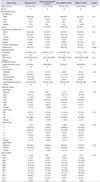
Out of 712 RALPs, a total of 691 met inclusion criteria (Table 1). Median BMI remained consistent over the study period (Fig. 1). The mean age of the cohort was 59 years. Median follow-up time from baseline survey to the last survey completed was 17.8 months (interquartile range, 4.8–41.6 months). Most men in the cohort were overweight (43%) and obese (42%). Under- and normal weight comprised 15% of the cohort. Most men were white which accurately reflects the distribution of race/ethnicity in the Geisinger Health System. Compared with under- and normal weight men, overweight and obese men were more likely to be current or prior smokers and hypertensive. In men with higher BMI, there was a trend towards diabetes and towards larger prostate volume. Obese men had significantly higher estimated blood loss and there was a nonsignificant trend toward longer operation times and positive margins. There were no significant differences in mean baseline questionnaire scores by BMI category (Table 2).
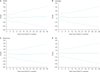
Fig. 2 shows fitted multivariable recovery curves for SHIM, Behaviors, Leakage, and IIQ scores for a hypothetical patient generated based on characteristics of the overall cohort. SHIM scores followed an expected postoperative trajectory in all BMI categories with a large initial decrease in the first 3 months after surgery and slow increase to
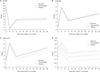
Scale plateau at 9 months (Fig. 2A). Leakage, Behaviors, and IIQ increased in the initial 3 months following RALP and then decreased over time (Fig. 2B–D). When testing for interaction between BMI and time, there were no significant differences between BMI categories and recovery curve slope suggesting that recovery curves were similar regardless of BMI category (Fig. 3A–D). This was true for all questionnaires.
DISCUSSION
Our findings suggest that men undergoing RALP for prostate cancer have similar recovery curves of urinary and sexual function despite BMI category. Our results corroborate and expand on previous findings that overweight and obese men undergoing RALP have similar trends in recovery of urinary and sexual function after surgery for clinically localized prostate cancer [6713].
Prior studies have suggested that RALP is more complex in obese patients based on operative time and blood loss. For example, Wiltz et al. [5] demonstrated that operative time was significantly longer in obese men (234 minutes) as compared to normal (217 minutes) and overweight men (214 minutes). A series of 1,420 RALP showed that operative time was 6 minutes longer in obese men [13]. Mikhail et al. [14] found that operative time, estimated blood loss and transfusion rates were highest in overweight men; however, this study was reported early in the robotic surgery experience and more recent studies have found no differences [15]. Other factors may be associated with longer operative times (i.e., higher cancer stage or larger prostate volume) in obese men rather than anatomy and abdominal fat [131416]. In our study, we saw a trend towards longer operative times by BMI category; however, it is unclear whether small differences in operative times and blood loss result in clinically significant surgical complexity. Our analyses adjust for operative times and stage and suggest that RALP complexity is not a factor in trajectory of quality of life.
Previous reports suggest similar recovery of urinary and sexual function after RALP in normal weight and overweight/obese men. A comparison of International Index of Erectile Function scores in 54 obese patients and 69 normal weight men and found no significant difference in recovery at 1 year [7]. In this study, 20% of normal weight and 25% of obese men returned to baseline scores at 12 months. Two studies used self-reported pad use as a measure of urinary function and continence after RALP. A study of 186 obese men with metabolic syndrome, urinary incontinence and erectile function were measured at 3-, 6-, and 12-month time points. There were no differences in SHIM score and continence recovery between men with and without metabolic syndrome at a median follow-up of 12 months [6]. Moskovic et al. [13] demonstrated similar recovery rates at 1 year in normal, overweight and obese men.
Few studies have looked at quality of life outcomes in overweight and obese men beyond 1 year. A recent study suggests long-term patient reported outcomes are important because men experience continued improvement for up to 4 years after surgery [12]. Similar to our study, BMI was not a significant factor in the recovery trajectory. Another study used the University of California-Los Angeles Prostate Cancer Index questionnaire to measure mean scores up to 2 years after RALP and stratified by BMI category [5]. This study had the longest follow-up of all studies that specifically examined BMI as the primary predictor. Though other factors were not controlled for, continence rates were higher in normal weight men at 1 month, 6 months, and 1 year. Our study provides 3 years of follow-up and corroborates the longer term recovery data demonstrated by Lee et al. [12].
We believe our results are robust based on longitudinal patient-reported outcome data. Geisinger serves a population of 3 million rural residents in central Pennsylvania with very little out-migration allowing for longitudinal measures. Additionally, instead of focusing on IPSS, we focused our patient-reported outcomes on a validated Leakage questionnaire and examined the impact of incontinence on daily life using IIQ and Behavior scores in a real-world cohort. Prior series are based on single-surgeon experiences; however, this series includes multiple surgeons.
Our retrospective study has some limitations. The majority of our patients were white and overweight/obese which is reflective of the population of central Pennsylvania. The small number of under-/normal weight men may make comparisons less robust. The retrospective nature of our study introduces selection bias, particularly when studying a population with perceived surgical risk. Surgeon preference may have led to exclusion of overweight/obese patients with multimorbidity. We were not able to control for use of adjunct therapies such as phosphodiesterase-5 inhibitors, though this was a limitation of other series as well [12]. Because of a multiple surgeon experience, there is heterogeneity in follow-up plans and survey time points, but we were able to standardize and control for time using analytic methods targeted at multiple measurements. Finally, these results may not be applicable to higher volume surgeons as they may have different outcomes or more data to draw from.
This study has important clinical ramifications, especially for preoperative and postoperative patient counseling. We have demonstrated that overweight and obese men have similar urinary and sexual function recovery curves compared to under-/normal weight men. Men in higher BMI categories may be reassured by the trajectory of quality of life recovery shown in our data. With rising rates of obesity in the surgical population, such information is also reassuring to urologists considering the risks and benefits of RALP in overweight and obese patients.
CONCLUSIONS
Overweight and obese men had similar postoperative recovery curves of urinary and sexual function as under-/ normal weight men undergoing RALP for clinically localized prostate cancer. This data may be useful in counseling overweight and obese patients regarding the trajectory of quality of life recovery after RALP.

 XML Download