

 PDF
PDF ePub
ePub Citation
 Print
Print


INTRODUCTION
The incidence of prostate cancer is increasing in Korea as well as globally. In 2013, the incidence rate of this disease in Korea was 37.6 per 100,000 persons, which represented an almost 5-fold increase over the rate reported in 2000 (7.2 per 100,000 persons) [12]. In that year, prostate cancer was the fourth most common malignancy in the population aged ≥65 years [12].
Magnetic resonance imaging (MRI) has proven to be effective for the detection, treatment exploration, and follow-up examination of prostate cancer [3]. In particular, diffusion-weighted MRI (DW-MRI), which is based on the mobility of hydrogen protons in water, has gained attention owing to its ability to differentiate aggressive tumor types with higher Gleason scores from indolent lesions [45678910]. The apparent diffusion coefficient (ADC) is a measure of the average rate of a hydrogen proton's movement (mm/s2). Therefore, the ADC decreases as tissue cells become denser. A tumor typically demonstrates denser cell distribution and sparser extracellular space; therefore, the ADC value is lower in prostate cancer tissue [3].
It has been reported that patients who meet the same high-risk prostate cancer criteria still exhibit a broad range of outcomes. Meanwhile, several recent studies have shown an inverse association between ADC values and Gleason scores, as well as other adverse prostate cancer pathologic features [5910111213]. However, to the best of our knowledge, no study has examined the relationship between ADC values and the prognosis of high-risk prostate cancer in particular. In this study, we investigated the relationship between ADC values and the prognoses of patients who met the D'Amico criteria for high-risk prostate tumors.
MATERIALS AND METHODS
1. Patients
Between January 2007 and December 2013, 1,844 prostate cancer patients underwent radical prostatectomy at our center. From among these patients, we included 549 who preoperatively underwent 3-T DW-MRI. After excluding patients who received neoadjuvant hormone therapy (33 persons) or radiation therapy (18 persons), we ultimately selected 157 patients who were determined to be at high risk according to D'Amico's criteria for prostate cancer (i.e., those with a biopsy Gleason score≥8, preoperative prostatespecific antigen [PSA] level≥20 ng/mL, or clinical stage≥T2c). The study protocol was approved by the Seoul National University Hospital Institutional Review Board (approval number: 1511-034-718); the requirement for informed consent was waived owing to the retrospective nature of the study.
2. MRI techniques
We used 3.0 Tesla (3-T) MRI systems (MagnetomVerio and Magnetom Trio, Siemens Healthcare, Munich, Germany) without an endorectal probe. Before undergoing MRI, patients were injected with 20-mg butylscopolamine (Buscopan, Boehringer-Ingelheim, Ingelheim, Germany) intramuscularly to suppress bowel peristalsis. We acquired multiplanar (axial, coronal, and sagittal) T2-weighted images with the following parameters: repetition time range/echo time range, 3,400–4,500/100–140; slice thickness, 3 mm; interslice gap, 0.3 mm; matrix, 512×318; field of view, 22 cm; number of signals acquired, 2; and parallel imaging acceleration factor, 2. We performed axial fat-suppressed single-shot echoplanar diffusion-weighted imaging with the following parameters: repetition time range/echo time, 6,500/77; slice thickness, 3.5 mm; no interslice gap; matrix, 192×192; field of view, 30 cm; number of signals acquired, 6; parallel imaging acceleration factor, 2; and b-values, 0 and 1,000 s/mm2 [14]. Because our hospital only had MRI equipment capable of producing images with b-values ≤1,000 s/mm2 between 2007 and 2013, we were unable to use b-values >1,400 as recommended by the new Prostate Imaging Reporting and Data System guidelines (ver. 2).
3. Acquisition of ADC values
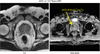
One uroradiologist examined the patients' ADC maps. First, the darkest areas of the pertinent histopathologic lesions were identified (Fig. 1) [15]. Next, lesions of similar or larger sizes were evaluated to obtain the mean ADC values. The diffusion-encoding gradients were applied as a bipolar pair at b-values of 0 and 1,000 s/mm2; the ADC maps were automatically generated on a pixel-by-pixel basis [16171819].
4. Statistical analysis
The area under the receiver operating characteristics curve was used to determine the optimal ADC cutoff. We used the t-test, chi-square test, and Cox progression model to describe the relationships between the variables. The relation between the ADCmean and the biochemical recurrence (BCR)-free survival rate was assessed using Kaplan-Meier analysis. Univariate and multivariate Cox proportional regression analyses were performed for the covariates of age, PSA, ADC value, pathologic Gleason score, and pathologic stage. A p-value of <0.05 was considered statistically significant; the IBM SPSS Statistics ver. 22.0 (IBM Co., Armonk, NY, USA) was used to analyze the data.
RESULTS
1. Patient demographics
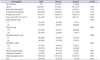
A total of 157 patients underwent analysis for age, body mass index (BMI), prostate volume, preoperative PSA level, biopsy Gleason score, pathologic Gleason score, clinical stage, pathologic stage, positive surgical margin, BCR, and postoperative follow-up period (Table 1). The mean patient age was 66.9 years, and the mean BMI was 24.2 kg/m2. The median prostate volume was 43.1 mL, while the mean PSA level was 24.4 ng/mL. The incidence of clinical stage ≤T2 was 79.6% while that of pathologic stage ≤T2 was 42.7%. A biopsy Gleason score≥8 was recorded in 72.6% of the patients, and a pathologic Gleason score≥8 was found in 30.6%. The mean postoperative follow-up period was 33.8 months. The total BCR rate was 43.9%.
2. Determination of the ADC cutoff and grouping of patients
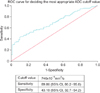
The patients showed a normal distribution curve, and the average ADC value was 677.3×10⁻⁶ mm2/s (standard deviation, 184.0×10⁻⁶ mm2/s). The area under the receiver operating characteristics curve was 0.691 (95% confidential interval [CI], 0.612–0.762), the sensitivity was 89.86 (95% CI, 80.2–95.8), and the specificity was 43.18 (95% CI, 32.7–54.2). The cutoff value of 746×10−6 mm2/s was chosen to maximize the discriminatory ability related to sensitivity and specificity (Fig. 2) [20]. Next, the patients were stratified into 2 groups according to this cutoff value; Group A comprised patients with measured tumor ADC values <746×10−6 mm2/s while group B patients had measured tumor ADC values ≥746×10−6 mm2/s. The data were comparatively analyzed in terms of age, PSA level, ADC value, pathologic Gleason score, pathologic stage, positive surgical margin, and BCR.
Various factors were compared between groups A and B (Table 1). Pathologic lymph node positive was recorded in 18.2% of the patients in group A and 4.3% of those in group B (p=0.021). A positive surgical margin was detected in 51.8% of the patients in group A and 34.0% of those in group B (p=0.041). BCR was observed in 55.5% of the patients in group A and 17.0% of those in group B (p<0.001).
3. Relationship between ADCmean and BCR-free survival rate
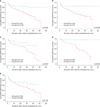
On Kaplan-Meier analysis, there was a significant difference in the BCR-free survival rate according to the ADCmean (p<0.001) (Fig. 3A). There is no decrease in the BCR-free survival rate of group B 30 months after the prostatectomy, whereas that of group A continuously decreased. By 50-month postradical prostatectomy, the BCR-free survival rate of group B was approximately 80%; in group A, it was approximately 20%. Additionally, we analyzed the significance of ADCmean regarding BCR-free survival according to pathologic Gleason score (≤7 vs. ≥8) and pathologic T stage (≤T2 vs. ≥T3) through subgroup analyses. As shown Fig. 3, group A also had significantly worse BCR among the subgroup of patients with pathologic Gleason score≤7 (p=0.002) (Fig. 3B) and those with pathologic T stage≤T2 (p<0.001) (Fig. 3D). However, such phenomenon was not observed among the subgroup of patients with Gleason score≥8 (p=0.051) (Fig. 3C) or those with pathologic T stage≥T3 (p=0.119) (Fig. 3E).
4. Correlation between prostate cancer-associated covariates and BCR
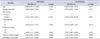
On univariate Cox proportional regression analysis, group A (HR, 3.744; p<0.001), pathologic ≥T3 disease (HR, 1.836, p=0.018), and pathologic lymph node positive (HR, 2.563; p<0.001) were significantly correlated with BCR, respectively. Multivariate analysis showed the same correlation of group A (HR, 3.238; p=0.002) and pathologic lymph node positive (HR, 2.242; p=0.009) (HRs, 1.728 and 1.787; p=0.001 and p=0.034, respectively). Age, PSA level, pathologic Gleason score≥8, pathologic ≥T3 disease, and surgical margin positivity were not significantly correlated with BCR (Table 2).
DISCUSSION
In this study, we investigated only patients with high-risk prostate cancer (PSA≥20 ng/mL or a preoperative biopsy Gleason score≥8), and found that ADCmean is significantly associated with BCR-free survival in this specific patient subset. MRI technology is continuously evolving, and its more extensive use in clinical trials and practice has shown to improve prostate cancer diagnosis and treatment planning [3]. Additionally, newly developed 3-T MRI systems have provided several useful diagnostic measures, such as the ADC value, for evaluating prostate cancer [4568910].
Verma et al. [4] claim that ADC values might help to predict the incidence of prostate cancer, especially for tumors located in the peripheral zone [8]. They also reported that the ADC values were negatively correlated with the postsurgical Gleason grade in patients with prostate cancer (r=−0.39 for peripheral zone cancer). Furthermore, both ADC values and tumor volumes were found to significantly predict tumor aggressiveness, specifically in the peripheral zone (area under the curve, 0.78). Similarly, we found that low ADC values were significantly correlated with BCR.
Hambrock et al. [5] reported that the ADC values obtained using 3-T MRI showed an inverse relationship with the Gleason grade in peripheral zone prostate cancer [910]. Moreover, a high discriminatory performance was attained when differentiating between low-, intermediate-, and high-grade cancer. However, because our cohort comprised only high-risk prostate cancer patients, a pathologic Gleason score ≥8 had no significant correlations with the BCR.
Both the tumor volume and true diffusion ADC were reported as significant and independent predictors of histologic progression by van As et al. [7] This was consistent with our findings that pathologic stage≥T3 disease and low ADC values were significant predictors of progression as determined by BCR on univariate Cox regression analyses. Furthermore, ADCmean<746×10−6 mm2/s measured on the ADC maps correlated with early BCR on Kaplan-Meier analysis and multivariate Cox regression analysis. The prognoses of patients with high-risk prostate cancers who had lower ADCmean values were worse.
As mentioned in the introduction, the ADC decreases as tissue cells become denser. A tumor typically demonstrates denser cell distribution and sparser extracellular space; therefore, the ADC value is lower in prostate cancer tissue. Denser tumor cellularity may be related with tumor stage and aggressiveness. So ADC value can be used as surrogate marker of tumor biology.
Because low risk patient group of prostate cancer has higher ADC value than high risk patient group of prostate cancer, it is more difficult to detect cancer and estimate prognosis in low risk patient group of prostate cancer than high risk patient group of prostate cancer. So we chose the high risk patient group of prostate cancer for analysis.
The reason that the PSA level and pathologic Gleason score≥8 did not affect BCR is that our inclusion criteria encompassed patients with PSA≥20 ng/mL or a preoperative biopsy Gleason score≥8; hence, our study was already aimed towards patients with advanced disease. We selected the 3-T MRI protocol because of higher magnetic field homogeneity and future applicability. Kitajima et al. [21] claim said that 3-T MRI may detect prostate cancer more effectively than 1.5 T MRI because of higher signal-noise ratio, faster acquisition time, and higher spatial resolution. Positioning lesions with low ADC values was difficult owing to the ADC readers' subjective differences, which resulted in subtle variations in the reading of these values; however, the range of ADC reading variations was small. Automated reading of ADC values using computer software would be helpful for future studies.
One abnormal result which we found is the discrepancy between biopsy Gleason score≥8 (72.6%) and pathologic Gleason score≥8 (30.6%). Not only group A (ADC<746×10−6 mm2/s) but also group B (ADC≥746×10−6 mm2/s) have lower pathologic Gleason score≥8 than biopsy Gleason score≥8 (Table 1). We discussed this down grading with Department of Pathology in Seoul National University Hospital, but could not find causes. So we need to investigate this problem further.
One limitation of our study is its retrospective nature; selection bias was possible because we only included patients who initially underwent prostatectomy. Additionally, we used the average ADC value, whereas other studies reported the minimum, 10th, and/or 25th percentiles as well as other metrics such as skewness and kurtosis. Inability to use b-values other than 0 and 1,000 s/mm2 is also a limitation of our study; moreover, translating our specific cutoff value across different scanners and protocols is also difficult. Therefore, devising a new universal cutoff value is warranted. When we tried propensity score matching about relationship between pathologic lymph node positive and BCR-free survival rate, we could not secure statistic significance because of small number of patients. This means that we cannot exclude confounding factor except ADC value. Nevertheless, our research has important clinical implications in that the ADCmean can predict the prognoses of patients with high-risk prostate cancer.
CONCLUSIONS
In patients with high-risk prostate cancer, ADCmean is significantly associated with BCR-free survival. Therefore, the ADC value is a useful tool for predicting the prognoses of patients with high-risk prostate cancer. DW-MRI ADC may better differentiate aggressive prostate cancers from indolent tumors. 3-T DW-MRI ADC may therefore stratify high-risk patients according to prognosis.
 XML Download