

 PDF
PDF ePub
ePub Citation
 Print
Print


INTRODUCTION
Prostate-specific antigen (PSA) has been widely used for a screening tool for early prostate cancer detection. The European Randomized Study of Screening for Prostate Cancer showed that PSA screening could reduce prostate cancer-specific mortality [1]. However, PSA has a poor specificity at the common cutoff of 4 ng/mL [2], and this may lead to many unnecessary negative prostate biopsies and biopsy-related morbidities. There is a need for a better tool for early prostate cancer detection, and Prostate Health Index (PHI) is one of the more promising biomarkers being investigated.
Previous studies showed that PHI and the percentage of PSA isoform [-2]proPSA (p2PSA) were more accurate than total PSA (tPSA) or %free-to-total PSA (%fPSA) in predicting prostate cancer [3]. In 2012, the United States Food and Drug Administration has approved the use of PHI and p2PSA in men older than 50 years old with a total PSA 4–10 ng/mL and normal DRE to reduce unnecessary prostate biopsies. However, the incidence of prostate cancer varies widely between different countries and ethnicities [4]. In the Western population, the cancer detection rate was 20.7% for patients with normal DRE and PSA of 4.1–9.9 ng/mL [5]. Whereas in our locality, the rates of prostate cancer detection in Chinese men with normal DRE were 13.4% for PSA 4–10 ng/mL and 21.8% for PSA 10.1–20 ng/mL [6]. At the PSA level of 10–20 ng/mL, the rate of prostate cancer detection in Chinese men is more comparable to that of the Western population at the PSA level of 4–10 ng/mL. We postulated that the use of PHI and p2PSA could be extended to PSA level of 10–20 ng/mL in Chinese men, and this may be more clinically applicable and beneficial.
Na et al. [7] previously reported the performances of PHI and p2PSA in Chinese men with PSA 10.1–20 ng/mL. However, the cohort was relatively heterogeneous as patients with abnormal DRE were also included in this study. The true performances of PHI and p2PSA in patients with PSA 10–20 ng/mL and normal DRE remained undetermined. In this current study, we investigated the diagnostic performances of PHI and percentage of [-2]pro-prostate-specific antigen (%p2PSA) in a homogeneous cohort of Chinese men with PSA 10–20 ng/mL and normal DRE.
MATERIALS AND METHODS
1. Study design
All consecutive patients with PSA 10–20 ng/mL and normal DRE who agreed to undergo transrectal ultrasound (TRUS)-guided prostate biopsy were recruited for prospective blood sample collection and informed consents were signed. There were 391 men with PSA 10–20 ng/mL, and 79 men with PSA 10–20 ng/mL and abnormal DRE were excluded. Blood samples from the resulting 312 consecutive patients with PSA 10–20 ng/mL and normal DRE were collected prospectively immediately before TRUS biopsy from November 2008 to July 2015.
Blood samples were centrifuged within 3 hours after blood taking, and the serum was stored at –80℃. The bloods were subsequently analyzed for tPSA, free PSA (fPSA), and p2PSA using the Beckman Coulter Access 2 Immunoassay System (Beckman Coulter Inc., Brea, CA, USA) and according to the criteria described by Semjonow et al. [8]. Men with known history of prostate cancer, abnormal digital rectal examination (DRE), usage of androgen deprivation therapy or 5 alpha-reductase inhibitor before blood taking would be excluded from this study.
Patients had TRUS prostate biopsy with 10 biopsy cores taken at peripheral portions of the prostate gland. The biopsy specimens were evaluated by experienced genitourinary pathologists. Prostate cancer was graded according to International Society of Urological Pathology 2005 consensus [9]. This study was conducted in a university hospital and the study protocol was approved by the Joint Chinese University of Hong Kong-New Territories East Cluster Clinical Research Ethics committee. This study conforms to the provisions of the Declaration of Helsinki (as revised in Tokyo 2008).
2. Study outcomes
The primary outcome of the study was to compare the diagnostic accuracies of %p2PSA and PHI with tPSA and %fPSA in predicting prostate cancer, as determined by the area under curves (AUCs) of the receiver operating characteristic (ROC) curves. All PSA values were derived from Hybritech calibration. The ability of %p2PSA and PHI in predicting high grade prostate cancers (Gleason score 7 or above) [1] were also analyzed. %p2PSA was calculated by p2PSA (pg/mL)/fPSA (ng/mL)/1,000. PHI was calculated using the following formula: (p2PSA/fPSA)×√total PSA.
3. Sample size calculation
In the Chinese study by Na et al. [7], regardless of the DRE findings, a difference in AUC of 0.23 between PHI and tPSA was demonstrated in patients with PSA 10–20 ng/mL. In our previous study [10] on patients with PSA 4–10 ng/mL and normal DRE, a difference in AUC of 0.234 between PHI and tPSA was demonstrated. In this current study, in order to detect a difference in AUC of 0.20 with alpha error 0.05 and 80% power, an estimated sample size of 250 is required.
4. Statistical analysis
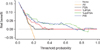
T-test and Mann-Whitney U-test were used to compare normally and nonnormally distributed continuous variables, respectively. Chi-square test was used to compare categorical variables. Univariate and multivariate logistic regression was used to predict status of prostate cancer and high grade prostate cancer. The defined base model in multivariate analysis included age, tPSA, and status of initial/repeated biopsy. Using the nonparameteric method of DeLong, the AUC of the ROC curves were compared between the defined base model, base model+%fPSA, base model+%p2PSA, and base model+PHI. Decision curve analysis (DCA) [11] was used to evaluate whether adding PHI or %p2PSA to the base model would yield net clinical benefit. The decision curves were plotted with y-axis being the net clinical benefit and the x-axis being the threshold probability. The threshold probability is the probability of the outcome (diagnosis of prostate cancer) that the patient would opt for prostate biopsy.
All statistical analyses were performed using IBM SPSS Statistics ver. 22.0 (IBM Co., Armonk, NY, USA). The R package "pROC" [12] was used to compare ROC curves and decision analysis curves were plotted with R ver. 3.1.1 (The R Foundation for Statistical Computing, Vienna, Austria). A 2-sided p-value of <0.05 was considered significant.
RESULTS
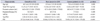
Out of the 312 men who fit the inclusion criteria, 260 samples were initial biopsies and 52 were repeated biopsies. 53 patients (17.0%) were diagnosed to have prostate cancer after TRUS biopsy. The baseline characteristics of the cohort were listed in Table 1. The mean age was 68.1±6.2 years old, and patients with prostate cancer had significantly older age. The tPSA values between prostate cancer patients and noncancer patients had no significant difference. %p2PSA and PHI were significantly higher in prostate cancer patients (Table 1).
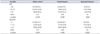
The rates of prostate cancer detection for different PHI ranges were 6.7% for PHI <35, 22.8% for PHI 35–55, and 54.5% for PHI >55 (p<0.001) (Table 2). The rates of prostate cancer detection for different %p2PSA ranges were 7.1% for %p2PSA <1%, 22.6% for %p2PSA 1%–1.5%, and 52.8% for %p2PSA >1.5% (p<0.001) (Table 2). Similar trends for initial and repeated biopsies were observed for both PHI and %p2PSA, except that for PHI < 35 and %p2PSA < 1%, the positive biopsy rates were particularly low at 3.1% and 0% respectively (Table 2).
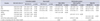
Concerning the prediction of prostate cancer, the AUC for tPSA, %fPSA, %p2PSA, and PHI were 0.58, 0.69, 0.76, and 0.73, respectively upon univariate analyses (Table 3). Upon multivariate analyses, using the base model including age, tPSA and status of initial/repeated biopsy, the AUC was 0.64 (95% confidence interval [CI], 0.56–0.72) (Table 3). Adding %fPSA to the base model increased the AUC to 0.75 (95% CI, 0.67–0.82; p=0.007). Adding %p2PSA to the base model increased the AUC to 0.79 (95% CI, 0.71–0.86; p<0.001), and adding PHI to the base model increased the AUC to 0.78 (95% CI, 0.70–0.86; p<0.001).
With the concern of any interaction between PSA and other PSA derivatives in the multivariate models, interaction tests have been performed. There was no significant interaction between PSA and %fPSA (p=0.275), PSA and %p2PSA (p=0.510), and PSA and PHI (p=0.538). In addition, all 3 models (base model+%fPSA, base model+%p2PSA, and base model+PHI) had lower AUC values when PSA was removed from each model. Therefore, PSA should remain in the 3 models.
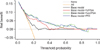
Upon DCA in predicting prostate cancer diagnosis (Fig. 1), %p2PSA and PHI demonstrated net clinical benefit over tPSA or %fPSA over whole range of threshold probabilities. Comparing the different models upon DCA (Fig. 2), adding %p2PSA or PHI to the base model demonstrated net clinical benefit over whole range of threshold probabilities.
PHI and %p2PSA predicted high grade (Gleason 7 or above) prostate cancers in the PSA range of 10–20 ng/mL. The positive biopsy rate of high grade prostate cancers was 7.7% (24 of 312) for the whole cohort. Dividing into different PHI ranges, the proportion of high grade prostate cancers were 2.2% (4 of 178) for PHI <35, 7.9% (8 of 101) for PHI 35–55, and 36.4% (12 of 33) for PHI>55 (chi-square test, p<0.001). The AUCs for high grade prostate cancers were 0.62 for tPSA, 0.68 for base model, 0.77 for base model+%fPSA, 0.83 for base model+%p2PSA, and 0.84 for base model+PHI.
By utilizing the PHI cutoff of 35 to men with PSA 10–20 ng/mL and normal DRE, 57.1% (178 of 312) biopsies could be avoided with the cost of missing 6.7% (12 of 178) any grade prostate cancer and 2.2% (4 of 178) high grade prostate cancer in men with PHI<35.
All Gleason scores in the current study were derived from biopsy pathology. There were 15 out of 53 (28.3%) cancer cases who had radical prostatectomy performed, and others treatments included radiotherapy with or without androgen deprivation therapy (34.0%), active surveillance (3.8%), watchful waiting/refusal of treatment (18.9%), and androgen deprivation therapy only (13.2%). Among the 15 cases with radical prostatectomies done, 8 were biopsy Gleason 6 cancers and none of them had any upgrading of Gleason score in final pathology. For the 2 prostatectomy cases with PHI<35, there was one Gleason 6 and one Gleason 8 on biopsy, but both were organ confined disease (pT2) in final pathology. On the other hand, 3 out of 13 prostatectomy cases with PHI >35 had pT3 disease.
DISCUSSION
The rates of prostate cancer detection in Caucasians in the classical grey-zone of PSA 4–10 ng/mL ranged from 26%–47% [4]. Different markers for predicting prostate cancer including fPSA [2], PSA density [1314], PCA3 [1516], p2PSA and PHI [3] mainly targeted patients with PSA <10 ng/mL as the rate of prostate cancer detection in this range is lower and the use of these markers could help reduce unnecessary prostate biopsies. Compared to Caucasians, Chinese men have much lower rates of positive biopsies across different PSA ranges [6]. In our current study on Chinese men with PSA 10–20 ng/mL and normal DRE, the overall prostate cancer detection rate was 17.2%, which is comparable to that of the Western population at PSA level of 4–10 ng/mL [5]. Another recent Chinese cohort showed a higher positive biopsy rate of 36.5% for men with 10–20 ng/mL (about 30% abnormal DRE) [7], but that was still similar to that in Caucasian with PSA 4–10 ng/mL. Although PHI was classically indicated in men with PSA 4–10 ng/mL and normal DRE, we believe PHI may play an important role at PSA 10–20 ng/mL in the Chinese population, and the current study is the first to address this specific group of men.
A previous study on Chinese men reported better performance of p2PSA and PHI than total or fPSA across a wide range of PSA. However, about 30% of the cohort had abnormal DRE and the results should be interpreted with caution [7]. As the risk of prostate cancer in those with abnormal DRE is much higher (52% in the range of PSA 10–20 ng/mL) [6]. Prostate biopsy should be offered directly instead of PHI. The performances of p2PSA and PHI may also be different in men with abnormal DRE. The true performances of PHI and p2PSA in patients with PSA 10–20 ng/mL and normal DRE remained undetermined. In the current study, our analyses were based on a homogeneous cohort of Chinese men with PSA 10–20 ng/mL and normal DRE, and we believe the results would be of significant value.
The current study demonstrated the role of %p2PSA and PHI in predicting prostate cancer diagnosis in a Chinese cohort with PSA 10–20 ng/mL with normal DRE. For the group of patients with %p2PSA<1% (n=183) and PHI<35 (n=178), the rates of prostate cancer detection were only 7.1% and 6.7%, respectively. Upon univariate analyses, the AUCs of %p2PSA and PHI were better than tPSA and %fPSA. In the multivariate logistic regression model, adding %p2PSA or PHI to the predefined base model (Age, tPSA, and status of initial/repeat biopsy) significantly increased the predictive accuracy from 0.64 to 0.78–0.79. Our results showed that p2PSA and PHI could help stratify the risk of prostate cancer in Chinese men with PSA 10–20 ng/mL with normal DRE. In Chinese men with PSA 10–20 ng/mL, biopsy decisions should not be based on PSA alone, but should be based on the additional PHI and p2PSA information after personalized counselling by a Urologist.
PHI and p2PSA were associated with more aggressive pathologies in the tPSA range of 4–10 ng/mL in previously published studies [1718]. In the current study, %p2PSA and PHI were also associated with more aggressive prostate cancers in the range of PSA 10–20 ng/mL. The positive biopsy rates of Gleason 7 or above prostate cancers for PHI ranges of <35, 35–55, and >55 were 2.2%, 7.9%, and 36.4%, respectively. PHI could serve as a guide for men who wish to be treated only if there is aggressive prostate cancer.
Analyses of prostate cancer (PCa) and high grade prostate cancer in the current study were derived from biopsy pathology but not from prostatectomy pathology, as only 28.3% (15 of 53) PCa men opt for radical prostatectomy in this cohort. Among the 15 cases with prostatectomy pathology, 2 had PHI<35 and 13 had PHI>35. None of the 2 cases with PHI<35 had pT3 disease, while 3 out of 13 cases with PHI>35 had pT3 disease. These findings were in line with previous evidence showing PHI was associated with more aggressive prostatectomy pathology [19]. Furthermore, none of the 15 prostatectomy pathology showed upgrading of Gleason score from biopsy pathology, and this might support the fact that biopsy pathology was representative in the current study. A lack of final pathology in all cancer cases, however, was definitely a limitation of the study.
In contrast to Caucasian men, Asian men have very different prostate cancer epidemiology. The incidence of prostate cancer in Caucasian men was 5–10 times more than that in many regions of Asia and 10 times of that in Chinese men [20]. Most prostate cancers in Caucasians were diagnosed at an early stage, whereas in China, 65% PCa were diagnosed with PSA>10 ng/mL, and 45% PCa were either locally advanced or metastatic. Nevertheless, there were variations in Asia, and only about 35%–40% prostate cancers were diagnosed with PSA>10 ng/mL in Hong Kong, Singapore, and Korea [20]. The above differences in cancer epidemiology in Caucasian and Asian might be explained by lifestyle and genetic differences. In general, Asians consume more vegetables and less meat in their diet compared with Western population [20]. In terms of genetic differences, there were significant variations in single nucleotide polymorphisms [20]. The rates of TMPRSS2-ERG gene fusion [21] and PTEN inactivation [22] were also lower in Asian or Chinese population compared with Caucasians.
The strengths of this study included the prospective collection of blood samples of all consecutive patients, the emphasis on a homogeneous patient group with PSA 10–20 ng/mL and normal DRE, the analyses of blood samples according to guidelines recommended by Semjonow et al, [8] the use of standardized systemic 10-core prostate biopsy, and the interpretation of all biopsy specimens by experienced genitourinary pathologists in our institution. The limitations of this study included single institution data, the lack of prostatectomy pathology in most cases, and the lack of comparison with other predictive models or investigation modalities.
 XML Download