

 PDF
PDF ePub
ePub Citation
 Print
Print


INTRODUCTION
Prostate cancer (PC) is one of the most common malignancies among men in the United States and is the second leading cause of male cancer death [1]. Radical prostatectomy (RP) remains the gold-standard treatment method for localized PC but postoperative erectile dysfunction (ED) is a major complication of the treatment [2]. ED means that the state that an erection is not sufficient or maintained sufficiently for a satisfactory sexual life, so it lowers the quality of life and causes distress to the patients. ED after the RP is often caused by surgical injury of the cavernous nerve (CN), which is the final neuronal pathway of penile erection. ED has been reported to occur in 25%–75% of patients who underwent RP [3].
Common types of cavernous nerve injury (CNI) include traction, laceration, and compression, which increase the number of apoptotic cells in endothelial and smooth muscle cells of the corporal cavernous tissue [4]. Many studies have used the CNI rat model to research the physiological mechanisms of ED, such as penile shrinkage, loss of key neurotransmitters, and a distinct pattern of smooth muscle cell apoptosis in the corpora cavernous tissue [5]. However, a little is known about the molecular mechanisms and biological processes of ED induced by CNI.
Gene expression profiling and genome-wide analysis can provide a foundation for discovering the molecular mechanisms of ED and global genomic alteration caused by CNI in the corpora cavernous tissue. In this study, we performed microarray experiments on the cavernous tissue of the CNI-induced ED model and compared the results with a diabetes-induced ED model to obtain a global view of biological processes and to suggest markers for the diagnosis for ED.
MATERIALS AND METHODS
1. Tissue harvest and sample preparation
In total, 6 adult male Sprague Dawley rats (12 weeks old) were divided randomly into 2 groups: sham operation (n=3) and bilateral CN resection (n=3) groups. The experimental rats were anesthetized intraperitoneally with ketamine (50 mg/kg) and the bilateral CN in the resection group was excised, as described previously [6]. The bilateral CN in the sham operation group was also identified by the lower abdominal midline incision, but no direct CN manipulation was performed. This procedure was performed carefully to prevent any possible reinnervation [7]. Abdominal wounds were then closed with sutures.
At 12 weeks after CN resection, the rats in both groups were anesthetized and penile tissue was harvested. The corpus cavernosum of the penis was dissected to penoprostatic junction, excluding any prostate tissue, urethral tissue, and glans tissue. The corpus cavernosum was blotted to remove blood and the tissue was snap-frozen in liquid N2 for the next experiments.
2. Measurement of erectile responses
At 12 weeks after CNI, the measurement of erectile responses was performed based on Rehman et al. [8]. The animals were anesthetized and placed in a supine position, and systemic arterial blood pressure (BP) was monitored via carotid artery cannulation with polyethylene (PE)-50 tubing. The prostate and bladder were exposed through a midline abdominal incision. The major pelvic ganglion, pelvic nerves, and CN were identified posterolateral to the prostate on one side, and an electric stimulator with stainless steel bipolar hook electrodes was placed around the CN for electrical stimulation. To monitor intracavernosal pressure (ICP), a 25-gauge cannula was filled with 250 U/mL of heparin, connected to PE-50 tubing and inserted into the right crura. Both systemic and intracavernosal BP were measured with a transducer connected to a computerized system for data acquisition (PowerLab ADI Instruments, Sydney, Australia). Real-time display and recording of pressure were performed using the Chart 5 software (ADI Instruments). Electrical field stimulation parameters were as follows: voltage, 5 V, duration 60 seconds. The ratio of maximal ICP to mean arterial BP obtained at the peak of erectile response was determined to control for variations in arterial BP.
3. RNA preparation and microarray experiment
Total RNA was extracted from the rat penile tissue sample using the TRI Reagent (MRC, Cincinnati, OH, USA) according to the manufacturer's instructions. Total RNA (1 µg) was labeled and amplified using Universal Linkage System RNA labeling kit (Kreatech Diagnostics, Amsterdam, The Netherlands) [9]. The Cy3-labeled RNAs were resuspended in 10 µL of hybridization solution (GenoCheck, Ansan, Korea). The resuspended RNAs were placed on an Agilent Rat genome 4×44K array (GPL7289, Agilent Technologies, Santa Clara, CA, USA) and covered by an A4 hybridization mixer (Biomicro Systems, Salt Lake City, UT, USA). The slides were hybridized for 12 hours at 42℃ with a MAUI hybridization system (Biomicro Systems). The hybridized slides were washed in 2× saline sodium citrate (SSC), 0.1% sodium dodecyl sulphate for 2 minutes, 1× SSC for 3 minutes, and then 0.2× SSC for 2 minutes at room temperature. The slides were centrifuged (3000 rpm, 20 seconds) to dry them. Hybridized slides were scanned with the Axon Instruments Agilent scanner and the scanned images were analyzed with the Feature Extraction software (ver. 10.7.3.1; Agilent Technologies) and GeneSpring GX 11.0 (Agilent Technologies). Spots that were judged as substandard by visual examination of each slide were flagged and excluded from further analysis. Relative signal intensities for each gene were generated using the Robust Multi-Array Average algorithm. The data were processed based on the median polish normalization method using the GeneSpring GX 11.0, and normalized to 19,550 probe sets excluding missing gene information. Our microarray raw data are available at the Gene Expression Omnibus database (http://www.ncbi.nlm.nih.gov/geo) under accession number GSE31247.
4. Collection of ED model microarray data and intensive preprocessing
We downloaded gene expression profile of ED in diabetes-induced rats (GSE2457) [10]. At 10 weeks after streptozotosin-induction of diabetes, they confirmed decreased erectile function in diabetic animals in response to CN stimulation by ICP measurements. The penis was rapidly dissected free at the level of the crura. We expect that this diabetes-induced ED model will be a good comparison with our CNI-induced ED model. The quality of microarray data was assessed through the pipeline at http://www.arrayanalysis.org for intensive and strict quality control test to filter out low-quality microarray samples [11]. We used the same criteria for high-quality samples described by Lee et al. [12]. All raw data were normalized using the single-channel array normalization method, which standardizes the individual probe-level data by deducting array-specific background using only data from within each microarray [13]. Custom chip-definition files (ver. 17.1.0) provided by the BrainArray resource were used in the normalization process to map microarray probe values to 9,180 genes and excludes inaccurate or wrongly annotated probes [14].
5. Feature selection and classification analysis using a machine learning tool
Feature selection and phenotype classification based on the gene expression profile were performed using a machine learning tool, Weka (Waikato Environment for Knowledge Analysis; ver. 3.6.3) [15]. We used sequential minimal optimization (SMO) [16] and leave-one-out cross-validation [17] as classifier algorithms to obtain a statistically predictive measurement in the small sample size microarray data set [18]. Feature selection involves processing the data to find certain properties and select those features that can most effectively predict a class from each sample group. ReliefF [19] was used to rank features based on their ability to classify microarray samples. In our study, we set the 'average merit' to >0.1 for feature selection.
6. Computational analysis and statistics: unsupervised hierarchical clustering, GSEA, and SAM
Unsupervised hierarchical clustering analysis using the Gene Pattern (ver. 3.7.0) software [20] was performed with the features selected by the ReliefF algorithm. For the unsupervised hierarchical clustering parameters, Pearson correlation was set for the column and row distance measures, and a pair-wise complete-linkage was set up as the hierarchical clustering method.
Gene set enrichment analysis (GSEA) was used to examine the enrichment of significant gene signatures in the 2 different biological groups using the gene ontology (GO) biological process signature databases (ver. 4.0) [21]. As the number of samples was small, p-values were calculated by permuting the genes 1,000 times in the process of finding enriched gene signatures. An alteration of gene signatures with a false discovery rate (FDR) q-value <0.4 between 2 classes was considered significant. An enrichment score (ES) in the GSEA results shows the strength of the relationship between gene signatures and phenotypes. The normalized enrichment score accounts for the size of each gene signature. Gene signatures that were down-regulated in CNI- or diabetes-induced ED model would have negative ES values.
Significance analysis of microarrays (SAM) [22] was used to identify statistically significant genes that were expressed differentially between CNI-induced ED or diabetes-induced ED versus normal cavernous tissue (NCT). We estimated our empirical null distribution using 1,000 permutations and set a FDR threshold (q-value) of 0.01 for stringent feature selection.
All procedures and methods were approved by the ethical committee of the Samsung Medical Center Institutional Review Board before commencement of the study (CA82222). This study has no conflict of interest.
RESULTS
1. Erectile function in CNI rats
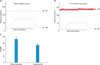
The mean ICP in response to CN stimulation in the CNI group was significantly lower than in the sham operation group (p<0.05). These responses were reproducible 30 minutes after the initial stimulation. The values for ICP and BP were 94.4±8.3 and 129.8±3.5 cmH2O, respectively, for the sham operation group, and 73.3±9.4 and 134.7±7.1 cmH2O, respectively, for the CNI group. For the statistical comparison of stimulation effects, the mean amplitude of the ICP response at each level of nerve stimulation was expressed as a fraction of the mean BP (ICP/BP) during nerve stimulation. The mean ICP/BP for the CNI group (0.54±0.4) was significantly different from the sham operation group (0.73±0.8, p<0.05) (Fig. 1). This result shows that ED was induced successfully by CNI in rat corporal cavernous tissue.
2. Supervised classification analysis of microarray data
In the CNI-induced ED microarray data, two NCT and one CNI-induced ED samples were misclassified (predictive accuracy 50%, Table 1). In the diabetes-induced ED microarray data, three control samples were misclassified (predictive accuracy 70%, Table 1). These results indicated that the small size of samples that include unnecessary features cannot produce accurate predictive accuracy in classification analysis [22]. Thus, we performed feature selection to select a subset of strongly relevant features for CNI- and diabetes-induced ED gene expression profiles. The ReliefF algorithm selected 2,970 probe sets and 2,457 genes in the CNI- and diabetes-induced ED models, respectively. Classification accuracy after the feature selection was increased to 100% in both microarray data sets (Table 1).
3. Unsupervised hierarchical clustering analysis
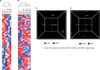
Unsupervised hierarchical clustering analysis with all 19,550 probe sets in CNI-induced ED and all 9,180 genes in diabetes-induced ED models did not form distinct clusters against normal tissue samples (data not shown). However, hierarchical clustering analysis after feature selection built a better hierarchy of clusters to split normal versus ED model gene expression profiles. Normal and CNI-induced ED samples were perfectly split to each cluster in hierarchical clustering analysis with 2,970 selected features (Fig. 2A). On the other hand, in the hierarchical clustering analysis with 2,457 selected features in diabetes-induced ED model, two normal samples still clustered to the diabetes-induced ED group (data not shown). This was partly because SMO classification and hierarchical clustering use different algorithms. After excluding the 2 wrongly clustered normal samples, the rest of the three normal and 5 diabetes-induced ED samples could be separated to different clusters, showing distinct gene expression profiles in the heat map (Fig. 2B). These results showed that diabetes- and CNI-induced ED cavernous tissue have different gene expression profiles from NCTs by unsupervised clustering methods, too.
4. Gene signatures modulated in CNI- and diabetes-induced ED models
To assess functional gene regulation and identify significantly altered gene signatures of biological process in CNI- and diabetes-induced ED models, we used a statistical approach applying an external gene annotation standard, GO [20]. The GSEA was carried out with the final genes selected by ReliefF with average merit >0.1. In the CNI-induced ED model, REPRODUCTIVE_PROCESS, ANAOMICAL_STRUCTURE_DEVELOPMENT, SYSTEM_DEVELOPMENT, and NEGATIVE_REGULATION_OF_DEVELOPMENTAL_PROCESS gene signatures were downregulated (Table 2). In the diabetes-induced ED model, SKELETAL_DEVELOPMENT,ION_TRANSPORT, NEUROLOGICAL_SYSTME_PROCESS, SENSORY_PERCEPTION, SYSTEM_DEVELOPMENT, TISSUE_DEVELOPMENT, and TRANSMISSION_OF_NERVE_IMPULSE gene signatures were downregulated related to ED (Table 3). We observed gene signatures regarding tissue development were downreulatged commonly in both models. Also, this result suggests that the function of genes selected by ReliefF in both models is commonly involved in ED phenotype.
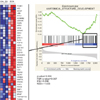
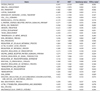
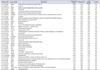
To understand the effect of CNI on ED status, we analyzed genes belonging to the ANATOMICAL_STRUCTURE_DEVELOPMENT gene signature. An enrichment plot of the ANATOMICAL_STRUCTURE_DEVELOPMENT gene signature showed the distribution of up- and downregulated genes between normal cavernous and CNI penile tissue (Fig. 3). In the ANATOMICAL_STRUCTURE_DEVELOPMENT gene signature, 39 genes were found to belong to the leading edge subset (LES). The heat map in Fig. 3 displays the different gene expression pattern of the 39 LES genes between normal cavernous and CNI penile tissue. Table 4 lists the 39 LES genes with the information on fold change and rank metric score.
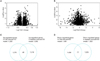
From the features selected by the ReliefF algorithm, SAM analysis identified 2,816 and 2,564 genes that were significantly down- or upregulated in the CNI- or diabetes-induced ED model versus normal tissues, respectively. Volcano plot representation of the SAM results showed the magnitude of fold change (in x-axis) and significance (p-value in y-axis) of the genes. The magnitude of fold change in the CNI-induced ED model was not large (range of –1.5 to 1.5 in the x-axis of Fig. 4A) compared to that in the diabetes-induced ED model (range of –6 to 6 in the x-axis of Fig. 4B). However, most of the differentially expressed genes in the CNI-induced model showed significant p-values like the diabetes-induced ED model (-log10 p>1.30 means p<0.05 in the y-axis). Further analysis revealed 46 up-regulated and 77 down-regulated genes that overlapped in the CNI- and diabetes-induced ED models (Fig. 4C, D, respectively).
DISCUSSION
The main pathophysiologies of ED are vascular insufficiency and autonomic neuropathy. ED results from endocrine dysfunction, partial Wallerian degeneration due to CNI, which disrupts the linkage with normal nerve tissue and consequently causes the alterations and atrophy in the smooth muscle and white membrane of the corpus cavernosum. Moreover, secondarily, it induces cavernous smooth muscle cell apoptosis, the ratio change between smooth muscle and collagen, and atrophy in endothelial cells, which eventually ED [52324]. However, insights from the CNI-induced ED mechanism and the effects of CNI on the ED process have not thoroughly studied.
Here, we provide the first analysis of gene alterations in a CNI-induced ED rat model through microarray analysis. Similar gene signature alterations were present in the CNI-induced ED rat model and the diabetes-induced rat model. User et al. found a group of genes that were altered in a postradical prostatectomy model of ED. The SMR1 gene in particular, which is speculative for clinical relevance in penile function, was 82.5 fold down-regulated in the CN transaction group [23]. However, these studies failed to investigate the biological processes or molecular mechanisms for ED induced by CNI with a genome-wide expression profile. On the other hand, the association between ED and diabetic patients was reported a long time ago. Diabetes can affect all components of the erectile response because it is a complex pathology that causes neural and vascular damage in the penis. Men with diabetes suffer from more severe ED and comply less with pharmacological therapies for ED [24]. Collagen type 1 is the most abundant form of collagen in human and rat erectile tissues and forms the bulk of the matrix structure of the cavernosum. Hipp et al. [25] performed microarray experiments for gene expression profile analysis and found collagen I and actin genes, which play roles in maintaining muscle tensile strength and structure, were down-regulated in the erectile tissue of the streptozotocin-diabetes model. Colla1 was significantly down-regulated in the CNI-induced ED. It is interesting that ApoE (apolipoprotein E), which has been studied in hypercholesterolemia-induced ED using knockout mice and resulted in impaired ED, was up-regulated in the CNI-induced ED model [26]. Also, elastic fiber-related genes, such as Eln, were significantly down-regulated in the CNI-induced ED model. Elastin deficiency is known to lead to erectile dysfuncion [10]. Hu et al. [27] performed microarray experiments for gene expression profile analysis and found Cxcl12, Tgfbr1, Asns, Bdkrb1, and Cdh3 genes, which play roles in oxidative stress-induced genes, were up and downregulated in the ED rat model. Bdkrb2 was significantly down-regulated in the CNI- and diabetes-induced ED models. Bdkrb1 and 2 played an important role in relieving DNA damage and apoptosis [28]. The 77 genes that were commonly downregulated in the CNI- and diabetes-induced ED models included Serpine2 [29].
The limitations of this study are that we used the small number of subjects and we did not perform lab experiments to validate the gene alterations in corpus cavernosum of CNI-indued ED model due to finite resources. Nonetheless, using statistical and computational analyses we were able to demonstrate changes in gene expression in the CNI-induced ED rat models and compared the results with the diabetes-induced ED model to identify genes that might be involved in ED. Experiment with Larger numbers of subjects and examining the functions of ED-involved genes are necessary in further studies. The accuracy of this study may also be low because tissue from not only the corpus cavernosum, but also the tunica albuginia, was used in the microassay.
Our study showed that CNI and diabetes induced downregulation of the gene signatures associated with neurological processes and anatomical structure development that might play important roles in maintaining proper erectile function and cavernous structure. We were unable to reveal exactly how the 39 LES CNI-induced rat model genes and the 77 genes that were downregulated in both rat models influence the pathogenesis of ED, although these genes are presumed to be related to nerve regeneration. Findings from our study expand the scope of potential candidate genes and pathways that are dysregulated in CNI and can have a negative impact on erectile function. The various genes identified in our study can be further evaluated as diagnostic markers and potential drug targets in patients with CNI-induced ED.
CONCLUSIONS
ED is often caused by diabetes and CNI and negatively affects the quality of life, especially in younger patients. However, the mechanism(s) and molecular alteration(s) in ED have not been examined sufficiently. We performed microarray experiments to understand the gene signature alterations in the corporal cavernous tissue of the CNI-induced ED rat model. Additionally, we used public microarray data from a diabetes-induced ED model to compare it with our results in terms of gene expression profile. We found that system and anatomical structure development-related gene signatures were downregulated in both the diabetes- and CNI-induced ED penile tissues versus controls. Also, we identified candidate genes that were commonly downregulated in the CNI-induced and diabetes-induced ED models; these may be useful for novel molecular-based therapies for ED. These findings on gene expression changes in the diabetes- and CNI-induce ED models may provide hints for targets for ED treatment and for biomarkers to predict the effects of drug treatment.


 XML Download