Journal List > Korean J Leg Med > v.39(3) > 1087969

Park, Choi, Park, Kim, and Choi: Profile of Forensic Autopsy Practices in Small Towns and Cities in Rural Areas

Abstract

Forensic autopsy service in a metropolitan area of Korea is well established and optimized for high population density based on high social system and infrastructures. However, forensic autopsy in rural areas in our country might be affected due to their low population density, and inconveniences related to special and temporal limitations as well as cultural and traditional limitation. Therefore, for an advanced and optimized model of forensic autopsy service in rural areas, we performed a retrospective analysis on the profile of forensic autopsy based on the eastern part of our nation for 8 years between 2005 and 2013 and analyzed them by cause of death, manner of death, demographic data, toxicological results, and additional information. Through our study we presented the profile of forensic autopsy practice in rural areas and suggested that it can be affected by such regional characteristics.

REFERENCES

1. Saukko P, Knight B. Knight's forensic pathology. 3rd ed.London: Arnold;2004. p. 1–21.
2. Zardawi IM. Coronial autopsy in a rural setting. J Forensic Leg Med. 2013; 20:848–51.
crossref
3. Frost J, Slordal L, Vege A, et al. Forensic autopsies in a naturalistic setting in Norway: autopsy rates and toxicological findings. Forensic Sci Int. 2012; 223:353–8.
crossref
4. Saukko P, Knight B. Knight's forensic pathology. 3rd ed.London: Arnold;2004. p. 52–97.
5. Adams VI, Flomenbaum MA, Hirsch CS. Trauma and disease. Spitz WU, Spitz DJ, editors. Spitz and Fisher's medicolegal investigation of death: guidelines for the application of pathology to crime investigation. 4th ed.Springfield, IL: Charles C Thomas Publisher Ltd.;2004. p. 436–59.
6. International statistical classification of diseases and related health problems. 10th rev. [Internet]. Geneva: World Health Organization; [cited 2015 Mar 1]. Available from:. http://apps.who.int/classifications/icd10/browse/2010/en.
7. Korean Statistical Information Service [Internet]. Daejeon: Statistic Korea; [cited 2015 Mar 1]. Available from:. http://kosis.kr/statisticsList/statisticsList_01List.jsp?vw-cd=MT_ZTITLE&parmTabId=M_01_01.
8. Roadplus provided by the Korea Expressway Corporation. For road distance information [Internet]. Seongnam: Korea Expressway Corp.; [cited 2015 Mar 1]. Available from:. http://map.roadplus.co.kr/defaults.jsp.
9. Na JY, Park JP, Park HJ, et al. The statistical analysis on legal autopsy performed in Korea during 2012 year. Korean J Leg Med. 2013; 37:198–207.
crossref
10. Zheng WQ, Fan YH, Ng A. Public attitudes towards the autopsy in China. Pathology. 1998; 30:92–4.
crossref

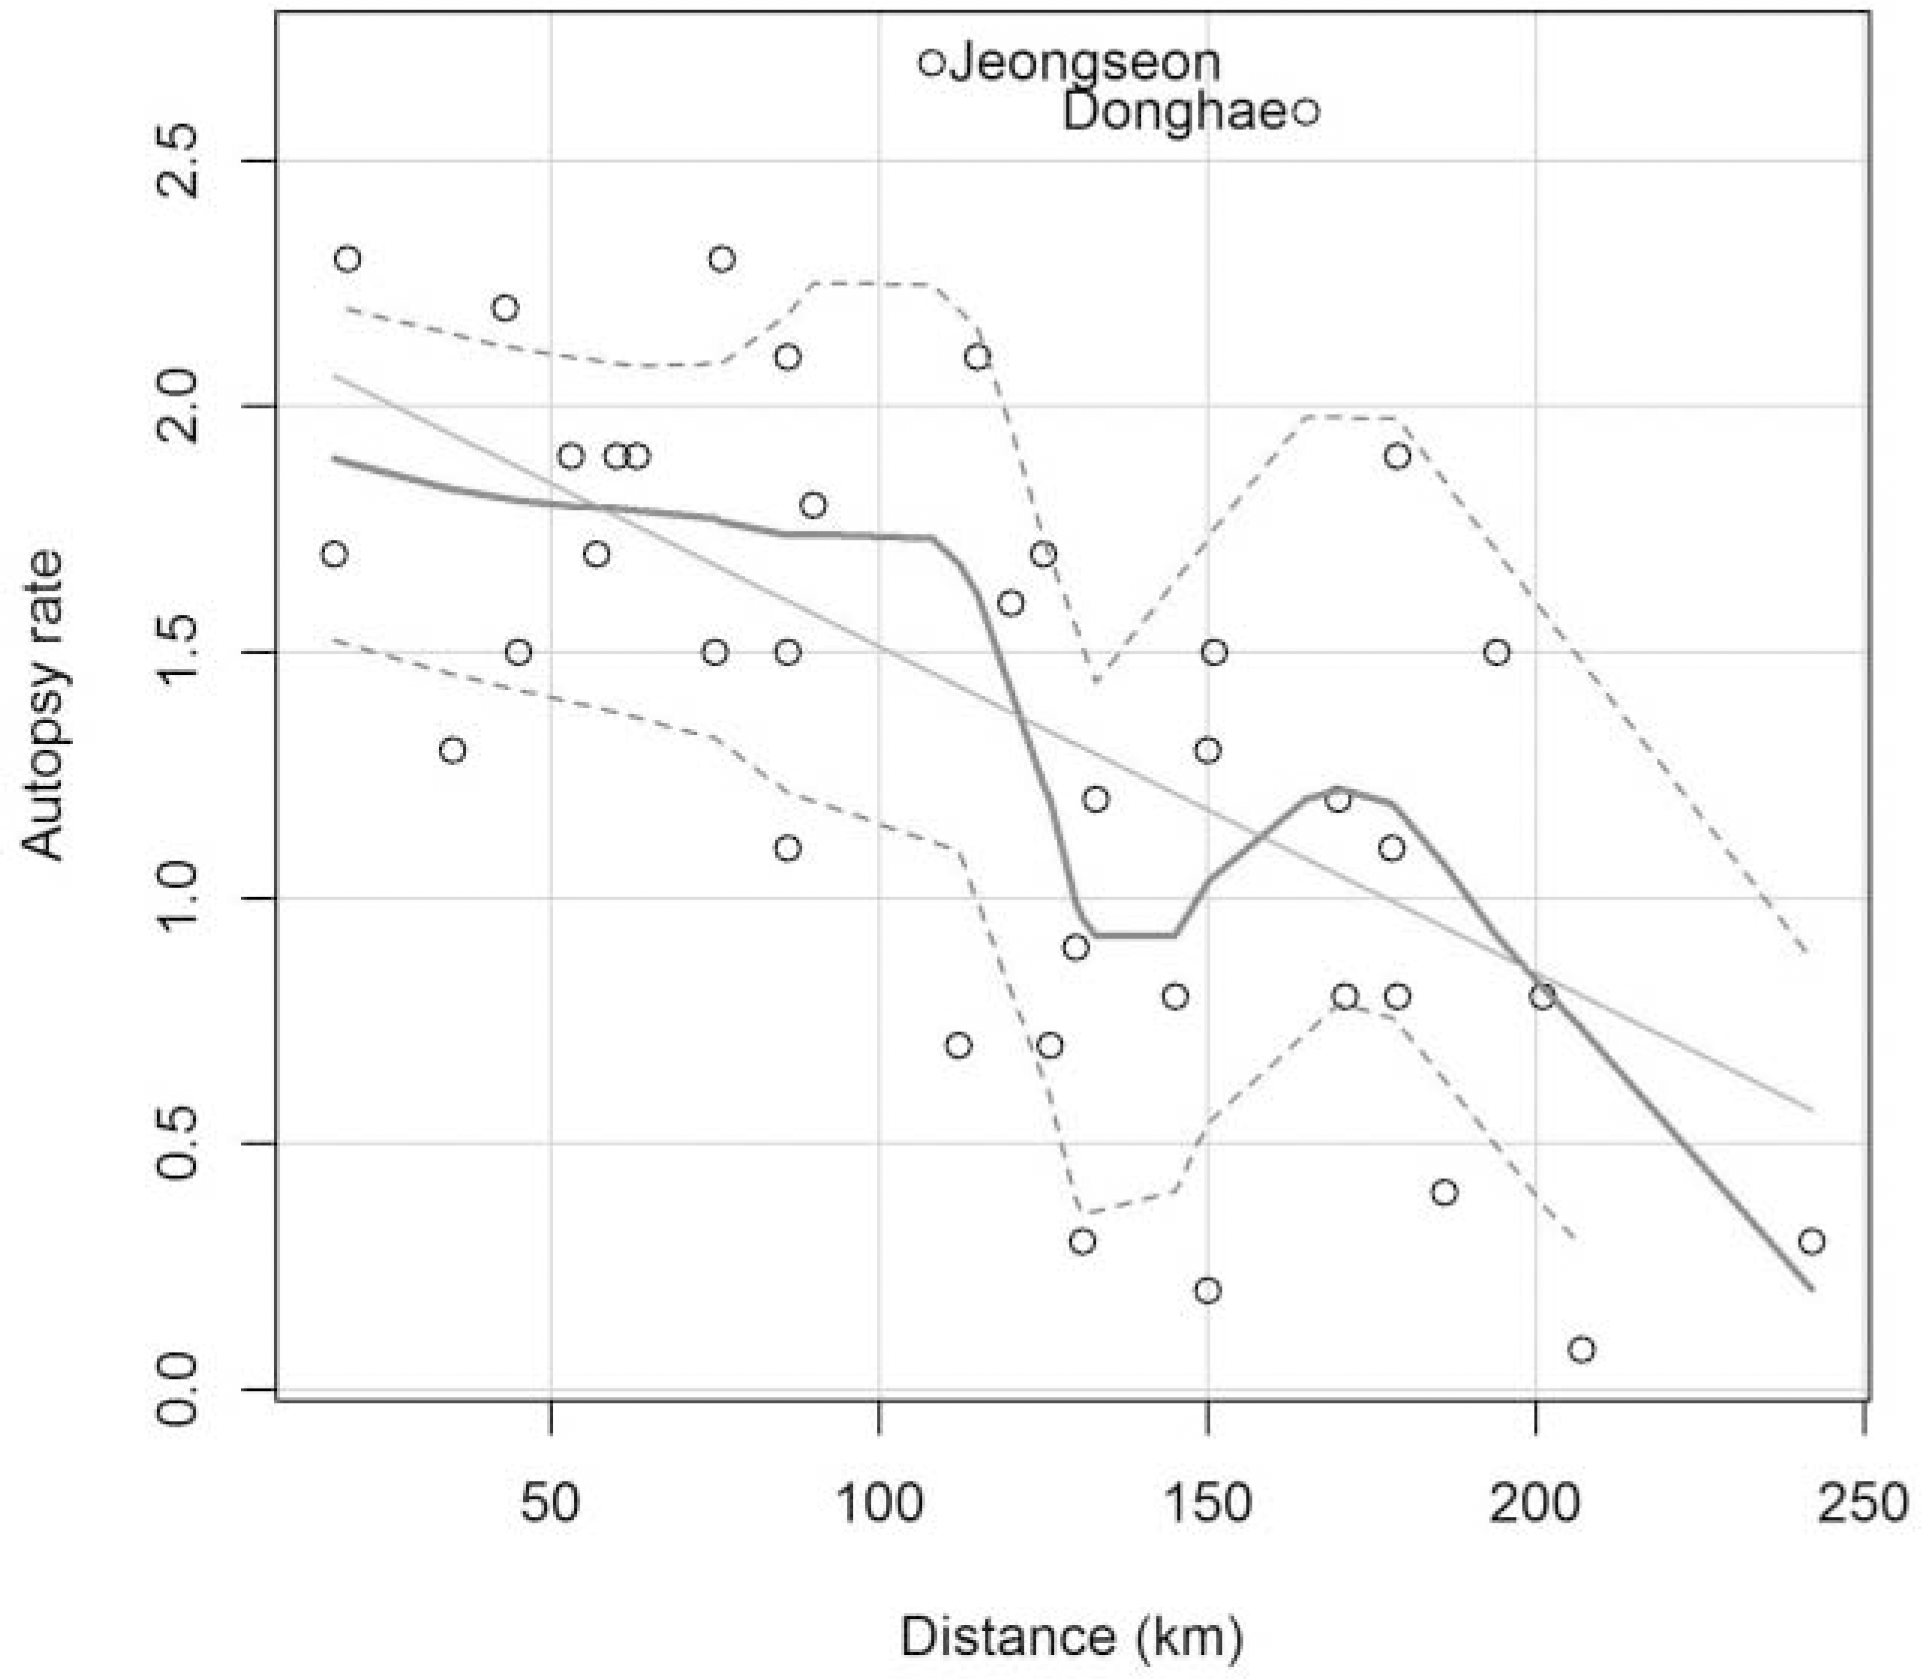
Fig. 1.
Negative correlation is revealed between autopsy rate and the road distance. Each dot represents the autopsy rate and the road distance from Table 5. Jeongseon and Donghae show higher autopsy rates than other areas.
kjlm-39-55f1.tif
Table 1.
Cause of death and manner of death according to demographic data
Manner of death Forensic autopsy cases Age (yr) Unknown
Total Male Female Unknown 0-9 10-19 20-29 30-39 40-49 50-59 60-69 70-79 >80
Natural                            
 Heart 357 310 47 0 2 4 12 48 111 91 50 31 7 1
 Vascular 127 78 49 0 0 1 4 23 38 41 16 3 1 0
 Digestive 51 41 10 0 0 1 1 7 19 21 2 0 0 0
 Endocrine/Nutrition/Metabolism 44 30 14 0 0 0 2 4 15 18 5 0 0 0
Infection 24 13 11 0 2 3 2 4 5 3 1 3 1 0
Perinatal 17 8 9 0 17 0 0 0 0 0 0 0 0 0
Respiratory 8 7 1 0 1 0 0 1 0 2 1 3 0 0
 Pregnancy, childbirth and the puerperium 7 0 7 0 0 0 3 3 1 0 0 0 0 0
 Ill-defined mortality 51 45 6 0 11 2 12 12 13 1 0 0 0 0
 Others 90 59 30 1 7 1 5 15 16 22 11 10 1 2
 Total 776 591 184 1 40 12 41 116 219 199 86 50 10 3
Accidents                            
 Falls/Blunt injury 196 165 31 0 4 7 12 28 54 47 25 11 7 1
 Traffic accidents 170 127 43 0 5 9 15 26 33 41 16 11 13 1
 Thermal injury 161 107 51 3 9 10 8 29 32 29 9 10 15 10
 Drowning 117 94 20 3 1 8 9 21 22 30 11 7 4 4
 Poisoning 76 50 26 0 0 1 6 12 22 18 9 8 0 0
 Asphyxia 31 21 10 0 12 1 4 4 3 2 3 1 1 0
 Others 76 41 33 2 2 4 2 13 13 13 11 9 4 5
 Total 827 605 214 8 33 40 56 133 179 180 84 57 44 21
Suicide                            
 Asphyxia 142 75 57 10 0 2 22 26 31 19 9 4 8 21
 Poisoning 128 82 45 1 0 7 20 13 32 27 16 7 2 4
 Drowning 85 50 32 3 0 2 10 13 18 14 12 10 2 4
 Thermal injury 26 20 5 1 0 0 1 2 9 7 2 1 0 4
 Falls 21 8 12 1 0 2 5 4 5 2 2 0 0 1
 Sharp injury 19 14 5 0 0 0 0 4 6 4 3 1 1 0
 Others 45 29 12 4 2 1 1 6 14 6 4 3 0 8
 Total 466 278 168 20 2 14 59 68 115 79 48 26 13 42
Homicide                            
 Violence 137 85 50 2 3 9 9 23 31 25 14 16 4 3
 Sharp injury 129 82 47 0 0 4 15 15 53 23 11 4 4 0
 Asphyxia 54 13 41 0 2 5 4 6 7 18 4 4 2 2
 Poisoning 7 4 3 0 0 2 0 0 3 1 0 0 1 0
 Others 50 20 28 2 7 3 3 5 10 9 6 2 1 4
 Total 377 204 169 4 12 23 31 49 104 76 35 26 12 9
Undetermined 173 81 44 48 1 0 6 9 22 17 8 7 4 99
Total 2,619 1,757 779 83 88 89 193 375 639 551 261 166 83 174
Table 2.
Positive for alcohol or drugs/chemicals by toxicological test
Manner of death Forensic autopsy cases Age (yr) Unknown
Total Male Female Unknown 0-17 18-39 40-59 60-80 >80
Natural                    
 Alcohol 194 166 28 0 1 36 127 28 2 0
 Drugs 175 117 58 0 12 39 72 49 2 1
 Both 27 24 3 0 4 17 6 0 0 0
 Total 396 307 89 0 17 92 205 77 4 1
Accidents                    
Falls/Blunt injury                    
 Alcohol 62 55 7 0 0 19 34 7 2 0
 Drugs 54 42 12 0 3 8 32 11 0 0
 Both 14 14 0 0 1 3 8 2 0 0
Traffic accidents                    
 Alcohol 77 67 10 0 1 30 40 5 1 0
 Drugs 22 14 8 0 1 2 10 8 1 0
 Both 15 12 3 0 3 9 2 1 0 0
Thermal injury                    
 Alcohol 26 18 7 1 0 10 9 4 2 1
 Drugs 63 31 32 0 15 10 14 10 12 2
 Both 64 53 10 1 0 18 34 4 1 7
Drowning                    
 Alcohol 61 50 10 1 1 21 23 12 3 1
 Drugs 7 6 1 0 1 3 3 0 0 0
 Both 5 3 2 0 0 1 3 1 0 0
Poisoning                    
Alcohol 11 6 5 0 0 4 6 1 0 0
 Drugs 41 30 11 0 1 10 19 11 0 0
 Both 23 13 10 0 0 4 14 5 0 0
Others                    
 Alcohol 11 8 2 1 0 3 4 3 0 1
 Drugs 28 8 20 0 5 6 9 8 0 0
 Both 3 1 2 0 0 0 2 1 0 0
 Total 587 431 152 4 32 161 266 94 22 12
Suicide                    
 Poisoning                    
 Alcohol 0 0 0 0 0 0 0 0 0 0
 Drugs 66 31 34 1 2 22 26 11 2 3
 Both 61 45 16 0 1 14 33 12 0 1
 Others                    
 Alcohol 121 69 48 4 1 51 42 19 2 6
 Drugs 44 24 20 0 2 8 20 8 3 3
 Both 38 20 17 1 0 12 18 5 0 3
 Total 330 189 135 6 6 107 139 55 7 16
Homicide                    
 Violence                    
 Alcohol 48 29 19 0 1 12 26 8 1 0
 Drugs 32 23 9 0 0 6 14 11 1 0
 Both 2 1 1 0 0 2 0 0 0 0
Sharp injury                    
 Alcohol 52 41 11 0 1 16 31 4 0 0
 Drugs 20 11 9 0 0 2 14 3 1 0
 Both 11 7 4 0 0 4 7 0 0 0
Asphyxia                    
 Alcohol 14 3 11 0 0 3 9 1 0 1
 Drugs 7 4 3 0 3 0 3 1 0 0
 Both 3 0 3 0 0 0 3 0 0 0
Poisoning                    
Alcohol 0 0 0 0 0 0 0 0 0 0
 Drugs 5 2 3 0 2 0 2 0 1 0
 Both 0 0 0 0 0 0 0 0 0 0
 Others                    
 Alcohol 10 6 4 0 1 1 5 3 0 0
 Drugs 6 2 4 0 2 0 3 1 0 0
 Both 3 1 2 0 0 1 2 0 0 0
 Total 213 130 83 0 10 47 119 32 4 1
Undetermined                    
 Alcohol 60 32 17 11 0 5 17 9 0 29
 Drugs 7 1 5 1 0 1 1 0 2 3
 Both 14 6 6 2 0 1 6 3 0 4
 Total 81 39 28 14 0 7 24 12 2 36
Total 1,607 1,096 487 24 65 414 753 270 39 66
Table 3.
Positive results of alcohol concentration
Manner of death Postmortem alcohol concentration
<0.05% 0.05%-0.19% 0.2%-0.29% 0.3%-0.39% >0.4% Total
Natural 79 (18)a) 102 (17) 29 (3) 8 (1) 3 (1) 221
Accidents            
 Falls/Blunt injury 13 40 (3) 19 2 2 76
 Traffic accidents 7 45 (2) 32 5 3 92
 Thermal injury 4 41 30 13 2 90
 Drowning 7 (4) 37 (7) 22 (3) 0 0 66
 Poisoning 9 (2) 10 (2) 1 6 8 (1) 34
 Others 2 (1) 8 (3) 1 3 0 14
 Total 42 (7) 181 (17) 105 (3) 29 15 (1) 372
Suicide 58 (16) 117 (18) 36 (1) 8 (1) 1 220
Homicide            
 Violence 8 (2) 21 (2) 16 4 1 50
 Sharp injury 5 (1) 37 (1) 18 2 1 63
 Asphyxia 2 (2) 11 (1) 3 0 1 17
 Poisoning 0 0 0 0 0 0
 Others 3 (2) 6 (2) 2 2 (1) 0 13
 Total 18 (7) 75 (6) 39 8 (1) 3 143
Undetermined 20 (11) 46 (17) 8 (3) 0 0 74
Total 217 521 217 53 22 1,030

a) The numbers in parenthesis are cases where n-propanol was also identified.

Table 4.
Substances in poisoning/intoxication
Manner of death Poisoning/Intoxication
Agrochemicals Chemicals s CO Medicine Drug/Inhalants Alcohol Others Combineda) Total
Homicide 1 5 0 1 0 0 0 0 7
Suicide 60 15 26 21 0 0 0 5 127
Accidents 1 8 40 1 6 13 2 5 76
Undetermined 0 0 0 1 0 0 0 0 1
Total 62 28 66 24 6 13 2 10 211

a) Combined: medicine+alcohol or medicine+CO.

Table 5.
Autopsy rates according to each area
Road distance (km) Autopsy cases Deaths Autopsy rate (%)
Area Distance
Wonju 17 200 11,648 1.7
Yeoju 19 122 5,357 2.3
Hoengseong 35 38 2,983 1.3
Icheon 43 160 7,136 2.2
Chungju 45 145 9,926 1.5
Jecheon 53 135 6,930 1.9
Eumseong 57 89 5,232 1.7
Yangpyeong 60 104 5,334 1.9
Hongcheon 63 79 4,266 1.9
Jincheon 75 52 3,371 1.5
Pyeongchang 76 61 2,657 2.3
Chuncheon 86 166 11,042 1.5
Yeongwol 86 61 2,925 2.1
Danyang 86 25 2,377 1.1
Gapyeong 90 67 3,815 1.8
Jeongseon 108 71 2,591 2.7
Yeongju 112 14 1,872 0.7
Inje 115 37 1,747 2.1
Hwacheon 120 21 1,315 1.6
Yanggu 125 21 1,220 1.7
Bonghwa 126 6 817 0.7
Yecheon 130 11 1,285 0.9
Mungyeong 131 6 1,567 0.3
Gangneung 133 116 10,074 1.2
Andong 145 22 2,741 0.8
Sangju 150 4 2,292 0.2
Cheorwon 150 35 2,681 1.3
Taeback 151 41 2,675 1.5
Donghae 165 112 4,368 2.6
Goseong 170 24 2,019 1.2
Uiseong 171 14 1,761 0.8
Samcheok 178 46 4,215 1.1
Sokcho 179 105 5,557 1.9
Gunwi 179 6 770 0.8
Cheongsong 186 3 723 0.4
Gumi 194 42 2,720 1.5
Gimcheon 201 18 2,229 0.8
Chilgok 207 1 1,253 0.08
Uljin 242 4 1,158 0.3
Total - 2,284 144,649 1.6
TOOLS
Similar articles