Abstract
To determine blood alcohol concentration (BAC) by extrapolation, an understanding of basal pharmacokinetics is indispensable. Breath alcohol concentration (BrAC) has been used for the determination of body alcohol concentration replaced by BAC in Korea. Therefore, the determination of BAC/BrAC ratio is a key problem in alcohol pharmacokinetics. Among several factors, the ingested dose of alcohol and the allelic variation of mitochondrial aldehyde dehydrogenase 2 (ALDH2) are the most significant factors influencing the pharmacokinetic parameters, particularly in the absorption and elimination phases. This study shows a detailed pharmacokinetic analysis of BAC and BrAC associated with genetic polymorphism including ALDH2 in 42 healthy Korean men. The change in the alcohol dose ingested influenced the maximum concentration (Cmax), the time to reach Cmax (Tmax), the absorption rate constant (K01), the area under the concentration-time curve (AUClast), and the hourly elimination rate. The conversion of wild-type 487Glu (ALDH2∗1) to 487Lys (ALDH2∗2) in human ALDH2 resulted in changes in Cmax (ALDH2∗1/∗1, 0.03±0.01 g/dL [±standard deviation] vs. ALDH2∗1/∗2, 0.05±0.004 g/dL [P<0.01]), AUClast (ALDH2∗1/∗1, 4.48±2.19 g∙ min/dL vs. ALDH2∗1/∗2, 7.52±1.26 g∙min/dL [P<0.05]), and the BAC elimination rate (ALDH2∗1/∗1, 0.05±0.02 g/L/hr vs. ALDH2∗1/∗2, 0.09±0.01 g/L/hr [P<0.05]). Moreover, the comparison of BAC and BrAC by Bland-Altman plot showed good agreement, suggesting that the measurement of BrAC can be a good alternative for the determination of BAC, particularly in the post-absorption phase. These results provide fundamental information about the pharmacokinetics of alcohol and the determination of BAC in forensics.
Go to : 
REFERENCES
1. Nutt DJ, King LA, Phillips LD, et al. Drug harms in the UK: a multicriteria decision analysis. Lancet. 2010; 376:1558–65.

2. Kelly AT, Mozayani A. An overview of alcohol testing and interpretation in the 21st century. J Pharm Pract. 2012; 25:30–6.

3. Jones AW. Evidence-based survey of the elimination rates of ethanol from blood with applications in forensic casework. Forensic Sci Int. 2010; 200:1–20.

4. Song BJ, Abdelmegeed MA, Yoo SH, et al. Post-translational modifications of mitochondrial aldehyde dehydrogenase and biomedical implications. J Proteomics. 2011; 74:2691–702.

5. Higuchi S, Matsushita S, Muramatsu T, et al. Alcohol and aldehyde dehydrogenase genotypes and drinking behavior in Japanese. Alcohol Clin Exp Res. 1996; 20:493–7.

6. Chen YC, Peng GS, Wang MF, et al. Polymorphism of ethanol-metabolism genes and alcoholism: correlation of allelic variations with the pharmacokinetic and pharmacodynamic consequences. Chem Biol Interact. 2009; 178:2–7.

7. Liu J, Zhou Z, Hodgkinson CA, et al. Haplotype-based study of the association of alcohol-metabolizing genes with alcohol dependence in four independent populations. Alcohol Clin Exp Res. 2011; 35:304–16.

8. Farres J, Wang X, Takahashi K, et al. Effects of changing glutamate 487 to lysine in rat and human liver mitochondrial aldehyde dehydrogenase. A model to study human (Oriental type) class 2 aldehyde dehydrogenase. J Biol Chem. 1994; 269:13854–60.
9. Zhou J, Weiner H. Basis for half-of-the-site reactivity and the dominance of the K487 oriental subunit over the E487 subunit in heterotetrameric human liver mitochondrial aldehyde dehydrogenase. Biochemistry. 2000; 39:12019–24.

10. Higuchi S, Matsushita S, Imazeki H, et al. Aldehyde dehydrogenase genotypes in Japanese alcoholics. Lancet. 1994; 343:741–2.

11. Chen CC, Lu RB, Chen YC, et al. Interaction between the functional polymorphisms of the alcohol-metabolism genes in protection against alcoholism. Am J Hum Genet. 1999; 65:795–807.

12. Wright NR, Cameron D. The influence of habitual alcohol intake on breath-alcohol concentrations following prolonged drinking. Alcohol Alcohol. 1998; 33:495–501.

13. Jones AW, Andersson L. Comparison of ethanol concentrations in venous blood and end-expired breath during a controlled drinking study. Forensic Sci Int. 2003; 132:18–25.

14. Edenberg HJ. The genetics of alcohol metabolism: role of alcohol dehydrogenase and aldehyde dehydrogenase variants. Alcohol Res Health. 2007; 30:5–13.
15. Zakhari S. Overview: how is alcohol metabolized by the body? Alcohol Res Health. 2006; 29:245–54.
16. Lieber CS. Cytochrome P-4502E1: its physiological and pathological role. Physiol Rev. 1997; 77:517–44.

17. Lieber CS. The discovery of the microsomal ethanol oxidizing system and its physiologic and pathologic role. Drug Metab Rev. 2004; 36:511–29.

18. Niederhut MS, Gibbons BJ, Perez-Miller S, et al. Three-dimensional structures of the three human class I alcohol dehydrogenases. Protein Sci. 2001; 10:697–706.

19. Stone CL, Bosron WF, Dunn MF. Amino acid substitutions at position 47 of human beta 1 beta 1 and beta 2 beta 2 alcohol dehydrogenases affect hydride transfer and coenzyme dissociation rate constants. J Biol Chem. 1993; 268:892–9.

20. Charlier HA Jr, Plapp BV. Kinetic cooperativity of human liver alcohol dehydrogenase gamma(2). J Biol Chem. 2000; 275:11569–75.
21. Lee SL, Hoog JO, Yin SJ. Functionality of allelic variations in human alcohol dehydrogenase gene family: assessment of a functional window for protection against alcoholism. Pharmacogenetics. 2004; 14:725–32.
22. Larson HN, Zhou J, Chen Z, et al. Structural and functional consequences of coenzyme binding to the inactive asian variant of mitochondrial aldehyde dehydrogenase: roles of residues 475 and 487. J Biol Chem. 2007; 282:12940–50.
23. Chen YC, Lu RB, Peng GS, et al. Alcohol metabolism and cardiovascular response in an alcoholic patient homozygous for the ALDH2∗2 variant gene allele. Alcohol Clin Exp Res. 1999; 23:1853–60.

Go to : 
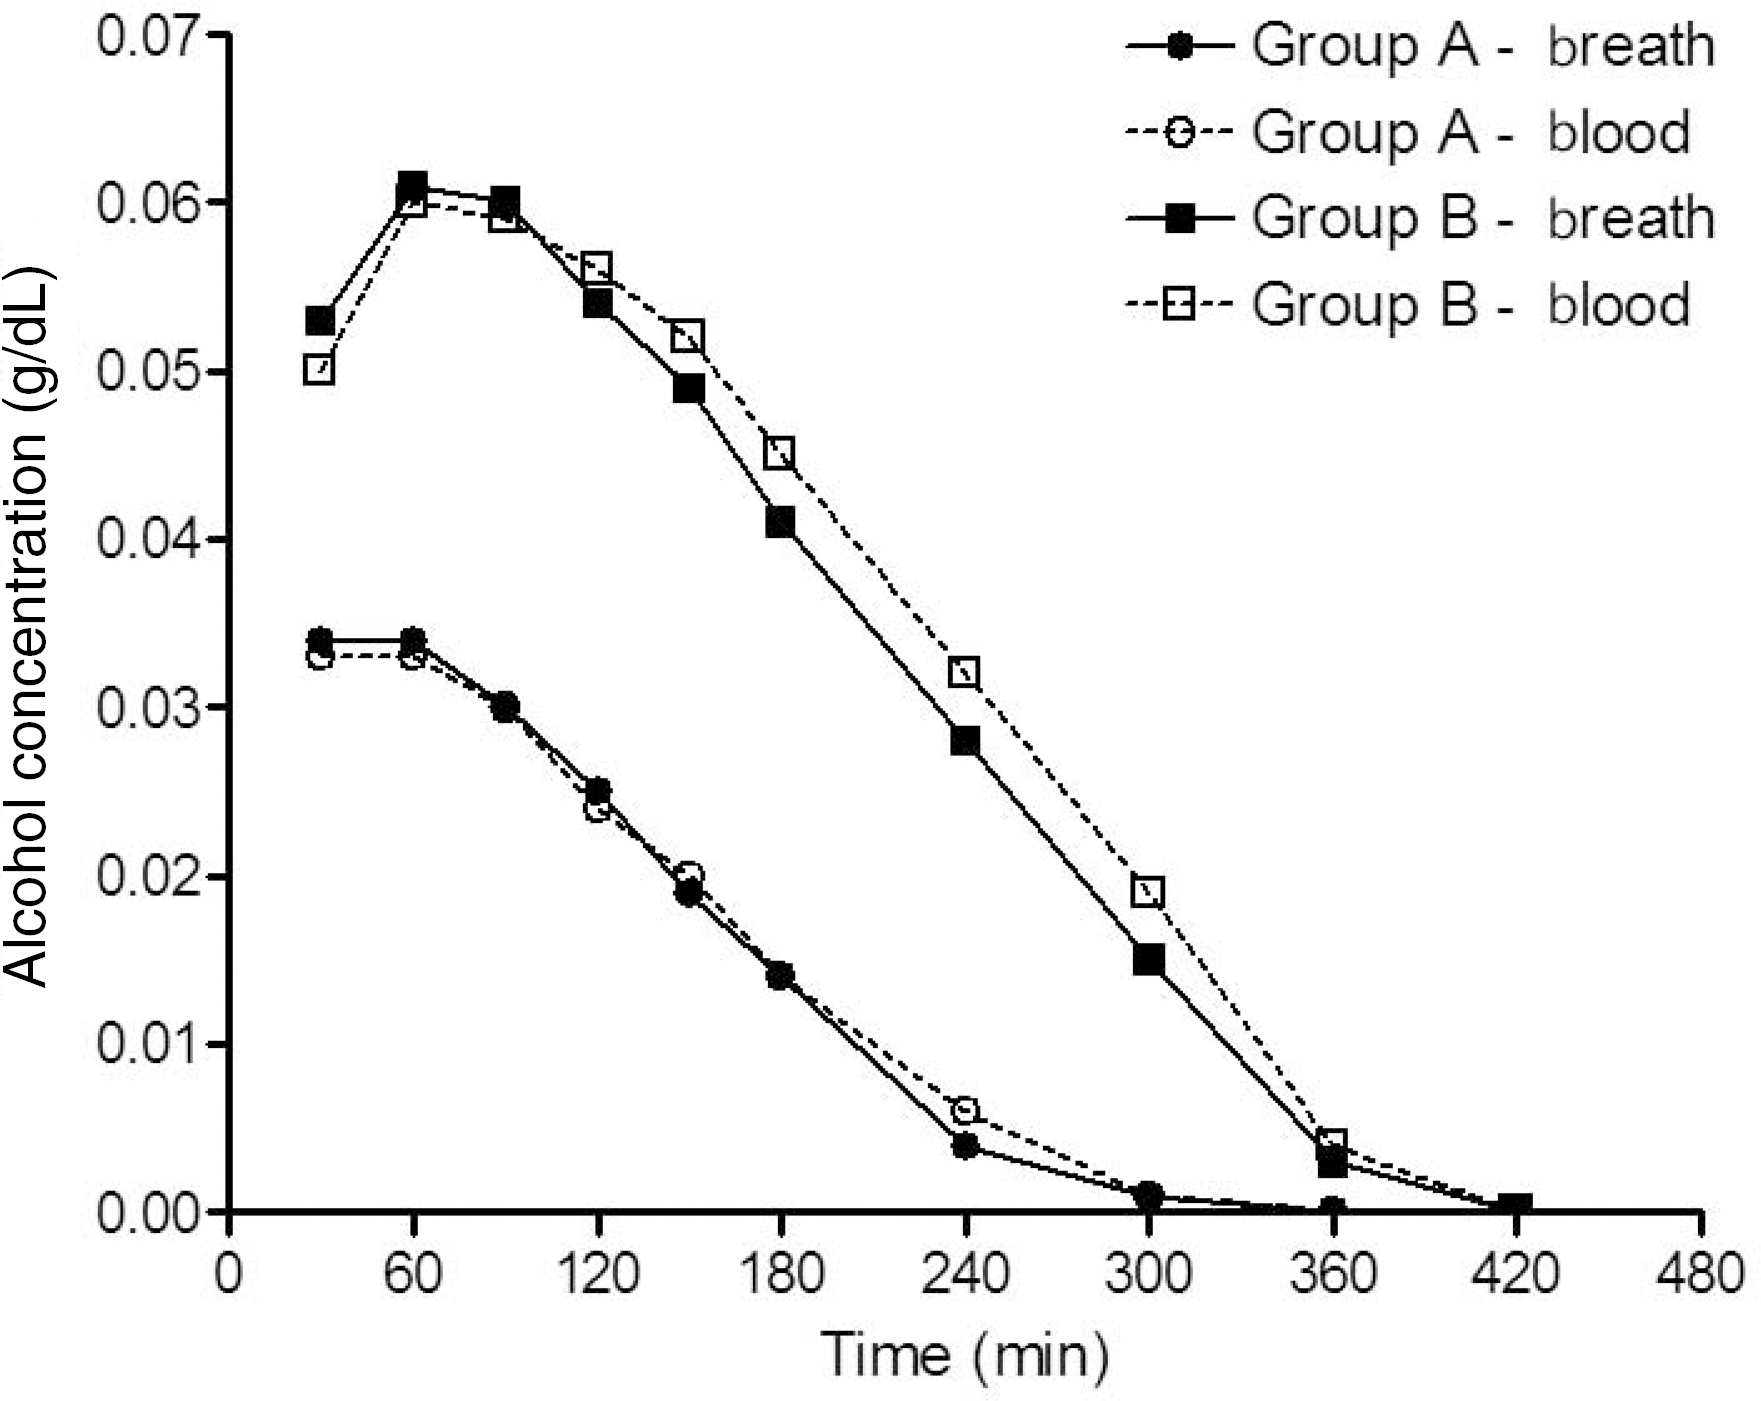
 | Fig. 1.Mean breath alcohol concentration (BrAC) and blood alcohol concentration (BAC) versus time profiles in group A (0.5 g/kg) and group B (0.8 g/kg) participants. After drinking alcohol within a period of 20 minutes, BrAC and BAC were determined every 30 or 60 minutes (30, 60, 90, 120, 150, 180, 240, 300, 360, and 420 minutes) as described in the Materials and Methods section. |
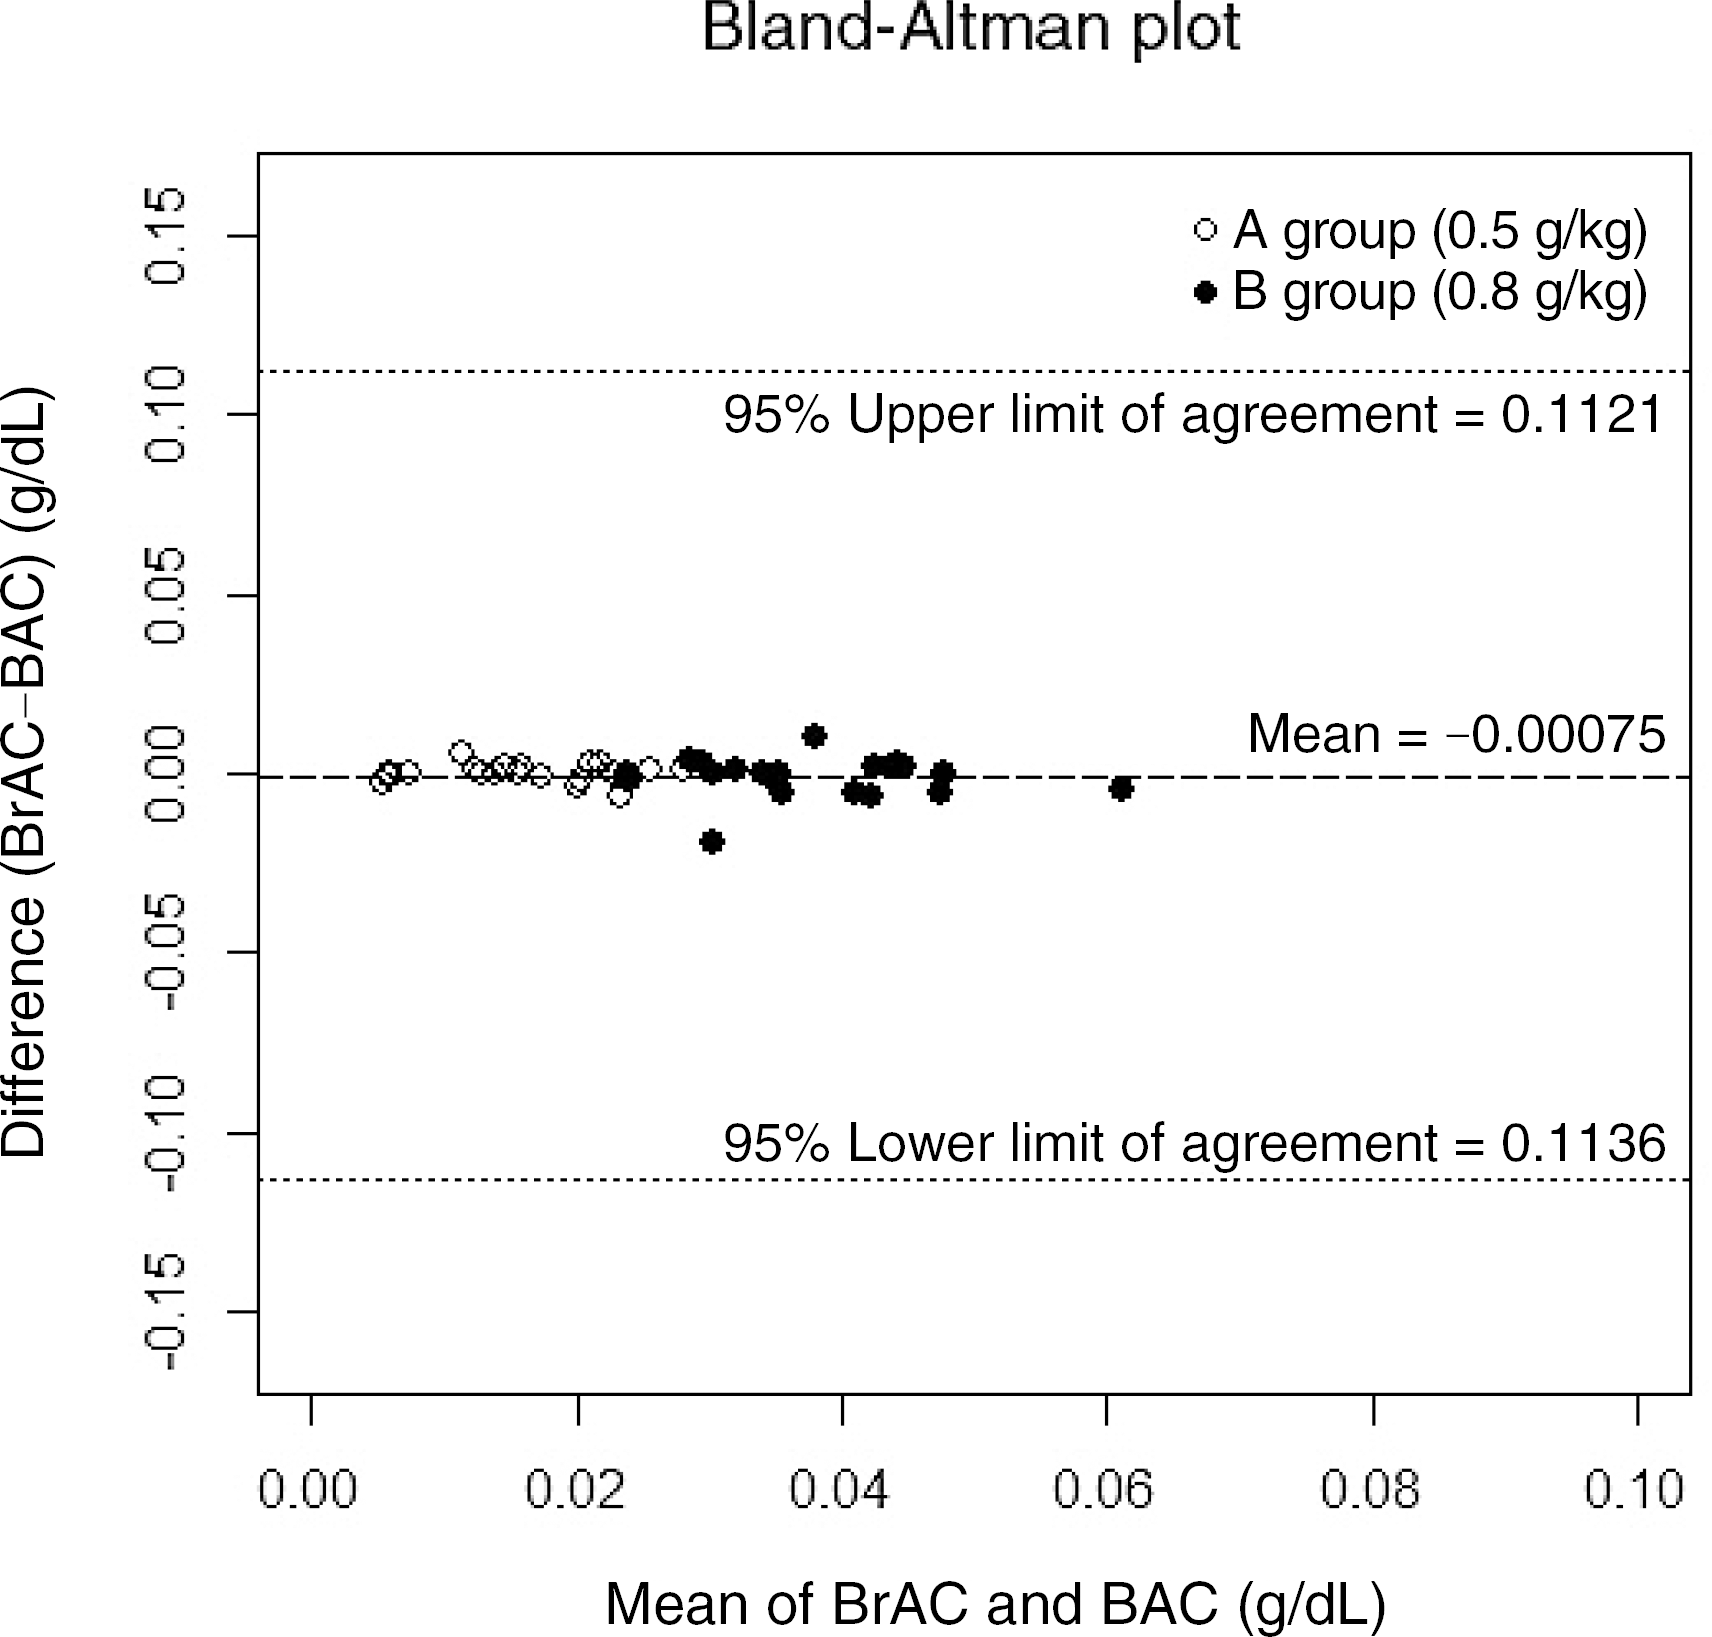
 | Fig. 2.Bland-Altman plot of each participant's difference (blood alcohol concentration [BAC]-breath alcohol concentration [BrAC]) against the mean of the two measurements ([BAC+BrAC]/2). Empty circles and filled circles represent data from group A (0.5 g/kg) and group B (0.8 g/kg), respectively. The horizontal lines show a mean bias of -0.00075, and 95% lower and upper limits of agreement of -0.1136 and 0.1121. |
Table 1.
Pharmacokinetic parameters in group A (0.5 g/kg, n=20) and group B (0.8 g/kg, n=22) participants
Table 2.
Individual elimination rate (g/L/hr) of breath alcohol concentration and blood alcohol concentration calculated by linear regression
Table 3.
Allelic and genotypic frequencies of ADH1B, ADH1C, and ALDH2 polymorphisms
Table 4.
Comparison of pharmacokinetic parameters according to the ADH1B, ADH1C, and ALDH2 genotypes in group A participants
| Parameter | ADH1B (His47Arg, rs1229984, A to G) | ADH1C (Ile349Val, rs698, A to G) | ALDH2 (Glu487Lys, rs671, G to A) | ||||||
|---|---|---|---|---|---|---|---|---|---|
| AA (n=14) | AG (n=6) | P-valuea) | AA (n=17) | AG (n=3) | P-valuea) | GG (n=16) | AG (n=4) | P-valuea) | |
| Breath | |||||||||
| Tmax (min) | 51.42±21.79 | 50.00±24.49 | 0.8575 | 49.41±21.06 | 60.00±30.00 | 0.4893 | 52.50±23.24 | 45.00±17.32 | 0.6070 |
| Cmax (g/dL) | 0.04±0.01 | 0.04±0.01 | 0.7724 | 0.04±0.01 | 0.04±0.01 | 0.6714 | 0.03±0.01 | 0.05±0.003 | 0.0060b) |
| max AUClast (g∙min/dL) | 4.91±2.36 | 5.26±2.17 | 0.5634 | 4.93±2.37 | 5.52±1.61 | 0.5964 | 4.35±1.92 | 7.67±1.41 | 0.0061b) |
| K01 (1/min) | 0.26±0.07 | 0.24±0.02 | 0.6801 | 0.26±0.07 | 0.24±0.02 | 0.9578 | 0.26±0.07 | 0.23±0.01 | 0.0182c) |
| 01 KM (g/dL) | 3.74±0.31 | 3.79±0.05 | 0.6801 | 3.75±0.28 | 3.78±0.02 | 0.711 | 3.75±0.29 | 3.80±0.04 | 0.5708 |
| VM (1/min) | 1.15±0.13 | 1.17±0.06 | 0.4579 | 1.15±0.12 | 1.16±0.09 | 0.9578 | 1.17±0.12 | 1.10±0.03 | 0.2568 |
| Elimination rate (g/L/hr) | 0.06±0.03 | 0.07±0.02 | 0.4831 | 0.06±0.03 | 0.07±0.02 | 0.4585 | 0.06±0.02 | 0.09±0.01 | 0.0061b) |
| Blood | |||||||||
| Tmax (min) | 38.57±14.06 | 35.00±12.25 | 0.5829 | 37.06±13.12 | 40.00±17.32 | 0.7245 | 39.38±14.36 | 30.00±0 | 0.2083 |
| Cmax (g/dL) | 0.03±0.01 | 0.04±0.01 | 0.5087 | 0.03±0.01 | 0.03±0.01 | 0.791 | 0.03±0.01 | 0.05±0.004 | 0.0093b) |
| AUClast (g∙min/dL) | 4.98±2.27 | 5.35±2.78 | 0.7415 | 5.16±2.48 | 4.69±1.95 | 0.7913 | 4.48±2.19 | 7.52±1.26 | 0.0182c) |
| K01 (1/min) | 0.24±0.13 | 0.23±0.03 | 0.4095 | 0.24±0.12 | 0.25±0.02 | 0.9578 | 0.26±0.11 | 0.18±0.12 | 0.1859 |
| KM (g/dL) | 3.67±0.60 | 3.80±0.07 | 0.8046 | 3.69±0.54 | 3.82±0.10 | 0.711 | 3.68±0.56 | 3.84±0.05 | 0.3447 |
| VM (1/min) | 1.31±0.36 | 1.23±0.17 | 0.8046 | 1.31±0.33 | 1.15±0.11 | 0.3683 | 1.24±0.18 | 1.45±0.63 | 0.7768 |
| Elimination rate (g/L/hr) | 0.06±0.03 | 0.06±0.02 | 0.7415 | 0.06±0.03 | 0.06±0.02 | 0.6338 | 0.05±0.02 | 0.09±0.01 | 0.0182c) |


 PDF
PDF ePub
ePub Citation
 Print
Print


 XML Download