

 PDF
PDF ePub
ePub Citation
 Print
Print


INTRODUCTION
The addition of digital breast tomosynthesis (DBT) to conventional digital mammography (DM), which provides reconstructed thin sliced images through low-dose multiple projection image datasets, has been found to increase cancer detection while also reducing false-positive results compared to DM alone (12345). However, controversy remains regarding the detection and interpretation of calcifications with DBT, as the detection of calcifications with DBT has been reported to be more challenging owing to the larger extent of the search field, separation of calcification clusters on DM images into several DBT slices, and the potential for blurring (6). Indeed, according to one multicenter study, superior performance of DM plus DBT was found only for non-calcified lesions and not for calcifications (3). In addition, while one multireader study reported that DM was slightly superior to DBT in the detection of calcifications (7), Kopans et al. (8) suggested that DBT could better demonstrate calcifications with equal or greater clarity than DM when full resolution detectors were used. Under these circumstances, computer-aided detection (CAD) systems may provide potential improvement in calcification detection with DBT, and research performed so far has shown that they are both feasible and hold promise for prescreening of calcifications with DBT (6910).
2D CAD systems for conventional screening mammography have been widely implemented throughout all mammography clinics in the United States since the mid-2000s (11). On the other hand, clinical studies of 3D CAD for DBT are still in their early stages, as the available patient DBT images for CAD systems are limited. Also, to the best of our knowledge, there have been no reports regarding the performance of 3D CAD for the detection of calcifications with DBT using paired DBT-DM images obtained in the same woman.
Therefore, the purpose of our study was to evaluate the performance of the 3D CAD system for DBT in comparison with the 2D CAD system for conventional DM in the detection of calcifications.
MATERIALS AND METHODS
Between January 2012 and July 2013, combined DBT and DM examinations were performed in women who were referred to our institution for a diagnostic workup due to breast symptoms or signs, or had suspicious findings on screening mammography. Our institution has conducted several clinical studies on combined DBT and DM examinations and informed consent was obtained from each patient prior to obtaining the image. The Institutional Review Board approved our study and the requirement for obtaining informed consent was waived for performing this retrospective analysis of the raw image data obtained during prior studies. The software used in this study (3D Calc CAD) was provided by Hologic (Selenia Dimensions System; Bedford, MA, USA); however, none of the authors received funding from Hologic and the authors had complete control of the data and information submitted for publication at all times.
Image Acquisition Protocol and Data Set
Between January 2012 and July 2013, combined DBT and DM examinations were performed in 2369 consecutive women at our institution. Both DBT and DM images in the craniocaudal (CC) and mediolateral oblique (MLO) positions were obtained for both breasts using a mammography machine (Selenia Dimensions System; Hologic, Bedford, MA, USA). The X-ray tube rotated over a 15° arc with the breast compressed, and after scanning, the projection images and the data from the frames were combined to create a full 3D-image set of the breast with 1 mm reconstructed slices. The number of slices per view varied (mean, 56.5; range, 35–76) depending on the thickness of the compressed breast.
There were 268 lesions which presented as masses, 115 lesions presented as masses with calcifications, 142 lesions presented with calcifications only, 92 lesions showed asymmetry, and 1752 lesions showed negative findings. Of the 142 lesions presenting with calcifications only, 73 lesions were excluded as their raw image data for 3D Calc CAD with DBT and 2D CAD with DM were not available. Finally, 69 women (mean age, 51.4 years; age range, 30–71 years) were included in the calcification data set. Of these 69 lesions, 31 (44.9%) were confirmed as malignant calcifications and 38 (55.1%) were confirmed as benign calcifications. All 31 cases of malignant calcifications were confirmed by surgical excision; 14 were invasive ductal carcinomas and 17 were ductal carcinomas in situ. Among the 38 cases of benign calcifications, 11 cases were confirmed by stereotactic biopsy, 5 cases were confirmed by excisional biopsy, and 5 cases were confirmed by ultrasonography-guided core needle biopsy. The remaining 17 cases were confirmed as benign calcifications by their stability during at least the 2-year imaging follow-up.
To evaluate the false-positive mark rate, a separate normal image data set without suspicious calcifications or masses [Breast Imaging Reporting and Data System (BI-RADS) category 1] comprising two-view DBT and DM pairs from 40 breasts of 20 women (mean age, 51.9 years; age range, 30–77 years) were identified. Two board-certified radiologists (A.J.C., N.C. with 3 and 14 years of experience in breast imaging, respectively) confirmed the negative findings.
CAD Algorithm
Both the 3D Calc CAD (ImageChecker version 1.0, Hologic) and 2D CAD systems (R2 ImageChecker CAD 9.3, Hologic) were retrospectively applied to the paired DBT-DM images obtained in the same woman. The algorithm used for the 3D Calc CAD system marked clusters with two or more elements, in which each element (calcification candidate) was at least 100 microns in size. The elements were separated by no more than 4 mm if they were present within the same slice. If the elements existed in neighboring slices, a distance of 3 mm or less was required to be marked by CAD. Obvious benign calcium elements, such as popcorn-like calcifications and very high contrast isolated benign elements such as surgical clips were not intended to be marked with the CAD algorithm. Triangles were used to denote CAD marks for calcifications in both the 3D and 2D CAD systems. In 2D CAD, the summary CAD result image showed overlying triangles in the area of calcification and the number of calcifications was provided per view. In 3D CAD, a dedicated workstation was used. Calcifications were displayed as dots and dashed boundary lines in the area of the breast through the neighboring level of calcification. The number of calcification clusters per view marked by the CAD system was also provided in the 3D CAD system. The sensitivity and specificity could be adjusted at different levels for each CAD system. There were three operating levels (level 2 to 0) for the 3D CAD system and two operating levels (level 2 to 1) for the 2D CAD system. The smaller number of the operating level was set to lower detection sensitivity with fewer false-positive marks, whereas the bigger number of the operating level was set to higher sensitivity with more false-positive marks. The operating level 2 for 2D CAD has shown a sensitivity of 97% with 0.64 false-positive marks per image for the detection of calcifications, whereas the operating level 0 has shown 95% sensitivity and 0.36 false-positive marks per image (12). None of the studies have reported on the sensitivity or false-positive mark rate of the 3D CAD system.
CAD Mark Evaluation and Statistical Analysis
CAD marks were evaluated by the same radiologists (A.J.C., N.C.) who reviewed and classified the calcification and normal data sets. They reviewed all available mammograms including magnification views, ultrasonography, and MR images and determined whether the CAD marks correlated with the malignant or benign calcification clusters on histopathology reports. A true-positive mark was defined when a triangle was correctly placed on a malignant calcification cluster found on at least one slice of DBT or one view of conventional DM. Sensitivity was defined as the number of true-positive CAD marks divided by the total number of malignant clusters (n = 31). CAD sensitivities were also calculated for each view (i.e., CC and MLO views), combined CC and MLO view (case-based sensitivity), and for each operating level.
Using the normal data set, the false-positive mark rate was evaluated. It was calculated as the total number of false-positive marks divided by the total number of views. A false-positive mark was defined when a triangle was placed on a benign calcification cluster or a negative finding on at least one slice of DBT or one view of conventional DM.
Between the 3D and 2D CAD systems, sensitivities for detection of malignant calcifications and the false-positive mark rate were compared. Each breast was classified as fatty (composition of BI-RADS a or b) or dense (composition of BI-RADS c or d) (13). Thereafter, we evaluated whether CAD sensitivities or the false-positive mark rate was associated with breast composition and we evaluated the potential reasons for the false-negative or false-positive cases. For statistical analysis, we used the McNemar test, Friedman test and the independent sample t-test using SPSS software (version 21 for Windows; SPSS Inc., Chicago, IL, USA). A p-value of less than 0.05 was considered to indicate statistical significance.
RESULTS
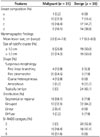
BI-RADS final assessment categories of the lesions were category 2 in 20 cases, category 4 in 33 cases, and category 5 in 16 cases. Segmental, fine pleomorphic microcalcifications were the most common finding according to the BI-RADS Atlas (13) (Table 1).
Sensitivities from the Calcification Data Set
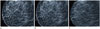
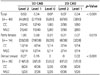
Regarding the 31 malignant calcification clusters, case-based sensitivities (combined CC and MLO views) of the 3D CAD system [100% (31/31) at all levels] were same as those of the 2D CAD system [100% (31/31) at levels 2 and 1] (p = 1.0, respectively) (Table 2, Fig. 1). In terms of view-based sensitivity, 2D CAD at operating level 1 showed lower sensitivity in the MLO view (90.3%, 28/31) than the other system. Case-based sensitivity was not impaired because the complementary CC view depicted calcifications correctly.
False-Positive Marks from the Normal Data Set
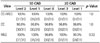
With respect to the 40 normal breasts, the mean ± standard deviation of the false-positive mark rate per view of the 3D CAD system was higher than that of the 2D CAD system: 3D CAD [0.52 (42/80) ± 0.91 at level 2, 0.34 (27/80) ± 0.75 at level 1, and 0.07 (6/80) ± 0.35 at level 0] vs. 2D CAD [0.07 (6/80) ± 0.26 at level 2 and 0.04 (3/80) ± 0.19 at level 1] (p < 0.001 from multiplecomparison) (Table 3). In the 3D CAD system, the mean false-positive mark rate in fatty breasts was higher than that in dense breasts [1.00 (28/28) vs. 0.27 (14/52) at level 2, p = 0.007; 0.68 (19/28) vs. 0.15 (8/52) at level 1, p = 0.017). However, in the 2D CAD system, the mean false-positive mark rate was not different between fatty and dense breasts [0.07 (2/28) vs. 0.02 (1/52) at level 1, p = 0.333). In terms of the view-based false positive mark rate, there was no significant difference between the CC view and the MLO view at each level (p = 0.59–0.99).
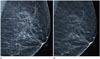
All false-positive cases were from typical benign round or vascular calcifications (Fig. 2). 3D CAD level 2 marked 21 vascular calcifications and 21 single round calcifications, and 3D CAD level 1 marked 13 vascular calcifications and 14 single round calcifications; in comparison, 2D CAD level 2 marked 6 vascular calcifications and 2D CAD level 1 marked 3 single round calcifications. At the same sensitivity level, the 3D CAD system showed significantly more false-positive marks than the 2D CAD system (level 2, p = 0.009; level 1, p = 0.033). In dense breasts (52 views), vascular calcifications were not marked with either the 3D or 2D CAD system. False-positive vascular calcifications were only marked in fatty breasts (28 views) with 3D CAD.
DISCUSSION
Our study demonstrated that the 3D CAD system for DBT provided comparable sensitivity, albeit with higher false-positive mark rates, than the 2D CAD system for DM in the detection of breast calcifications. For the detection of calcifications, previous studies using prototype DBT have reported sensitivities of 80% to 90% with false-positive rates of 0.65 to 1.55 per DBT volume (6910). In the present study, we observed same case-based sensitivities [100% (31/31)] for malignant calcifications with a 0.52 false-positive mark rate per DBT volume, which is better than the results of previous studies. Superior performance observed in our study may be attributed to the improvement in the commercialized DBT system that was used over previous prototype DBT systems and the fact that reconstructed images used as input data have less noise than images used as projection view input data. Recently, Morra et al. (14) reported that 3D CAD for DBT showed per lesion sensitivity of 95% (37 of 39) and 0.5 false-positive microcalcification cluster rate per view, which were similar to our results. It is well known that combined DBT and mammography would increase the interpretation times from 35% up to 70% (15) as it usually includes a mean value of 56.7 slices (range, 35–76 slices) per breast. When the radiologists encounter faint calcifications, they review the routine mammography and obtain an additional view for characterization. The process requires additional time, cost and extra irradiation. But, not all calcification candidates are proven to be clinically significant. Thus, we expect that the 3D Calc CAD may reduce the unnecessary time and cost for the detection and characterization of calcifications and can potentially lead to a decrease in the workload. Further studies evaluating the impact of 3D CAD on the interpretation time and confidence level with use of DBT are warranted.
With respect to the sensitivities for detection of malignant calcifications, in the view-based analysis, the 2D CAD system with operating level 1 missed several lesions on the CC (one out of 31) and MLO (three out of 31) views, respectively. However, in the case-based analysis using combined CC and MLO views, all calcifications were detected. Thus, it does not seem to be a matter of concern that fractionalized images used in DBT might reduce the conspicuity between calcifications and background parenchyma and result in missing the calcifications on 3D CAD for DBT.
On the contrary, the mean false-positive mark rate per view of the 3D CAD system in our study was found to be higher than that obtained with the 2D CAD system (0.52 ± 0.91 vs. 0.07 ± 0.26 at level 2; 0.34 ± 0.75 vs. 0.04 ± 0.19 at level 1). The high false-positive mark rate of 3D CAD can be explained in three ways. First, when there is a cluster of calcifications in the same x-y axis but at different z axis locations, 3D CAD marks the calcifications as separate groups, whereas the 2D CAD would mark it as one group. Second, 3D CAD marked more typical benign round or vascular calcifications than 2D CAD. In addition, the false-positive mark rate of 3D CAD for DBT may have been more affected by breast composition than that of 2D CAD for DM: with the 3D CAD system, the mean false-positive mark rate in fatty breasts was higher than that in dense breasts [1.0 (28/28) vs. 0.27 (14/52) at level 2, p = 0.007; 0.68 (19/28) vs. 0.15 (8/52) at level 1, p = 0.017], whereas in the 2D CAD system, the mean false-positive mark rates were not different between fatty and dense breasts [0.07 (2/28) vs. 0.02 (1/52) at level 1, p = 0.333]. This is probably because women with fatty breasts tended to show more vascular calcifications on mammograms, which was the main cause of false-positive marks on the 3D CAD system. Although most of these false-positive marks on DBT can be easily dismissed by the radiologists and they do not affect the diagnostic performance, further optimization of 3D Calc CAD is warranted in order to reduce the number of false-positive marks. In our study, the case-based false-positive rate of the 2D CAD system was 0.15–0.3, which was similar to the result from a previous study in which the researchers reported that the false-positive CAD mark rate for calcification was 0.4 (ranging from 0.19 to 0.63) on negative DM (16).
Our study has several limitations. First, it is a single institutional, retrospective study in an academic institution. Thus, our study population is not representative of the general screening population. Second, we only used one commercialized DBT machine and a CAD system and it was used only for the detection of calcifications, which may limit the generalizability of our results. Third, we did not evaluate the impact of CAD on radiologists' performances.
In conclusion, we found that 3D CAD showed comparable sensitivity to 2D CAD in the detection of breast calcifications. Although the false-positive mark rate was higher with the 3D CAD system than with 2D CAD, we believe that this new technique may potentially be helpful in reducing the interpretation time for DBT images.
 XML Download