Abstract
Purpose
We prospectively evaluated whether gadoxetic acid (Gd-EOB-DTPA) admin-istration for liver magnetic resonance (MR) imaging affects the quantification of hepatic steatosis using MR spectroscopy (MRS).
Materials and Methods
A total of 155 patients were included, who underwent gadoxetic acid-enhanced liver MR imaging and MRS during a 5-month period. Fast breath-hold high-speed T2-corrected multi-echo MRS was used before, and 20 min after, gadoxetic acid injection. The same location was maintained in the pre-contrast and post-contrast MRS. Changes in the fat fraction (FF) were compared between the pre- and post-contrast MRS using a paired t-test. The change in FF between cirrhotic and non-cirrhotic patients was compared using an independent t-test. In cirrhotic patients, the correlation between FF change and biochemical marker using Pearson's correlation test, was evaluated.
Results
The mean FF in the post-contrast MRS (5.05 ± 5.26%) was significantly higher than in the pre-contrast MRS (4.77 ± 0.57%) (p < 0.000). The FF change between pre-contrast and post-contrast MRS was significantly higher in non-cirrhotic patients (0.41 ± 0.77%) than in cirrhotic patients (0.14 ± 0.59) (p = 0.010). Albumin and alkaline phosphatase shows weak correlation with FF change (both p < 0.02).
Go to : 
Index terms
Magnetic Resonance Spectroscopy, Fatty Liver, Gadoxetic Acid, Liver CirrhosisREFERENCES
2. Browning JD, Szczepaniak LS, Dobbins R, Nuremberg P, Hor-ton JD, Cohen JC, et al. Prevalence of hepatic steatosis in an urban population in the United States: impact of ethnicity. Hepatology. 2004; 40:1387–1395.

3. Farrell GC, Larter CZ. Nonalcoholic fatty liver disease: from steatosis to cirrhosis. Hepatology. 2006; 43(2 Suppl 1):S99–S112.

4. Ong JP, Younossi ZM. Epidemiology and natural history of NAFLD and NASH. Clin Liver Dis. 2007; 11:1–16. vii.

5. Szczepaniak LS, Nurenberg P, Leonard D, Browning JD, Re-ingold JS, Grundy S, et al. Magnetic resonance spectroscopy to measure hepatic triglyceride content: prevalence of hepatic steatosis in the general population. Am J Physiol En-docrinol Metab. 2005; 288:E462–E468.

6. Marchesini G, Brizi M, Morselli-Labate AM, Bianchi G, Bu-gianesi E, McCullough AJ, et al. Association of nonalcoholic fatty liver disease with insulin resistance. Am J Med. 1999; 107:450–455.

7. Mehta SR, Thomas EL, Bell JD, Johnston DG, Taylor-Robin-son SD. Noninvasive means of measuring hepatic fat content. World J Gastroenterol. 2008; 14:3476–3483.

8. Syn WK, Nightingale P, Bateman JM. Nonalcoholic fatty liver disease in a district general hospital: clinical presen-tation and risk factors. Hepatol Int. 2008; 2:190–195.

9. Wieckowska A, Feldstein AE. Nonalcoholic fatty liver disease in the pediatric population: a review. Curr Opin Pedi-atr. 2005; 17:636–641.

10. van Werven JR, Hoogduin JM, Nederveen AJ, van Vliet AA, Wajs E, Vandenberk P, et al. Reproducibility of 3.0 Tesla magnetic resonance spectroscopy for measuring hepatic fat content. J Magn Reson Imaging. 2009; 30:444–448.

11. Roldan-Valadez E, Favila R, Martínez-López M, Uribe M, Ríos C, Méndez-Sánchez N. In vivo 3T spectroscopic quantification of liver fat content in nonalcoholic fatty liver disease: Correlation with biochemical method and morphom-etry. J Hepatol. 2010; 53:732–737.

12. Lee SS, Park SH. Radiologic evaluation of nonalcoholic fatty liver disease. World J Gastroenterol. 2014; 20:7392–7402.

13. Wu CH, Ho MC, Jeng YM, Hsu CY, Liang PC, Hu RH, et al. Quantification of hepatic steatosis: a comparison of the accuracy among multiple magnetic resonance techniques. J Gastroenterol Hepatol. 2014; 29:807–813.

14. Bohte AE, van Werven JR, Bipat S, Stoker J. The diagnostic accuracy of US, CT, MRI and 1H-MRS for the evaluation of hepatic steatosis compared with liver biopsy: a meta-analysis. Eur Radiol. 2011; 21:87–97.

15. Frydrychowicz A, Lubner MG, Brown JJ, Merkle EM, Nagle SK, Rofsky NM, et al. Hepatobiliary MR imaging with gado-linium-based contrast agents. J Magn Reson Imaging. 2012; 35:492–511.

16. Jeong WK, Kim YK, Song KD, Choi D, Lim HK. The MR imaging diagnosis of liver diseases using gadoxetic acid: empha-sis on hepatobiliary phase. Clin Mol Hepatol. 2013; 19:360–306.

17. Hamm B, Staks T, Mühler A, Bollow M, Taupitz M, Frenzel T, et al. Phase I clinical evaluation of Gd-EOB-DTPA as a hepatobiliary MR contrast agent: safety, pharmacokinet-ics, and MR imaging. Radiology. 1995; 195:785–792.

18. Park YS, Lee CH, Kim JH, Kim BH, Kim JH, Kim KA, et al. Effect of Gd-EOB-DTPA on hepatic fat quantification using high-speed T2-corrected multi-echo acquisition in (1)H MR spectroscopy. Magn Reson Imaging. 2014; 32:886–890.

19. Hamilton G, Yokoo T, Bydder M, Cruite I, Schroeder ME, Sirlin CB, et al. In vivo characterization of the liver fat ¹H MR spectrum. NMR Biomed. 2011; 24:784–790.
20. Kamath PS, Wiesner RH, Malinchoc M, Kremers W, Therneau TM, Kosberg CL, et al. A model to predict survival in patients with end-stage liver disease. Hepatology. 2001; 33:464–470.

21. van Montfoort JE, Stieger B, Meijer DK, Weinmann HJ, Mei-er PJ, Fattinger KE. Hepatic uptake of the magnetic resonance imaging contrast agent gadoxetate by the organic anion transporting polypeptide Oatp1. J Pharmacol Exp Ther. 1999; 290:153–157.
22. Feier D, Balassy C, Bastati N, Stift J, Badea R, Ba-Ssalamah A. Liver fibrosis: histopathologic and biochemical influences on diagnostic efficacy of hepatobiliary contrast-enhanced MR imaging in staging. Radiology. 2013; 269:460–468.

23. Tamada T, Ito K, Higaki A, Yoshida K, Kanki A, Sato T, et al. Gd-EOB-DTPA-enhanced MR imaging: evaluation of hepatic enhancement effects in normal and cirrhotic livers. Eur J Radiol. 2011; 80:e311–e316.

24. Kanki A, Tamada T, Higaki A, Noda Y, Tanimoto D, Sato T, et al. Hepatic parenchymal enhancement at Gd-EOB-DTPA-enhanced MR imaging: correlation with morphological grading of severity in cirrhosis and chronic hepatitis. Magn Reson Imaging. 2012; 30:356–360.

25. Kim HY, Choi JY, Park CH, Song MJ, Song DS, Kim CW, et al. Clinical factors predictive of insufficient liver enhancement on the hepatocyte-phase of Gd-EOB-DTPA-enhanced magnetic resonance imaging in patients with liver cirrhosis. J Gastroenterol. 2013; 48:1180–1187.

Go to : 
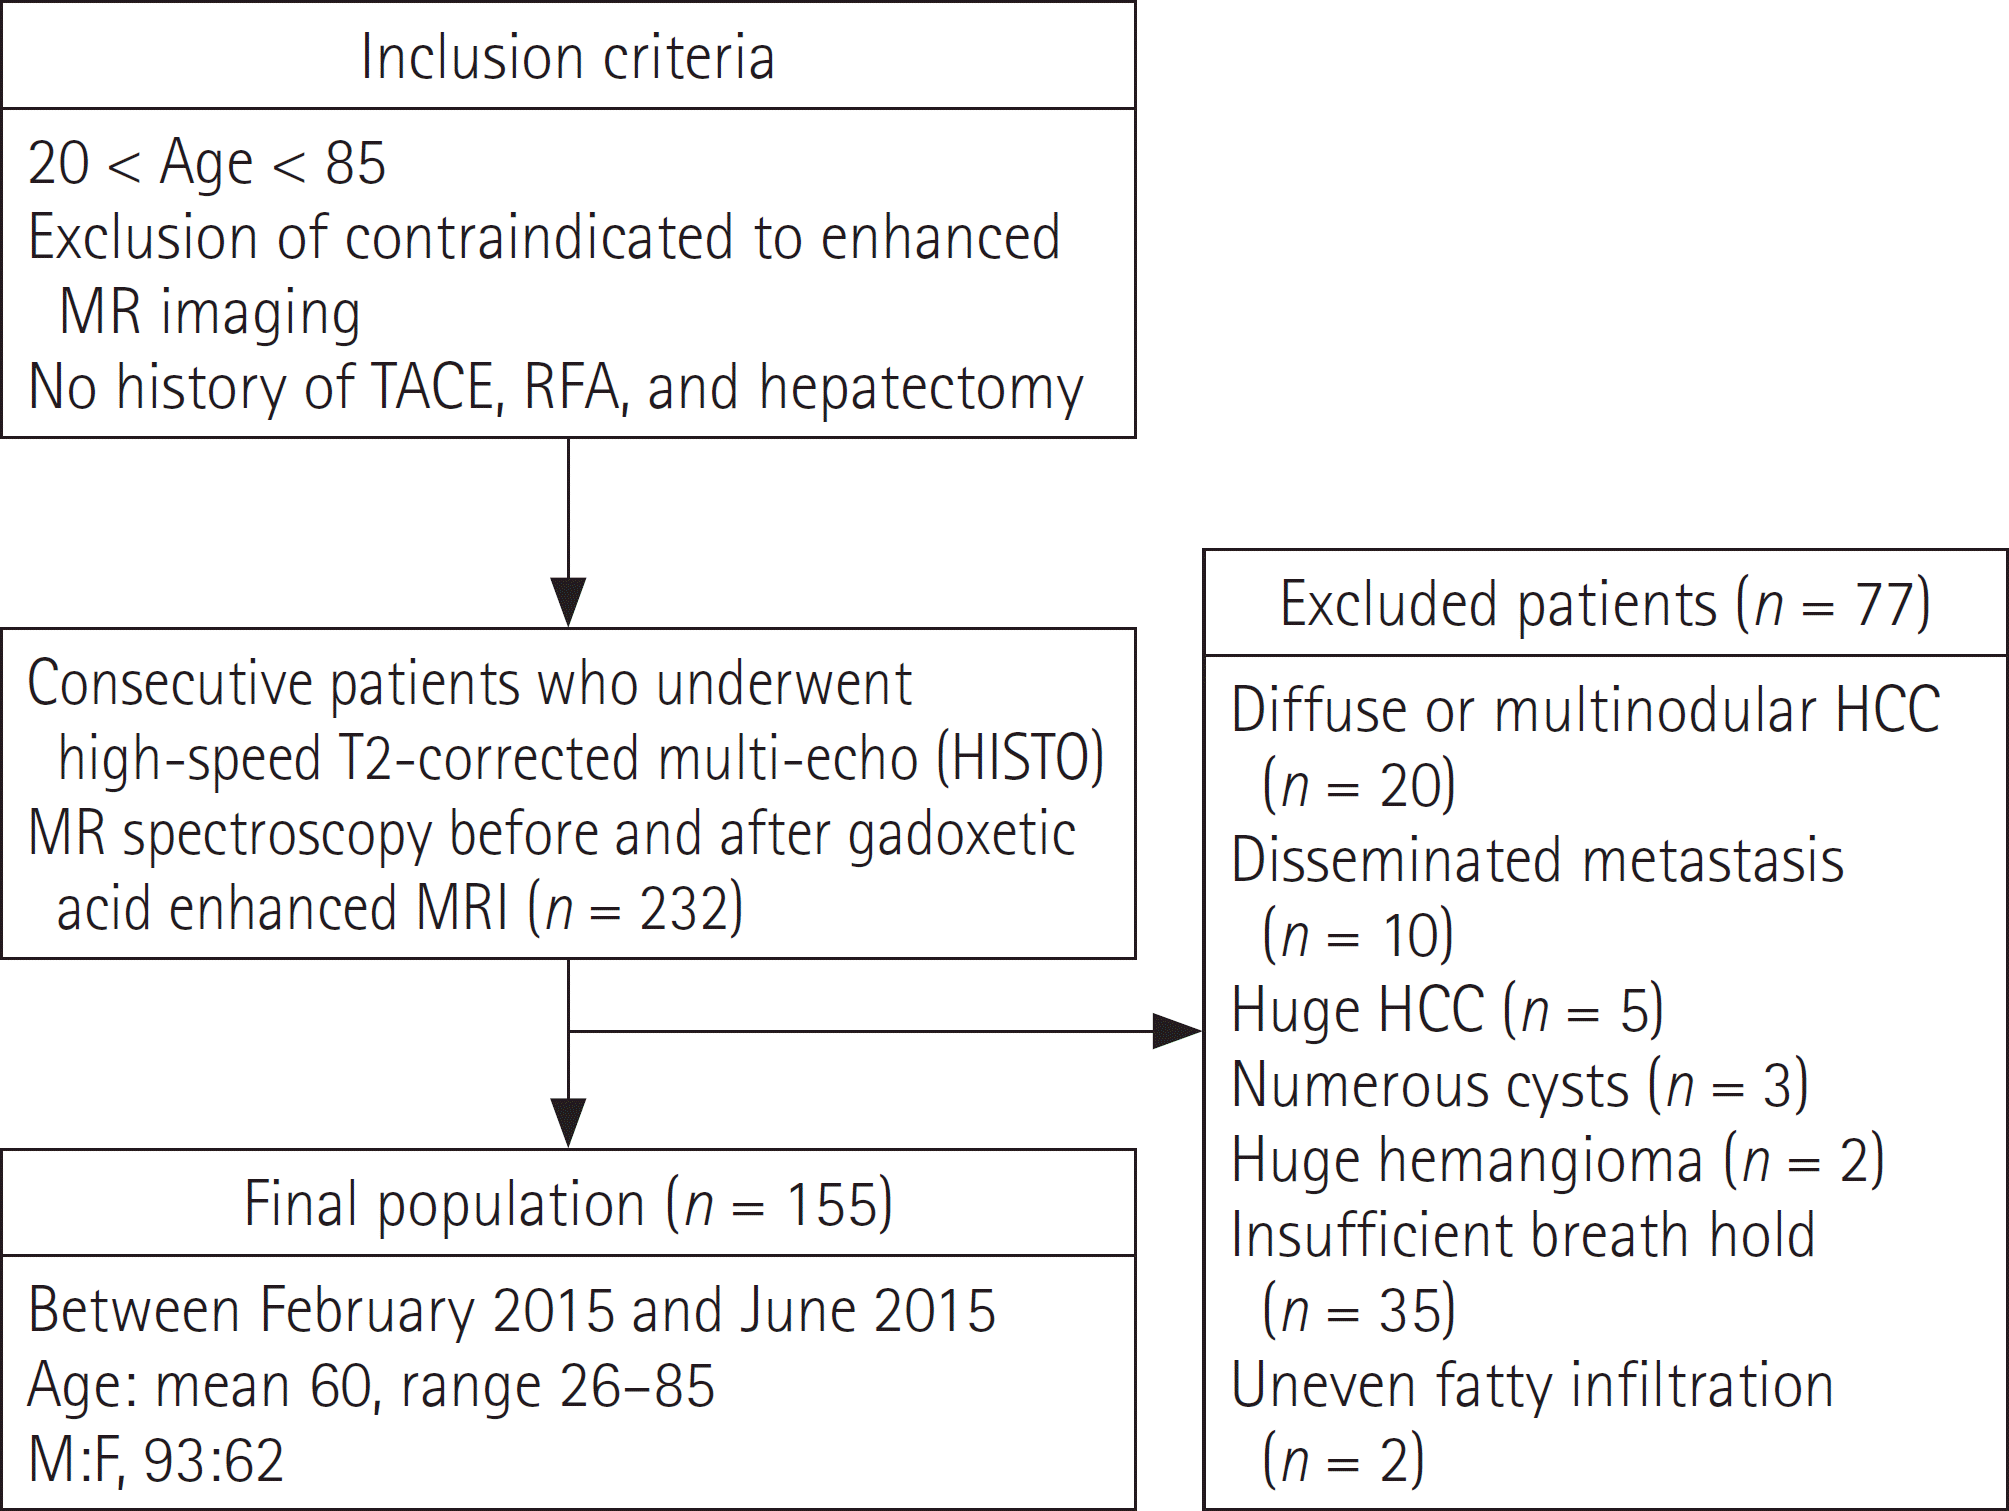 | Fig. 1.Flow chart of patient enrollment. HCC = hepatocellular carcinoma, MR = magnetic resonance, RFA = radiofrequency ablation, TACE = transarterial chemoembolization |
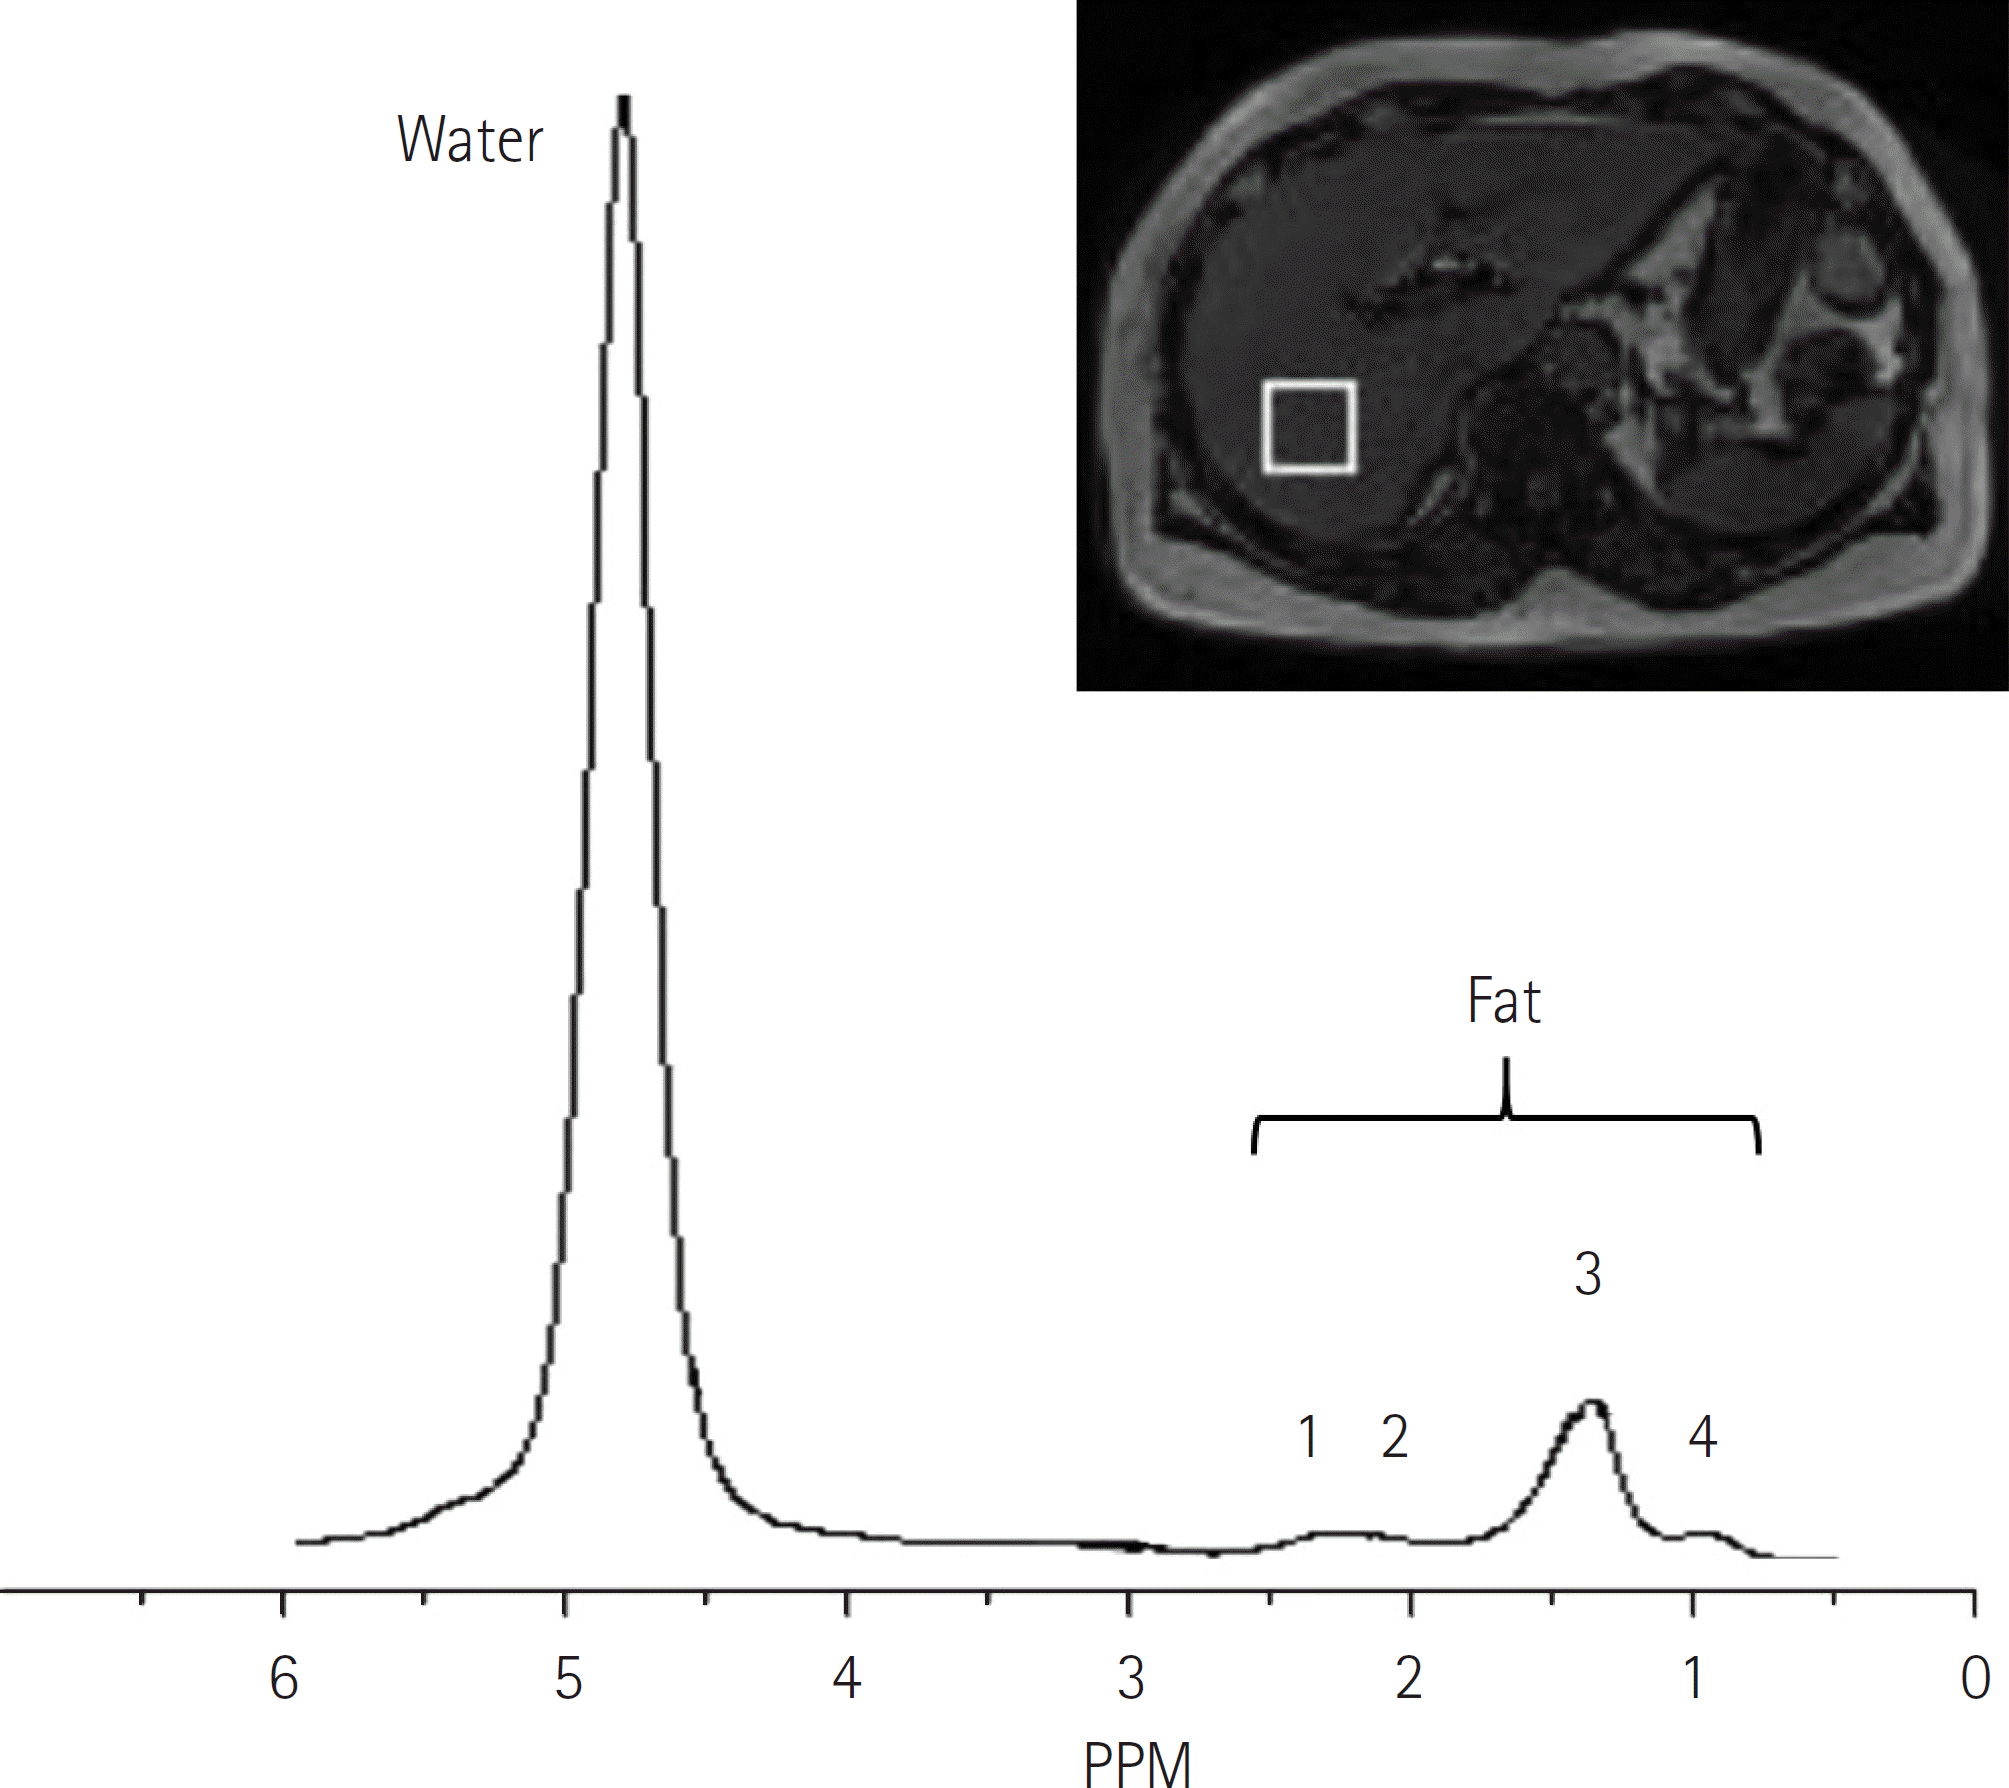 | Fig. 2.Hepatic steatosis spectrum of a 77-years-old female with sus-picious focal hepatic lesion. Proton of fat appears as several peaks, in-cluding a diacyl peak at 2.75 ppm (1), an α-olefinic and α-carboxyl peak at 2.1 ppm (2), a methylene peak at 1.3 ppm (3), and a methyl peak at 0.9 ppm (4). Whereas, proton in water appears as a single peak at 4.7 ppm. Fat fraction can be calculated as (Sum of fat peaks) / (Sum of fat peaks + water peak). |
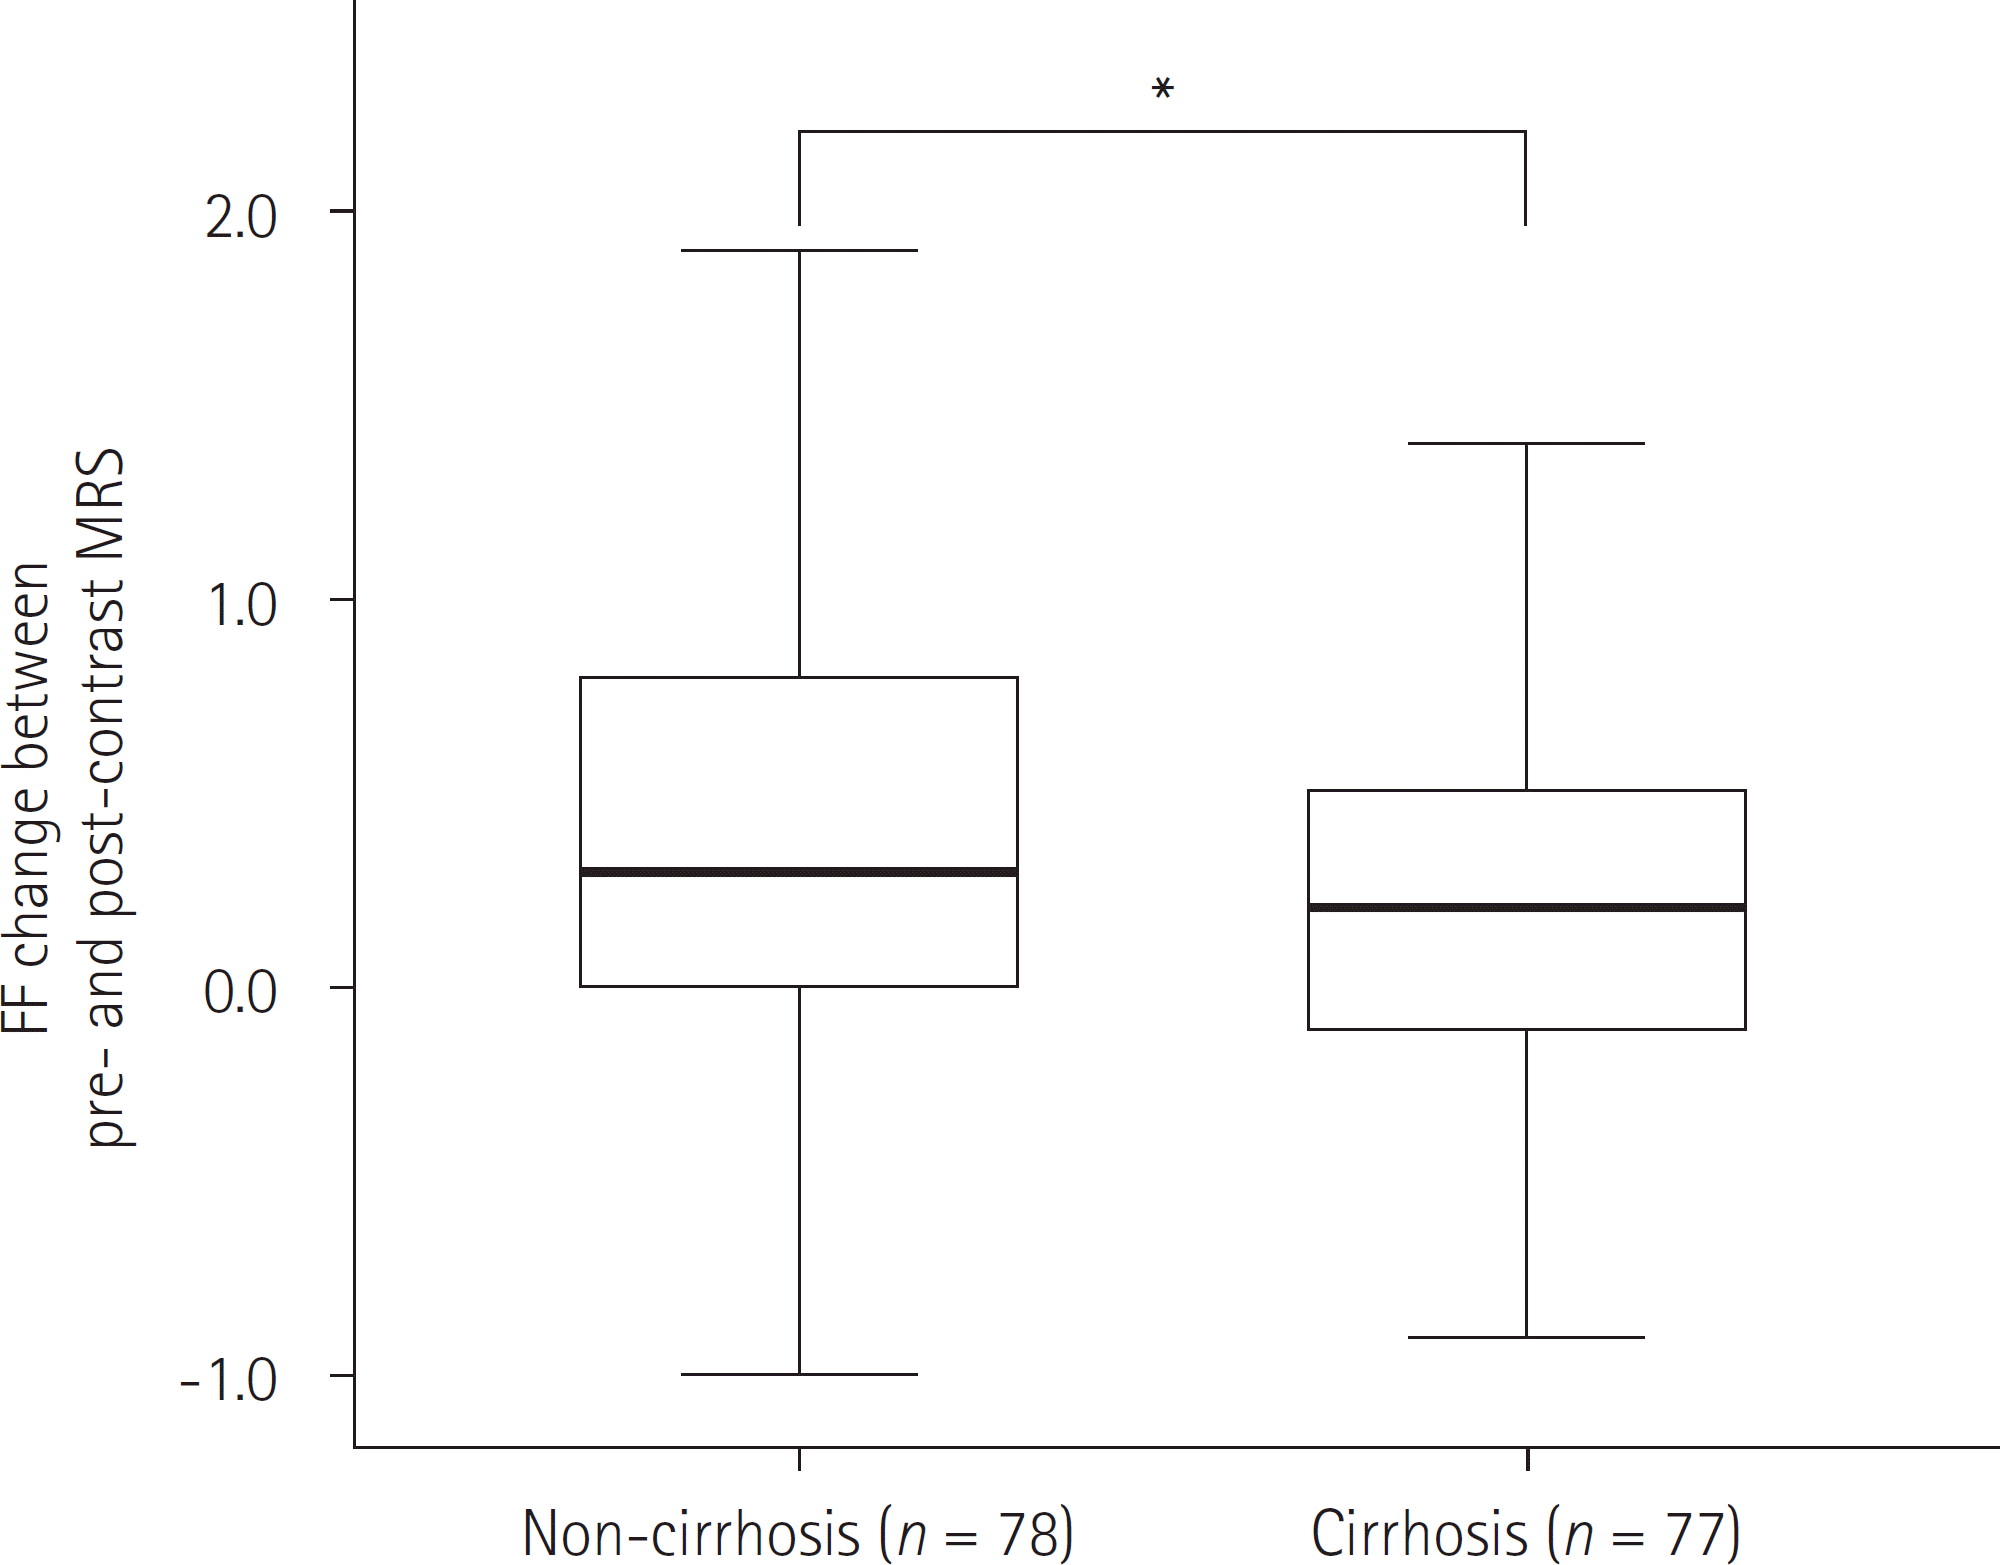 | Fig. 3.Relationship between the FF change and liver cirrhosis in the entire patient cohort. The mean value is significantly higher for patients in the non-cirrhotic group (∗ p < 0.000). The lower edge of each box indicates the 25th percentile, and the upper edge indicates the 75th percentile. The horizontal line in the middle of the box indicates the median. Lines extending from either end of the box indicate the extent of the data beyond the 25th and 75th percentile but within 1.5-times the interquartile range. Outliers were not noted. FF = fat fraction, MRS = magnetic resonance spectroscopy |
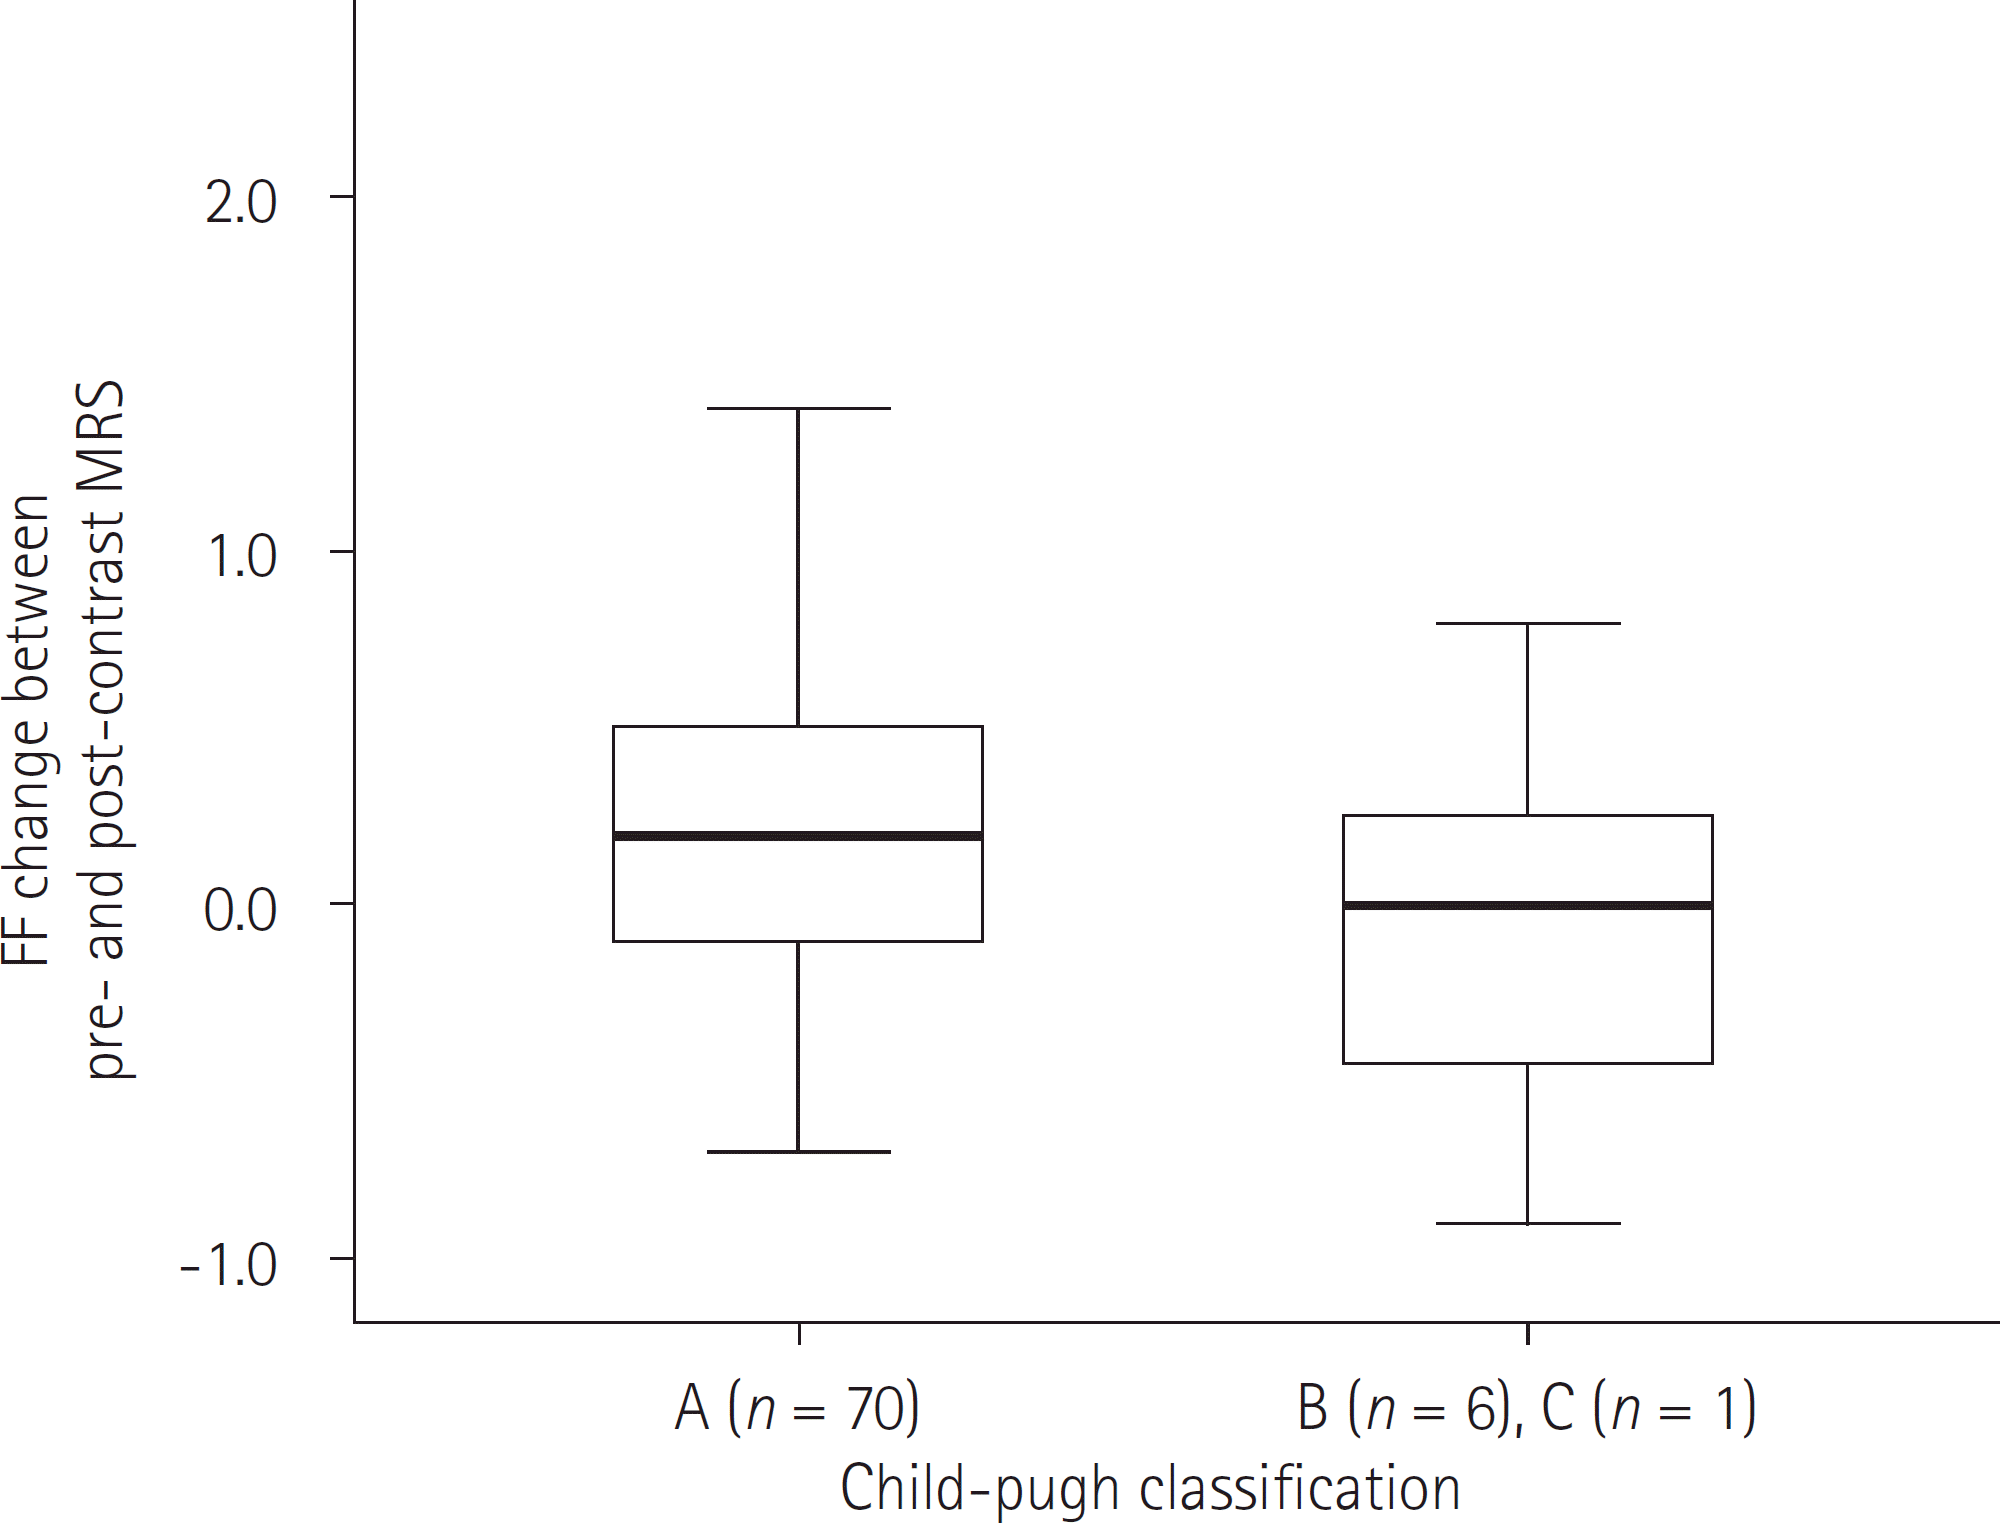 | Fig. 4.Relationship between the changes in FF and the Child-Pugh class in the cirrhotic group (n = 77). No significant difference of FF change is observed between Child-Pugh classification A vs. B and C (Child-Pugh A, 0.17 ± 0.58; B and C, -0.71 ± 0.59) (p = 0.856). FF = fat fraction, MRS = magnetic resonance spectroscopy |
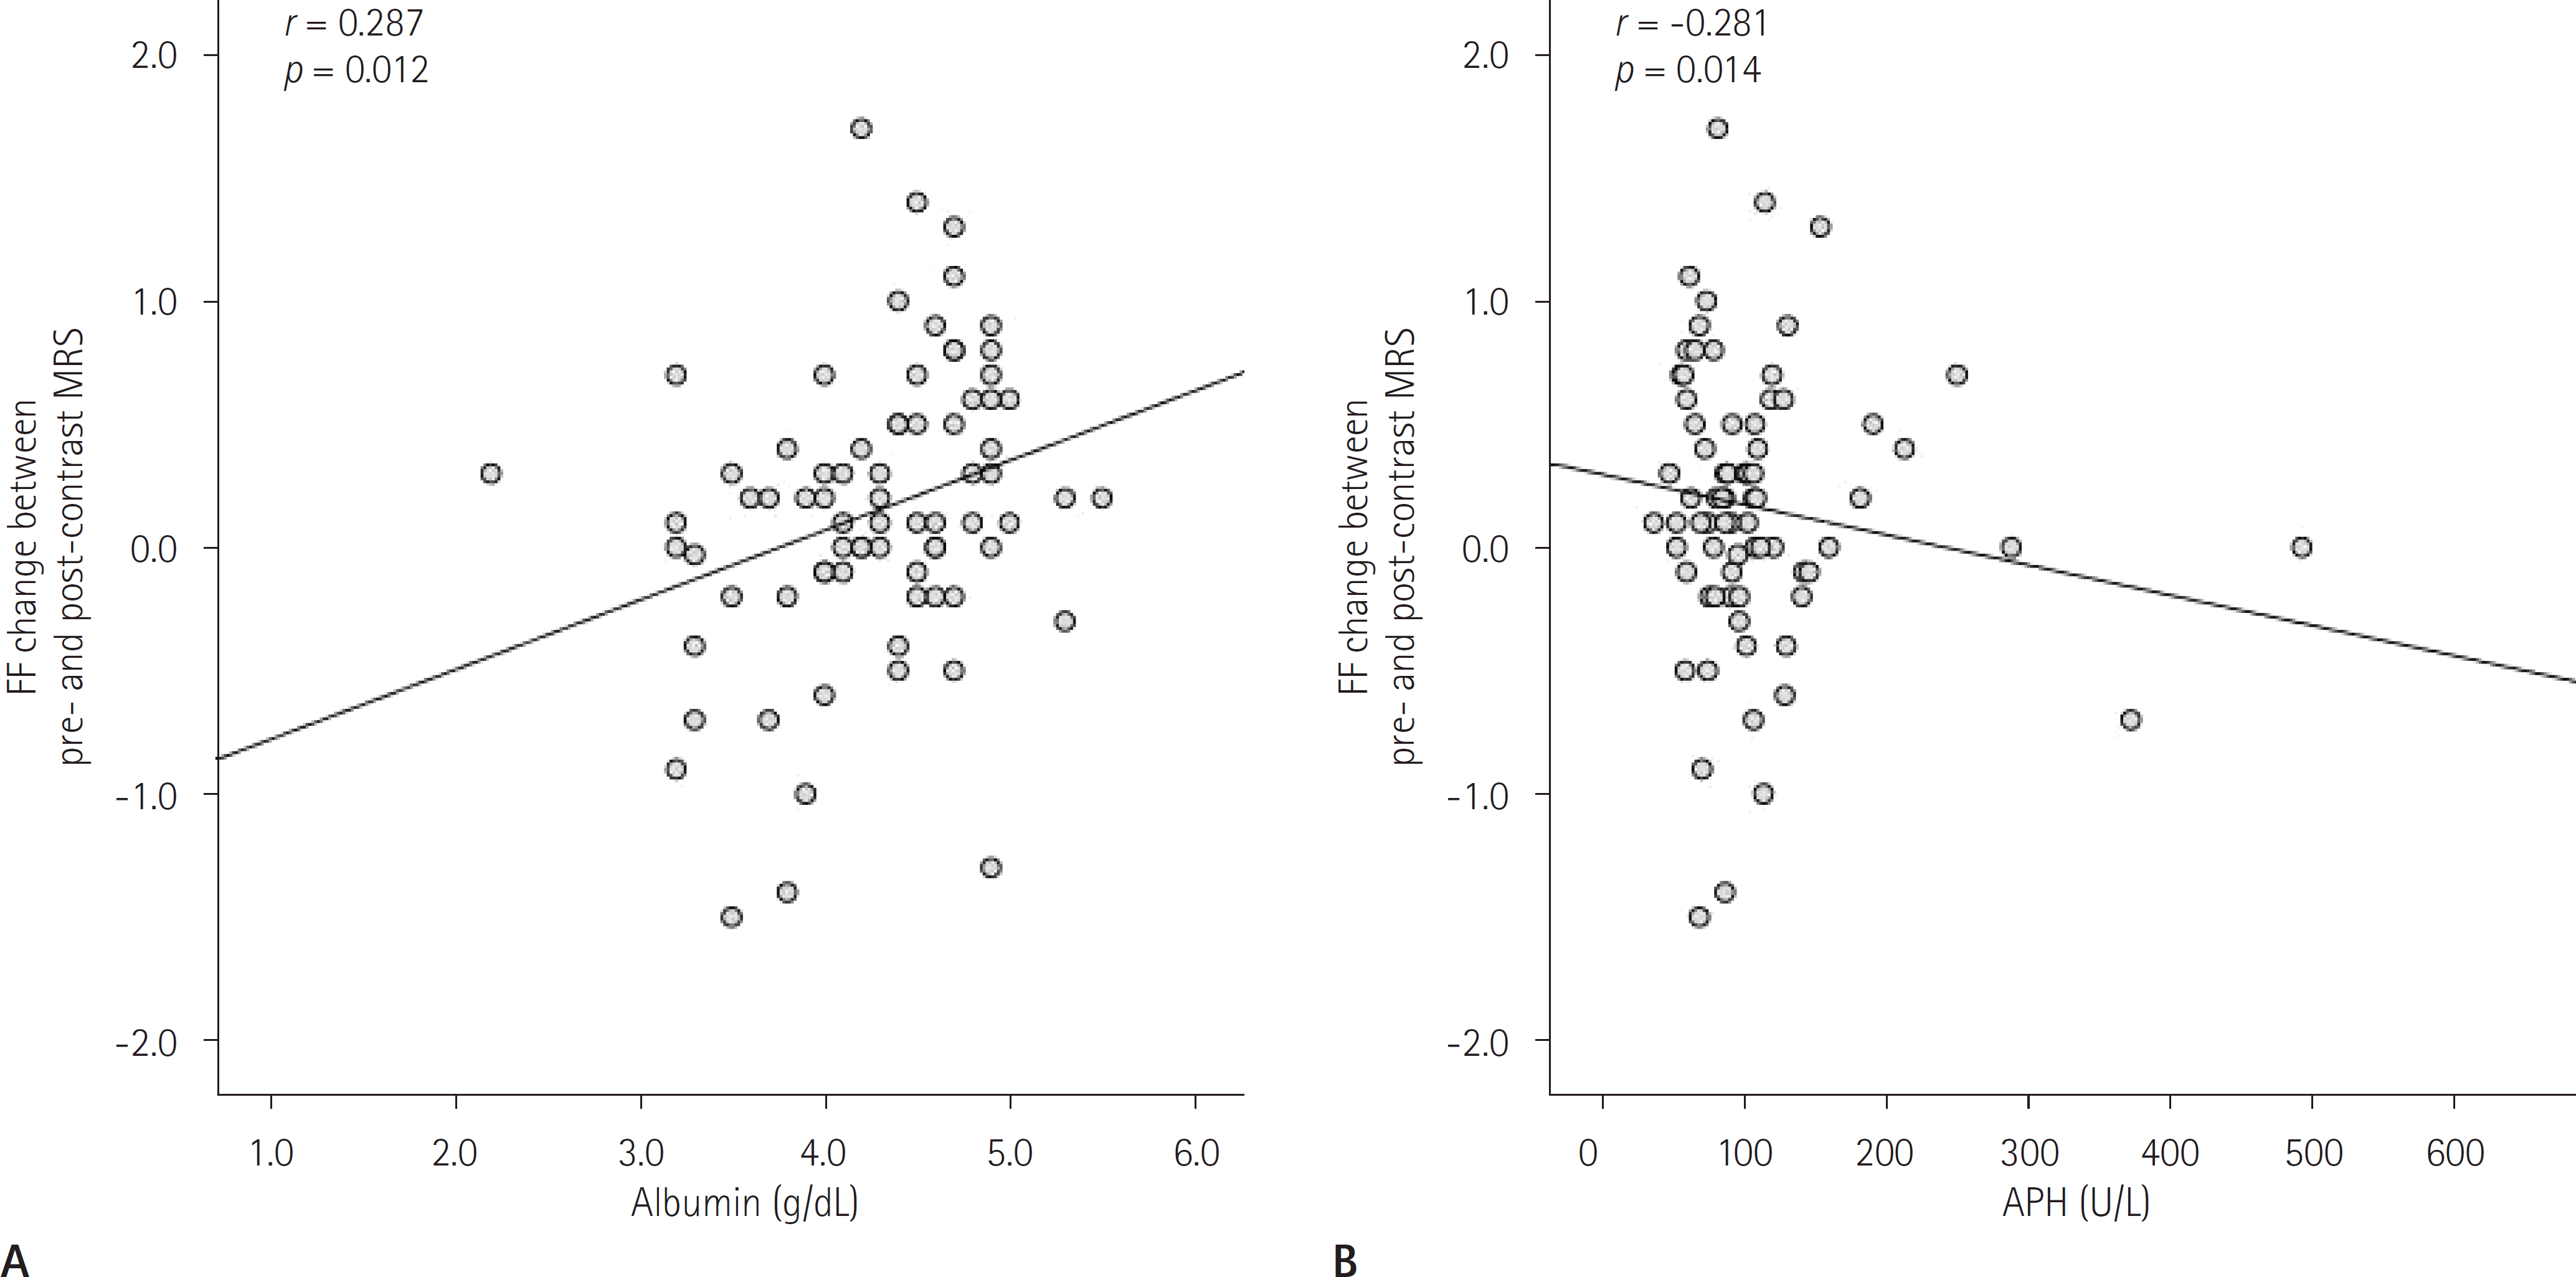 | Fig. 5.Scatter plots of the correlation in the liver cirrhosis group. A. The relationship between alkaline phosphatase and FF change. B. The relationship between albumin and FF change. APH = alkaline phosphatase, FF = fat fraction, MRS = magnetic resonance spectroscopy |
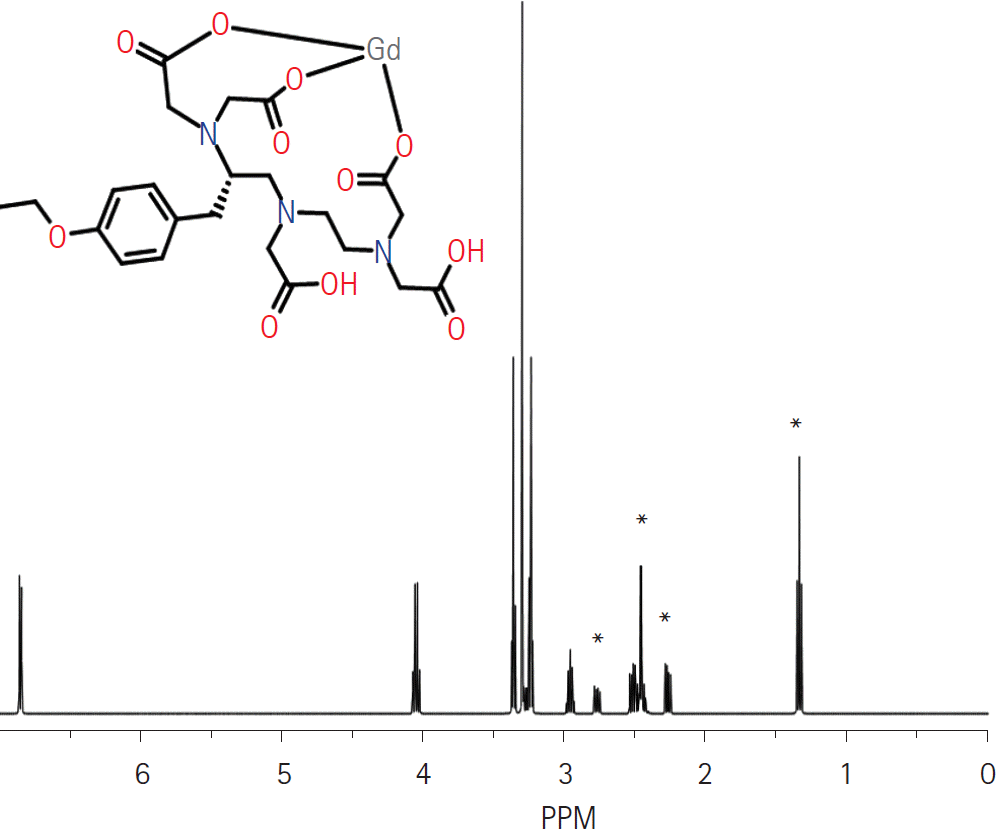 | Fig. 6.Molecular structure and predicted MR spectra of gadoxetic acid. Several peaks (∗) are located in similar frequencies with triglyceride in hepatocyte (Fig. 2). We hypothesize that these peaks may pro-duce overestimation of fat fraction on post-contrast MRS. MRS = magnetic resonance spectroscopy |
Table 1.
The Mean FFs and the Changes in the FF between Pre-Contrast MRS and Post-Contrast MRS
Table 2.
Relationships between Clinical Factors and the Changes in the Fat Fraction between Pre-Contrast MRS and Post-Contrast MRS
| Parameter | Total Cohort | Liver Cirrhosis Group | ||||||
|---|---|---|---|---|---|---|---|---|
| Mean | SD | Correlation Coefficient | p-Value | Mean | SD | Correlation Coefficient | p-Value | |
| Age (years) | 60.4 | 11.0 | r = −0.137 | 0.089 | 62.5 | 9.7 | r = −1.149 | 0.197 |
| Platelet count (103/µL) | 212.8 | 85.3 | r = 0.146 | 0.072 | 181.1 | 88.5 | r = 0.192 | 0.097 |
| Prothorombin time (INR) | 1.1 | 0.4 | r = −0.052 | 0.554 | 1.1 | 0.19 | r = −0.029 | 0.806 |
| Total bilirubin (mg/dL) | 0.8 | 0.9 | r = −0.035 | 0.678 | 0.9 | 0.6 | r = −0.183 | 0.117 |
| Albumin (g/dL) | 4.3 | 0.8 | r = 0.151 | 0.074 | 4.2 | 0.8 | r = 0.287 | 0.012∗ |
| AST (U/L) | 45.0 | 54 | r = −0.084 | 0.305 | 54.0 | 55.7 | r = −0.145 | 0.211 |
| ALT (U/L) | 34.2 | 44.2 | r = 0.029 | 0.720 | 37.8 | 38.1 | r = −0.015 | 0.897 |
| APH (U/L) | 112.7 | 132.2 | r = −0.163 | 0.061 | 121.4 | 135.6 | r = −0.281 | 0.014∗ |
| Sodium (mEq/L) | 141.6 | 2.9 | r = 0.185 | 0.122 | 141.8 | 2.8 | r = 0.168 | 0.166 |
| Creatinine (mg/dL) | 0.9 | 0.2 | r = −0.048 | 0.554 | 0.9 | 0.2 | r = −0.157 | 0.177 |
| Child-pugh (score) | 5.3 | 0.8 | r = −0.045 | 0.579 | 5.3 | 0.8 | r = −0.132 | 0.254 |
| MELD (score) | 8.3 | 2.8 | r = −0.082 | 0.355 | 8.5 | 2.3 | r = −0.153 | 0.188 |


 PDF
PDF ePub
ePub Citation
 Print
Print


 XML Download