

 PDF
PDF ePub
ePub Citation
 Print
Print


INTRODUCTION
In nonalcoholic fatty liver disease (NAFLD), excess liver fat (more than 5%) can accumulate in a patient without a history of alcohol abuse (1). It affects 20–40% of individuals in Western countries and 5–40% of the general population across the Asia-Pacific area (23). The rising prevalence of NAFLD including nonalcoholic steatohepatitis is in parallel with that of obesity, type 2 diabetes, and metabolic syndrome (4). Ten to 29% of patients with nonalcoholic steatohepatitis may develop liver cirrhosis within 10 years and 4–27% of these patients may develop hepatocellular carcinoma (5). Fatty liver is a risk factor for primary dysfunction in donors and recipients after liver transplantation (6).
Liver biopsy is the “gold standard” for quantifying a fatty liver. However, this procedure can provoke pain, bleeding, and other severe complications. Furthermore, sample error induced by uneven fatty distribution can affect the accuracy of measurements (178). A noninvasive method that is accurate, cost-effective, and convenient is very important for evaluating NAFLD in clinical field.
Compared to biopsy, imaging studies such as ultrasonography (US), computed tomography (CT), and magnetic resonance imaging (MRI) are more commonly applied in clinical practice (91011). US is a cost-effective imaging technique that is widely available. However, it is limited by observer variability. It is not an accurate technique for assessing fatty liver (12). CT is reliable for assessing moderate or severe hepatic steatosis. However, it has unignorable limitation in radiation exposure (1314). Multiecho Dixon MRI and MR spectroscopy (MRS) shows excellent performance in fatty liver quantification with strong correlation with histopathological evaluation for liver biopsies in NAFLD (15). However, its high expense, demands for hold-breath, and requirement of special technique restrict its large-scale application.
Several studies have used US, CT, and MRI to evaluate a fatty liver (910111314151617181920212223242526272829303132). Some studies have compared two or three imaging modalities for the diagnosis of a fatty liver (131829303233). To the best of our knowledge, there is no study that has compared all imaging modalities [i.e., US, single-energy CT (SECT), dual-energy CT (DECT), MRI, and MRS]. Therefore, the objective of this study was to compare different imaging modalities (i.e., US, SECT, DECT, multiecho MRI, and high-speed T2-corrected multiecho proton MRS) for the diagnosis of fatty liver induced by a high-fat diet in a rat model.
MATERIALS AND METHODS
Animal Model
Twenty male 8-week-old Sprague-Dawley rats (280–320 g) were used in this study. The experimental study was approved by the governmental committee and Institutional Animal Research Review Board of Chonnam National University Hwasun Hospital.
Rats were housed in a controlled environment (12 hr/12 hr, light/dark cycle) with free access to water and food. Fatty liver was induced by two different high-fat diets (D12450B and D12492; Research Diets, Inc., New Brunswick, NJ, USA) to obtain a wider range of nonfatty livers. Fifteen rats received a 60% high-fat diet for 1, 2, 3, 4, or 5 weeks (i.e., fatty liver group). Five rats received a 10% high-fat diet (i.e., nonfatty liver group or control group).
US Examination
US, CT, and MR examination were performed on the same day. Rats were intraperitoneally anesthetized with 2% sodium pentobarbital (40 mg/kg). Their abdomens were shaved to reduce imaging artifacts during US examination. US was performed with Philips iU22 ultrasound equipment (Philips Healthcare, Eindhoven, the Netherlands) with a 15 MHz linear transducer (L15-7io) by one experienced radiologist who was blinded to other study results. All images were obtained in fundamental brightness mode (B-mode). Two-dimensional B-mode image plans were acquired with optimized gain and time gain compensation settings which remained constant throughout the experiment. The acoustic focus was the center of the liver. To estimate the sonographic hepatorenal index (HRI), US images of the liver and right kidney were obtained in sagittal liver/right kidney view at supine position.
US imaging data were transmitted to a picture archiving and communication system (PACS, Maroview 5.4; Infinitt, Seoul, Korea). From the sagittal liver/right kidney view of US, a 1-cm2 circular region of interest (ROI) was selected for hepatic parenchyma uniformly after excluding blood vessels, bile ducts, and other focal hypo- or hyperechogenicity. A ROI of 0.3–0.5 cm2 was selected for the right renal cortex excluding the large vessels, sinus, and medulla. The liver and right kidney ROIs were selected at the same depth. The mean gray-scale value of the pixels in each ROI was used to determine its echogenicity. HRI (i.e., the ratio of the echogenicity of the liver to the echogenicity of the right kidney parenchyma) was calculated (17).
CT Examination
SECT and DECT were performed on Somatom Definition FLASH equipment (Siemens Medical Systems, Forchheim, Germany). The CT scanner has two X-ray tubes and corresponding detectors at an angular offset of 90° within the same gantry. Tube potentials were typically set at 140 kVp for tube A and 80 kVp for tube B. This configuration allowed imaging of the same voxel at the same time in two different X-ray spectra.
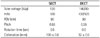
After acquiring a lateral and anterior-posterior topogram, the scan range covered the whole liver in the z-axis extension. Rats were carefully placed in the isocenter of the scanner. The parameters for SECT and DECT scanning are shown in Table 1. All images were processed with a dedicated medium-soft convolution kernel (D30f) in the abdominal window [level 50 Hounsfield units (HU), width 450 HU] with slice thickness of a 1.5-mm.
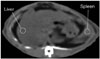
In SECT and DECT, data were processed by a research fellow under direct supervision of an experienced abdominal radiologist (30 years of experience). The research fellow was blinded to study results. Five ROIs were selected in the liver and one ROI was selected in the spleen. The area of the ROI was 0.5–1.0 cm2. Hepatic fat content was measured by using mean liver attenuation of all ROIs in the liver (34). The mean HU of the right lobe of the liver and spleen was obtained. Differences between the HU of liver and spleen (HUS) were calculated (Fig. 2). On DECT images, the HU values of liver at 140 kVp and 80 kVp were obtained and the difference between HU of 140 kVp and 80 kVp (HUD) was calculated. The anatomic level, position, set form, and dimension of every ROI were matched those of SECT and DECT images. Difference in HU was calculated (1425).
MRI and MRS Examination
Rats anesthetized by isoflurane (2.5% isoflurane in air, 1 L/min) were fixed in supine position. They were allowed to breathe freely. All rats were scanned with a 3.0 T clinical MR scanner (Magnetom Skyra, Siemens Medical Systems, Forchheim, Germany) with knee coil.
For MRI, multiecho MRI was performed using the work in progress (WIP) software package by Siemens Medical System. Multisection axial images were obtained by using a two-dimensional spoiled gradient echo sequence with all array coil elements. To minimize T1 effects, a low flip angle (4°) was used at a repetition time of 8.83 ms. To estimate fat-water signal interference and T2* effects, six echoes were obtained at a serial of opposed-phase (OP) and in-phase (IP) echo times (1.23, 2.46, 3.69, 4.92, 6.15, and 7.38 ms). Other imaging parameters were: section thickness of 2 mm, 100% intersection gap, 1090 Hz/pixel receiver bandwidth, one signal acquired, and rectangular field of view with a 78 × 96 matrix. We used a 10 × 10 × 10 mm voxel for MRI to measure the signal intensity on OP and IP images. T2* map, water image, fat image, and fat fraction (FF) map were derived from the multiecho-spoiled gradient echo sequence by using pixel-by-pixel image calculations for each section.
For MRS, high-speed T2-corrected multiecho proton MRS technique was also used using the WIP of Siemens Medical System. A single 10 × 10 × 10 mm voxel was placed in a right hepatic segment while avoiding vascular and biliary structures. After shimming, stimulated echo acquisition mode single voxel proton spectroscopy was performed. The repetition time was 3000 ms to minimize T1 effects. To estimate T2, five single-average spectra were collected at echo times of 12, 24, 36, 48, and 72 ms with 1200 Hz receiver bandwidth and 2048-point spectral resolution. Fat signal fraction (%) was determined with MRS.
Data were processed by a research fellow under direct supervision of an experienced abdominal radiologist and MR physicist (10 years of experience) who was blinded to the study results. FF of the liver was obtained from MRI images. One radiologist reviewed the image by manually placing a circular ROI of approximately 0.5–1.0 cm2, the same area used in MRS (excluding blood vessels, bile ducts structures). The FF from MRS was automatically propagated to PACS.
Histopathologic Examinations
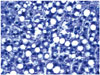
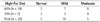
All rats were sacrificed for histopathological and biochemical assessment of the liver. Five samples of the right lateral lobe were excised from all livers. Sample sizes were similar (100–150 mg). Each specimen was frozen at −80℃ and stained with hematoxylin-eosin with original magnification of × 400. No separate staining for iron was performed. Fibrosis was not assessed. Grading of the fatty liver was based on quantitative evaluation of the percentage of hepatocytes containing macrovesicular fat (0–100%) using image analysis software (iSolution FL/Auto, Burnaby, Canada). Grading results were expressed as the percentage of cells affected by a fatty liver as follows: “none” (≤ 5%), “mild” (> 5% but < 33%), “moderate” (≥ 33% but < 66), and “severe” (≥ 66%) (Fig. 3) (35). For hepatic triglyceride (TG), approximately 100 mg of rat liver tissue samples were homogenized in 2 mL of chloroform-methanol solution (2:1 v/v) followed by centrifugation at 3000 rpm for 10 minute. Hepatic TG value was acquired by TG colorimetric assay kit (10010301; Cayman Chemical, Ann Arbor, MI, USA) on a plate reader (Infinite M200 PRO, Tecan, Männedorf, Switzerland).
Statistical Analysis
Statistical analysis was performed using SPSS v.16.0 software (IBM, Chicago, IL, USA). Means ± standard deviations were calculated for descriptive data. A two-sample t test was used to compare two independent mean values. Pearson correlation test was used to assess the linear correlation among histologic steatosis grade, intra-hepatocellular TG content, HRI of US, HUS of SECT, HUD of DECT, and FF of MRI and MRS. A coefficient of 0.25 or less was considered as “low” correlation. A coefficient of 0.26–0.50 was considered as “fair” correlation. A coefficient of 0.51–0.75 was considered as “good” correlation. A coefficient of greater than 0.75 was considered as “excellent” correlation. Receiver operating characteristic (ROC) curves were created. Optimal cut-off points were estimated for the diagnosis of a fatty liver (> 5%). Sensitivity and specificity were estimated for the diagnosis of fatty liver. A p value of less than 0.05 was considered as statistically significant. All tests were two-tailed.
RESULTS
Histopathologic Examination of the Rat Model
Based on histopathologic examination, five rats had no fatty liver, 10 rats had mild fatty liver, and five rats had moderate fatty liver. Of the five rats with nonfatty liver, three were fed the 60% high-fat diet and two were fed the 10% high-fat diet (Table 2).
US Examination
There was no significant (p = 0.736) difference in renal echogenicity between the two groups (Table 3). However, hepatic echogenicity in the fatty liver group was significantly (p = 0.036) higher than that in the nonfatty liver group. The mean HRI value in the fatty liver group was significantly (p = 0.004) higher than that in the nonfatty liver group.
CT Examination
On SECT, the mean attenuation value of the liver in the fatty liver group was significantly (p = 0.001) lower than that in the nonfatty liver group. The mean value of HUS in the fatty liver group was significantly (p = 0.001) lower than that in the nonfatty liver group (Table 3). On DECT, the difference between HU of 140 kVp and 80 kVp was significant (p = 0.009). The mean value of hepatic HU in the fatty liver group was significantly (p = 0.004) lower than that in the nonfatty liver group.
MRI and MRS
On MRI, the mean values of liver FF measured in the nonfatty liver group and the fatty liver group were 5.7 ± 0.8% and 11.2 ± 3.7%, respectively (p = 0.005). MRS showed that the mean FF values of the nonfatty liver group and fatty liver group were 4.9 ± 0.6%, and 12.1 ± 4.0%, respectively (p = 0.001) (Table 3).
Correlations
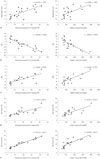
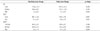
Results of correlation between imaging techniques and histopathologic examination are summarized in Table 4. Fig. 1 graphically shows these correlations. The US findings showed good correlation with histologic steatosis grades (r = 0.744, p < 0.001) and TG levels (r = 0.588, p = 0.006). The SECT, DECT, MRI, and MRS findings had excellent correlation with histologic steatosis grades (r = −0.867, 0.775, 0.869, and 0.916, respectively) and TG levels (r = −0.780, 0.765, 0.767, and 0.910, respectively). The MRS showed a higher correlation with histologic steatosis grades and TG levels compared to other examinations.
Diagnostic Accuracy
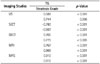
The diagnostic performance in the diagnosis of fatty liver was calculated for the five imaging modalities. Results are summarized in Table 5. We performed ROC curve fitting for US, SECT, DECT, MRI, and MRS. From the ROC curves, we determined the cut-off value for each imaging modality. These cut-off values were used to calculate diagnostic accuracy (Table 5). MRS and SECT had the highest AUC (0.960), indicating the best acceptable diagnostic performance. The AUC of US was the lowest (0.893). The AUC was 0.947 for DECT and 0.933 for MRI. DECT had the highest sensitivity (100%) while US and SECT had the lowest sensitivity (80%). Specificity was the highest for MRI and MRS (100%) but the lowest for DECT (60%).
DISCUSSION
Our study evaluated five up-to-date imaging modalities for the diagnosis of fatty liver in rat model. Our results demonstrated that MRS had higher correlation with histopathologic findings and yielded greater diagnostic accuracy for the diagnosis of fatty liver than other modalities. MRI and MRS allowed objective assessment of fatty liver with the highest specificity.
In our study, the diagnostic performance of US was relatively lower than that of other imaging modalities. The cut-off HRI value of 1.33 on US had relatively low sensitivity and specificity (both 80%). Previous studies have reported a wide range of HRI for predicting a hepatic steatosis grade greater than 5% (172324), suggesting that HRI is useful for screening fatty liver. However, it is based on subjective impression of “bright liver echo” pattern (363738). Although US is a cost-effective imaging technique for the diagnosis of fatty liver in clinical practice, poor echoic screening can affect the accuracy of fatty liver quantification (12).
SECT and DECT showed stronger correlation with the reference standard and yielded higher diagnostic accuracy than US in our study. The cut-off HUS value of 0 HU on SECT showed sensitivity and specificity of 80% each. Previously, a threshold cut-off HUS value of 3.2 has a sensitivity of 72.7% and a specificity of 91.3% (26), and a threshold cut-off HU value of -9 has a sensitivity of 82% and a specificity of 100% in detecting moderate degree of fatty liver (25). We found similar sensitivity. However, the specificity in this study was relatively lower than those in previous studies due to the relatively lower cut-off value used in this study.
DECT scanners require less effort because two image datasets are acquired in the same anatomic location with two different X-ray spectra which allow the analysis of energy-dependent changes in the attenuation of different materials from soft tissues (13). When scanned with different energy (140 and 80 kVp), fatty livers have shown greater changes in attenuation than normal livers (21). In our study, the ability of DECT to quantify a fatty liver and using a threshold cut-off HUD value of 2.5 for diagnosing fatty liver had a high sensitivity (100%) but relatively low specificity (60%). However, the theoretical advantage of DECT has not yet been established clinically. Similar to other studies (1339), the diagnostic performance of DECT was relatively lower than that of SECT in this study.
The threshold values of CT indices for the diagnosis of fatty liver also varied depending on the methods and populations used. Although the accuracy of CT in diagnosing fatty liver varied, CT was quite accurate for the diagnosis of moderate-to-severe fatty liver. However, CT was not as accurate for detecting mild fatty liver. Although its advantages include low cost, wide usage, and short examination time, it is impractical for routine follow-up use due to radiation exposure. Another limitation of CT is its low accuracy for early-stage fatty liver compared to MR techniques (11). Moreover, its sensitivity and specificity will decrease when diffuse iron deposition exists (25).
In our study, the correlation was stronger when MRI was used rather than US or CT. The sensitivity and specificity of MRI for detecting mild fatty liver have been reported to be 76.7–90.0% and 87.1–91%, respectively, while those of MRS are 80.0–91.0% and 80.2–87.0%, respectively (1826). Although the sensitivity and specificity of MRI and MRS in our study were similar to those reported earlier, MRS yielded higher diagnostic accuracy in this study. However, MRI is more practical than MRS as it can cover the entire liver. Technical optimization of MRS and MRI may result in more accurate and unbiased hepatic fat quantification (40).
MRS detected fatty liver with high sensitivity (93.3%) and specificity (100.0%) in this study. These values were higher for MRS in previous reports. The highest AUC value was 0.960 for both SECT and MRS. However, the correlation between SECT and histopathologic examination was significantly lower than that between MRS and histopathologic examination. Wu et al. (16) have reported that MRS has high sensitivity (92.9%) and high specificity (82.6%) in detecting a fatty liver. Van Werven et al. (18) have found that MRS results are strongly correlated with histopathologic assessment and superior to US or SECT. MRS is the best noninvasive technique for fatty liver detection. It is increasingly replacing liver biopsy as the reference standard (10152024). Multi-echo MRS techniques are typically performed within a single breath-hold with five single averaged spectra acquired at five different echo times. Our study used the same technique.
Our study had several limitations. First, our animal model did not have severe fatty liver. Mild fatty liver was the most common kind. However, our results proved the diagnostic performance of these modalities for distinguishing normal liver from mild fatty livers. Second, we did not consider the effect of microvesicular fatty liver on the diagnostic performance of these imaging techniques because macrovesicular fatty liver is clinically more relevant as a risk factor in liver surgery and transplantation (18). Third, because small sample size was used, there was no statistical comparison for imaging or spectroscopic values for sensitivity and specificity. However, we performed ROC curve analysis to assess test accuracy. Fourth, the rat model used in our study may not accurately represent liver disease in humans. Since such testing is impossible in humans owing to the small size of biopsy sample to avoid substantial biohazards, an animal model enabled more extensive and thorough testing than what is possible in humans. We used large sample sizes and tested the entire liver to represent a true mass FF across the entire liver.
In conclusion, compared to US, SECT, DECT, and MRI, MRS is a more precise modality with higher accuracy for evaluating a fatty liver in rat model. MRS is currently the most accurate imaging method for diagnosing fatty liver, although both MRS and MRI are very reproducible and accurate in quantifying hepatic fat. They might replace liver biopsy.

 XML Download