

 PDF
PDF ePub
ePub Citation
 Print
Print


Abstract
Renal cell carcinoma (RCC) consists of approximately 85–90% of renal masses, and its incidence is increasing due to widespread use of modern imaging modalities such as ultrasonography or computed tomography. Computed tomography has served an important role in the diagnosis and staging of RCC; however, recent advances in magnetic resonance imaging (MRI) techniques have considerably improved our ability to predict tumor biology beyond the morphologic assessment. Multiparametric MRI protocols include standard sequences tailored for the morphologic evaluation and acquisitions that provide information about the tumor microenvironment such as diffusion-weighted imaging and dynamic contrast-enhanced MRI. The role of multiparametric MRI in the evaluation of RCC now extends to preoperative characterization of RCC subtypes, histologic grade, and quantitative assessment of tumor response to targeted therapies in patients with metastatic disease. Herein, the clinical applications and recent advances in MRI applied to RCC are reviewed along with its merits and demerits. We aimed to review MRI techniques and image analysis that can improve the management of patients with RCC. Familiarity with the advanced MRI techniques and various imaging findings of RCC would also facilitate optimal clinical recommendations for patients.
Figures and Tables
Fig. 1
61-year-old woman with clear cell renal cell carcinoma in right kidney.
A. On T2-weighted MR image, the tumor (arrow) in right kidney shows heterogeneous hyperintensity, as compared to the normal cortex.
B. Fat-suppressed axial T1-weighted image shows the tumor (arrow) as slightly hypointense.
C, D. Contrast-enhanced fat-suppressed axial T1-weighted images show heterogeneous enhancement in the tumor (arrow) at corticomedullary phase (C) and wash-out in the tumor at nephrographic phase (D).
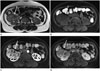
Fig. 2
56-year-old man with papillary cell renal cell carcinoma in right kidney.
A. Axial T2-weighted image shows a small hypointense tumor (arrow) in right kidney.
B. Fat-suppressed axial T1-weighted image also shows the tumor (arrow) as isointense.
C. Contrast-enhanced fat-suppressed axial T1-weighted image shows poor enhancement in the tumor (arrow) at corticomedullary phase.
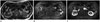
Fig. 3
76-year-old woman with angiomyolipoma in left kidney.
A. On T2-weighted MR image, the tumor (arrow) in left kidney shows hypointensity, as compared to the normal cortex.
B. Fat-suppressed axial T1-weighted image also shows the tumor (arrow) as isointense.
C. Contrast-enhanced fat-suppressed axial T1-weighted image shows heterogeneous enhancement in the tumor at corticomedullary phase.
D. Diffusion-weighted image acquired at b = 800 sec/mm2 shows the tumor (arrow) as slightly hyperintense.
E. Apparent diffusion coefficient map shows obvious diffusion restriction in the tumor (arrow).
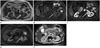
Fig. 4
44-year-old woman with angiomyolipoma in right kidney.
A, B. In-phase MR image (A) shows the tumor (arrow) as slightly hyperintense and out-of-phase MR image (B) shows obvious signal intensity drop in the tumor (arrow).
C. Fat-suppressed axial T1-weighted image shows the tumor (arrow) as hypointense.
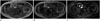
Fig. 5
82-year-old man with clear cell renal cell carcinoma in left kidney.
A. Axial T2-weighted image shows a heterogeneously hyperintense tumor (arrow) in left kidney.
B. Contrast-enhanced fat-suppressed axial T1-weighted image shows a heterogeneously enhancing tumor (arrow) in left kidney at corticomedullary phase.
C, D. In-phase MR image (C) shows the tumor (arrow) as isointense and out-of-phase MR image (D) shows focal signal intensity drop (arrow) in the tumor.
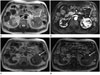
Fig. 6
71-year-old woman with chromophobe renal cell carcinoma in left kidney.
A. Axial T2-weighted image shows a small and heterogeneously hypointense tumor (arrow) in left kidney.
B. Fat-suppressed axial T1-weighted image shows the tumor (arrow) as isointense.
C. Contrast-enhanced fat-suppressed axial T1-weighted image shows poor enhancement in the tumor (arrow) at corticomedullary phase.
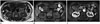
Fig. 7
47-year-old woman with clear cell renal cell carcinoma in left kidney.
A. Axial T2-weighted image shows a heterogeneously hyperintense tumor in left kidney.
B. Contrast-enhanced fat-suppressed axial T1-weighted image shows heterogeneous enhancement in the tumor at corticomedullary phase.
C. Diffusion-weighted image acquired at b = 800 sec/mm2 shows the tumor (arrow) as heterogeneously hyperintense.
D. Apparent diffusion coefficient map shows obvious diffusion restriction in the tumor (arrow).
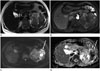
Fig. 8
71-year-old man with papillary cell renal cell carcinoma in right kidney.
A. On T2-weighted MR image, the tumor (arrow) in right kidney shows hypointensity, as compared to the normal cortex.
B. Contrast-enhanced fat-suppressed axial T1-weighted image shows poor enhancement in the tumor (arrow) at corticomedullary phase.
C. Diffusion-weighted image acquired at b = 800 sec/mm2 shows the tumor (arrow) as hyperintense.
D. Apparent diffusion coefficient map shows diffusion restriction in the tumor (arrow).
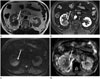
Fig. 9
42-year-old woman with Fuhrman grade II clear cell renal cell carcinoma in left kidney and 66-year-old man with Fuhrman grade IV clear cell renal cell carcinoma in left kidney.
A, B. The tumor (arrows) confirmed as Fuhrman grade II clear cell renal cell carcinoma shows subtle hyperintensity on diffusion-weighted image acquired at b = 800 sec/mm2 (A) and diffusion restriction on apparent diffusion coefficient map (B). The calculated apparent diffusion coefficient value of the Fuhrman grade II clear cell renal cell carcinoma is 1.15 × 10⁻³ mm2/sec.
C, D. The tumor (arrows) confirmed as Fuhrman grade IV clear cell renal cell carcinoma shows heterogeneous hyperintensity on diffusion-weighted image acquired at b = 800 sec/mm2 (C) and prominent diffusion restriction on apparent diffusion coefficient map (D). The calculated apparent diffusion coefficient value of the Fuhrman grade IV clear cell renal cell carcinoma is 0.91 × 10⁻³ mm2/sec.
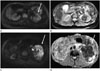
Fig. 10
48-year-old man with clear cell renal cell carcinoma in left kidney.
A. Coronal T2-weighted image shows a heterogeneously hyperintense tumor in left kidney with thrombus (arrow) in left renal vein.
B. Contrast-enhanced fat-suppressed coronal T1-weighted image shows heterogeneous enhancement in the thrombus (arrow) in left renal vein.
The enhancing thrombus was confirmed as tumor thrombus at surgery.
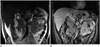
Fig. 11
54-year-old man with clear cell renal cell carcinoma treated initially by renal cryoablation.
A, B. Two years after cryoablation, the treated tumor (arrows) shows hypointensity on axial T2-weighted image (A) and no enhancement on contrast-enhanced axial T1-weighted image (B).
C, D. Four years after cryoablation, a focal and subtle hyperintensity (arrow) is newly seen at the treated tumor on axial T2-weighted image (C), and a distinct nodular enhancement (arrow) is demonstrated at the newly developed, focal hyperintensity on contrast-enhanced fat-suppressed axial T1-weighted image (D). The nodular enhancement was confirmed as recurred clear cell renal cell carcinoma, which was treated again by radiofrequency ablation.
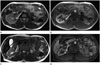
Fig. 12
54-year-old woman with tuberous sclerosis and clear cell renal cell carcinoma treated initially by radical nephrectomy.
A. Contrast-enhanced axial CT image shows a heterogeneously enhancing mass suggesting tumor recurrence at previous left nephrectomy site.
B, C. Three months after targeted therapy with antiangiogenetic agent, the recurred tumor shows heterogeneous hyperintensity on fat-suppressed axial T1-weighted image (B) and poor enhancement on contrast-enhanced fat-suppressed axial T1-weighted image (C). Angiomyolipoma showing heterogeneous enhancement is seen in upper pole of right kidney.
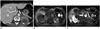
Table 1
TNM Classification for Renal Cell Carcinoma (UICC/AJCC, 2010)
References
1. Jemal A, Siegel R, Xu J, Ward E. Cancer statistics, 2010. CA Cancer J Clin. 2010; 60:277–300.
2. Sacco E, Pinto F, Totaro A, D'Addessi A, Racioppi M, Gulino G, et al. Imaging of renal cell carcinoma: state of the art and recent advances. Urol Int. 2011; 86:125–139.
3. Heilbrun ME, Casalino DD, Beland MD, Bishoff JT, Blaufox MD, Coursey CA, et al. ACR Appropriateness Criteria® indeterminate renal mass [online publication]. Reston, VA: American College of Radiology;2014. p. 11.
4. Willatt JM, Hussain HK, Chong S, Kappil M, Azar SF, Liu PS, et al. MR imaging in the characterization of small renal masses. Abdom Imaging. 2014; 39:761–769.
5. Nakayama Y, Yamashita Y, Matsuno Y, Tang Y, Namimoto T, Kadota M, et al. Fast breath-hold T2-weighted MRI of the kidney by means of half-Fourier single-shot turbo spin echo: comparison with high resolution turbo spin echo sequence. J Comput Assist Tomogr. 2001; 25:55–60.
6. Chung MS, Choi HJ, Kim MH, Cho KS. Comparison of T2-weighted MRI with and without fat suppression for differentiating renal angiomyolipomas without visible fat from other renal tumors. AJR Am J Roentgenol. 2014; 202:765–771.
7. Campbell N, Rosenkrantz AB, Pedrosa I. MRI phenotype in renal cancer: is it clinically relevant. Top Magn Reson Imaging. 2014; 23:95–115.
8. Pedrosa I, Sun MR, Spencer M, Genega EM, Olumi AF, Dewolf WC, et al. MR imaging of renal masses: correlation with findings at surgery and pathologic analysis. Radiographics. 2008; 28:985–1003.
9. Israel GM, Bosniak MA. Pitfalls in renal mass evaluation and how to avoid them. Radiographics. 2008; 28:1325–1338.
10. Rosenkrantz AB, Hindman N, Fitzgerald EF, Niver BE, Melamed J, Babb JS. MRI features of renal oncocytoma and chromophobe renal cell carcinoma. AJR Am J Roentgenol. 2010; 195:W421–W427.
11. de Leon AD, Costa D, Pedrosa I. Role of multiparametric MR imaging in malignancies of the urogenital tract. Magn Reson Imaging Clin N Am. 2016; 24:187–204.
12. Israel GM, Hindman N, Hecht E, Krinsky G. The use of opposed-phase chemical shift MRI in the diagnosis of renal angiomyolipomas. AJR Am J Roentgenol. 2005; 184:1868–1872.
13. Hindman N, Ngo L, Genega EM, Melamed J, Wei J, Braza JM, et al. Angiomyolipoma with minimal fat: can it be differentiated from clear cell renal cell carcinoma by using standard MR techniques? Radiology. 2012; 265:468–477.
14. Cornelis F, Tricaud E, Lasserre AS, Petitpierre F, Bernhard JC, Le Bras Y, et al. Routinely performed multiparametric magnetic resonance imaging helps to differentiate common subtypes of renal tumours. Eur Radiol. 2014; 24:1068–1080.
15. Sasiwimonphan K, Takahashi N, Leibovich BC, Carter RE, Atwell TD, Kawashima A. Small (<4 cm) renal mass: differentiation of angiomyolipoma without visible fat from renal cell carcinoma utilizing MR imaging. Radiology. 2012; 263:160–168.
16. Jinzaki M, Silverman SG, Akita H, Nagashima Y, Mikami S, Oya M. Renal angiomyolipoma: a radiological classification and update on recent developments in diagnosis and management. Abdom Imaging. 2014; 39:588–604.
17. Kim BS, Angthong W, Jeon YH, Semelka RC. Body MR imaging: fast, efficient, and comprehensive. Radiol Clin North Am. 2014; 52:623–636.
18. Ho VB, Allen SF, Hood MN, Choyke PL. Renal masses: quantitative assessment of enhancement with dynamic MR imaging. Radiology. 2002; 224:695–700.
19. Schieda N, Al-Subhi M, Flood TA, El-Khodary M, McInnes MD. Diagnostic accuracy of segmental enhancement inversion for the diagnosis of renal oncocytoma using biphasic computed tomography (CT) and multiphase contrast-enhanced magnetic resonance imaging (MRI). Eur Radiol. 2014; 24:2787–2794.
20. ACR Committee on Drugs and Contrast Media. ACR manual on contrast media, version 10.1 2015. Accessed December 23, 2015. Available at: http://www.acr.org/Quality-Safety/Resources/Contrast-Manual.
21. Schieda N, Al-Dandan O, El-Khodary M, Shabana W. Low b-value (black blood) respiratory-triggered fat-suppressed single-shot spin-echo echo-planar imaging (EPI) of the liver: comparison of image quality at 1.5 and 3 T. Clin Radiol. 2014; 69:1136–1141.
22. Choi JS, Kim MJ, Chung YE, Kim KA, Choi JY, Lim JS, et al. Comparison of breathhold, navigator-triggered, and free-breathing diffusion-weighted MRI for focal hepatic lesions. J Magn Reson Imaging. 2013; 38:109–118.
23. Kandpal H, Sharma R, Madhusudhan KS, Kapoor KS. Respiratory-triggered versus breath-hold diffusion-weighted MRI of liver lesions: comparison of image quality and apparent diffusion coefficient values. AJR Am J Roentgenol. 2009; 192:915–922.
24. Lassel EA, Rao R, Schwenke C, Schoenberg SO, Michaely HJ. Diffusion-weighted imaging of focal renal lesions: a meta-analysis. Eur Radiol. 2014; 24:241–249.
25. Agnello F, Roy C, Bazille G, Galia M, Midiri M, Charles T, et al. Small solid renal masses: characterization by diffusion-weighted MRI at 3 T. Clin Radiol. 2013; 68:e301–e308.
26. Verswijvel G, Vandecaveye V, Gelin G, Vandevenne J, Grieten M, Horvath M, et al. Diffusion-weighted MR imaging in the evaluation of renal infection: preliminary results. JBR-BT. 2002; 85:100–103.
27. Wang H, Cheng L, Zhang X, Wang D, Guo A, Gao Y, et al. Renal cell carcinoma: diffusion-weighted MR imaging for subtype differentiation at 3.0 T. Radiology. 2010; 257:135–143.
28. Taouli B, Thakur RK, Mannelli L, Babb JS, Kim S, Hecht EM, et al. Renal lesions: characterization with diffusion-weighted imaging versus contrast-enhanced MR imaging. Radiology. 2009; 251:398–407.
29. Sandrasegaran K, Sundaram CP, Ramaswamy R, Akisik FM, Rydberg MP, Lin C, et al. Usefulness of diffusion-weighted imaging in the evaluation of renal masses. AJR Am J Roentgenol. 2010; 194:438–445.
30. Paudyal B, Paudyal P, Tsushima Y, Oriuchi N, Amanuma M, Miyazaki M, et al. The role of the ADC value in the characterisation of renal carcinoma by diffusion-weighted MRI. Br J Radiol. 2010; 83:336–343.
31. Lanzman RS, Robson PM, Sun MR, Patel AD, Mentore K, Wagner AA, et al. Arterial spin-labeling MR imaging of renal masses: correlation with histopathologic findings. Radiology. 2012; 265:799–808.
32. Chandarana H, Amarosa A, Huang WC, Kang SK, Taneja S, Melamed J, et al. High temporal resolution 3D gadolinium-enhanced dynamic MR imaging of renal tumors with pharmacokinetic modeling: preliminary observations. J Magn Reson Imaging. 2013; 38:802–808.
33. Ergen FB, Hussain HK, Caoili EM, Korobkin M, Carlos RC, Weadock WJ, et al. MRI for preoperative staging of renal cell carcinoma using the 1997 TNM classification: comparison with surgical and pathologic staging. AJR Am J Roentgenol. 2004; 182:217–225.
34. Roy C Sr, El Ghali S, Buy X, Lindner V, Lang H, Saussine C, et al. Significance of the pseudocapsule on MRI of renal neoplasms and its potential application for local staging: a retrospective study. AJR Am J Roentgenol. 2005; 184:113–120.
35. Kamel IR, Hochman MG, Keogan MT, Eng J, Longmaid HE 3rd, DeWolf W, et al. Accuracy of breath-hold magnetic resonance imaging in preoperative staging of organ-confined renal cell carcinoma. J Comput Assist Tomogr. 2004; 28:327–332.
36. Laissy JP, Menegazzo D, Debray MP, Toublanc M, Ravery V, Dumont E, et al. Renal carcinoma: diagnosis of venous invasion with Gd-enhanced MR venography. Eur Radiol. 2000; 10:1138–1143.
37. Lawrentschuk N, Gani J, Riordan R, Esler S, Bolton DM. Multidetector computed tomography vs magnetic resonance imaging for defining the upper limit of tumour thrombus in renal cell carcinoma: a study and review. BJU Int. 2005; 96:291–295.
38. Hallscheidt PJ, Fink C, Haferkamp A, Bock M, Luburic A, Zuna I, et al. Preoperative staging of renal cell carcinoma with inferior vena cava thrombus using multidetector CT and MRI: prospective study with histopathological correlation. J Comput Assist Tomogr. 2005; 29:64–68.
39. Karlo CA, Di Paolo PL, Donati OF, Russo P, Tickoo S, Hricak H, et al. Renal cell carcinoma: role of MR imaging in the assessment of muscular venous branch invasion. Radiology. 2013; 267:454–459.
40. Will O, Purkayastha S, Chan C, Athanasiou T, Darzi AW, Gedroyc W, et al. Diagnostic precision of nanoparticle-enhanced MRI for lymph-node metastases: a meta-analysis. Lancet Oncol. 2006; 7:52–60.
41. Griffin N, Gore ME, Sohaib SA. Imaging in metastatic renal cell carcinoma. AJR Am J Roentgenol. 2007; 189:360–370.
42. Merkle EM, Nour SG, Lewin JS. MR imaging follow-up after percutaneous radiofrequency ablation of renal cell carcinoma: findings in 18 patients during first 6 months. Radiology. 2005; 235:1065–1071.
43. Boss A, Clasen S, Kuczyk M, Anastasiadis A, Schmidt D, Graf H, et al. Magnetic resonance-guided percutaneous radiofrequency ablation of renal cell carcinomas: a pilot clinical study. Invest Radiol. 2005; 40:583–590.
44. Iannuccilli JD, Grand DJ, Dupuy DE, Mayo-Smith WW. Percutaneous ablation for small renal masses-imaging follow-up. Semin Intervent Radiol. 2014; 31:50–63.
45. Silverman SG, Tuncali K, Morrison PR. MR Imaging-guided percutaneous tumor ablation. Acad Radiol. 2005; 12:1100–1109.
46. Gill IS, Novick AC, Meraney AM, Chen RN, Hobart MG, Sung GT, et al. Laparoscopic renal cryoablation in 32 patients. Urology. 2000; 56:748–753.
47. Gill IS, Remer EM, Hasan WA, Strzempkowski B, Spaliviero M, Steinberg AP, et al. Renal cryoablation: outcome at 3 years. J Urol. 2005; 173:1903–1907.
48. Wile GE, Leyendecker JR, Krehbiel KA, Dyer RB, Zagoria RJ. CT and MR imaging after imaging-guided thermal ablation of renal neoplasms. Radiographics. 2007; 27:325–339. discussion 339-340.
49. Kawamoto S, Permpongkosol S, Bluemke DA, Fishman EK, Solomon SB. Sequential changes after radiofrequency ablation and cryoablation of renal neoplasms: role of CT and MR imaging. Radiographics. 2007; 27:343–355.
50. Ganguli S, Brennan DD, Faintuch S, Rayan ME, Goldberg SN. Immediate renal tumor involution after radiofrequency thermal ablation. J Vasc Interv Radiol. 2008; 19:412–418.
51. Allen BC, Remer EM. Percutaneous cryoablation of renal tumors: patient selection, technique, and postprocedural imaging. Radiographics. 2010; 30:887–900.
52. Kawamoto S, Solomon SB, Bluemke DA, Fishman EK. Computed tomography and magnetic resonance imaging appearance of renal neoplasms after radiofrequency ablation and cryoablation. Semin Ultrasound CT MR. 2009; 30:67–77.
53. Kang HC, Tan KS, Keefe SM, Heitjan DF, Siegelman ES, Flaherty KT, et al. MRI assessment of early tumor response in metastatic renal cell carcinoma patients treated with sora-fenib. AJR Am J Roentgenol. 2013; 200:120–126.
54. Smith AD, Shah SN, Rini BI, Lieber ML, Remer EM. Morphology, Attenuation, Size, and Structure (MASS) criteria: assessing response and predicting clinical outcome in metastatic renal cell carcinoma on antiangiogenic targeted therapy. AJR Am J Roentgenol. 2010; 194:1470–1478.
55. Hahn OM, Yang C, Medved M, Karczmar G, Kistner E, Karrison T, et al. Dynamic contrast-enhanced magnetic resonance imaging pharmacodynamic biomarker study of sora-fenib in metastatic renal carcinoma. J Clin Oncol. 2008; 26:4572–4578.
56. Rosen MA, Schnall MD. Dynamic contrast-enhanced magnetic resonance imaging for assessing tumor vascularity and vascular effects of targeted therapies in renal cell carcinoma. Clin Cancer Res. 2007; 13(2 Pt 2):770s–776s.
57. Flaherty KT, Rosen MA, Heitjan DF, Gallagher ML, Schwartz B, Schnall MD, et al. Pilot study of DCE-MRI to predict progression-free survival with sorafenib therapy in renal cell carcinoma. Cancer Biol Ther. 2008; 7:496–501.
58. Braunagel M, Graser A, Reiser M, Notohamiprodjo M. The role of functional imaging in the era of targeted therapy of renal cell carcinoma. World J Urol. 2014; 32:47–58.
59. Desar IM, ter Voert EG, Hambrock T, van Asten JJ, van Spronsen DJ, Mulders PF, et al. Functional MRI techniques demonstrate early vascular changes in renal cell cancer patients treated with sunitinib: a pilot study. Cancer Imaging. 2012; 11:259–265.
60. de Bazelaire C, Alsop DC, George D, Pedrosa I, Wang Y, Michaelson MD, et al. Magnetic resonance imaging-measured blood flow change after antiangiogenic therapy with PTK787/ZK 222584 correlates with clinical outcome in metastatic renal cell carcinoma. Clin Cancer Res. 2008; 14:5548–5554.
 XML Download