

 PDF
PDF ePub
ePub Citation
 Print
Print


INTRODUCTION
Normal lung tissues have a dual vascular supply system. The major vascular supply is via the pulmonary arteries (approximately 95%), while a minor vascular supply is mediated through various systemic arteries (bronchial, intercostal, internal thoracic, etc.) arising from the aorta (12). Angiogenesis is one of the important factors in the assessment of lung cancer, and it may have an influence on tumor growth and biology. Therefore, understanding the actual pattern of dual blood supply in lung cancer may provide additional information to design the therapeutic plan or predict the disease prognosis. Several investigators have attempted to evaluate the perfusion of lung tumors, with some researchers assuming that perfusion via bronchial arteries and the aorta was the single-input function, and others defining perfusion via the pulmonary artery as the single-input function (3456). However, the dual supply of lung tumors has not yet been fully established and remains controversial. Recent advances in computed tomography (CT) technology, including the development of a 320-detector-row CT, have provided the largest z-axis coverage (16 cm), thus allowing it to simultaneously capture the pulmonary (pulmonary artery) and systemic circulation (thoracic aorta) input functions with lung tumors in one gantry rotation without table movement (7). Yuan et al. (78) recently published a study of dual-input perfusion CT using a 320-detector-row CT, and assumed that the perfusion parameters, especially the 'perfusion index' (PI), which was calculated using the values of pulmonary arterial perfusion (PP) and aortic perfusion (AP), may be potentially valuable biomarkers for identifying malignancies in pulmonary nodules. Our hypothesis was that the dual blood supply of lung cancer may differ according to the tumor size or location, as well as according to the potential for malignancy. Therefore, the purpose of our study was to assess the dual blood supply of lung cancer using a CT perfusion technique, and to analyze the correlations between dual perfusion and various characteristics of lung cancer.
MATERIALS AND METHODS
Patients
This study included 35 consecutive patients (22 males and 13 females; age range, 53–87 years; mean age, 71 ± 6.3 years) with a pulmonary nodule/mass highly suggestive of lung cancer. Exclusion criteria included a small (< 1.0 cm in diameter on axial image) pulmonary nodule, a ground-glass nodule, a nodule located at the lung apex, the presence of mediastinal invasion by the tumor, primary malignancy in another organ, medication therapy for the treatment of a lung tumor, radiation therapy to the thorax for any reason (including breast cancer), a history of allergic reaction to the contrast material, and renal insufficiency. All subjects underwent a CT-guided aspiration biopsy after a dynamic perfusion CT study for pathologic confirmation. Our local ethics committee approved this study, and written informed consent for the CT procedure and for the research protocol was obtained from each patient after providing a thorough explanation.
Dynamic Perfusion CT Protocol
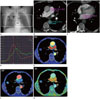
All subjects underwent dynamic perfusion CT with a 320-detector-row scanner (Aquilion ONE, Toshiba Medical Systems, Otawara, Japan). An initial low-dose unenhanced CT data acquisition was performed to determine the location of the pulmonary nodule. After the tumor location was identified, the z-axis coverage (range, 10–16 cm) for dynamic perfusion CT was determined to include both the main pulmonary artery and the left atrium (Fig. 1A). Before starting the perfusion CT scan, patients were taught to breathe quietly throughout the CT examination. With a dual-head power injector, 40 mL of nonionic contrast material (Iobitridol, Xenetix® 350 mgI/mL; Guerbet, France) was administered intravenously through 18-gauge intravenous catheters via the antecubital vein at 5 mL/s followed by a 20 mL saline flush at the same flow rate. Two seconds after the bolus injection, 18 intermittent volume acquisitions were performed at 2 second intervals with a fixed table and without breath holding.
The perfusion CT scan was performed with the following parameters: 320 × 0.5 mm collimation; 500 ms gantry rotation time; 80 kV tube voltage; 80 mA tube current; 0.5 mm slice thickness. All data sets were processed with iterative reconstruction [adaptive iterative dose reduction (AIDR) 3D] with 0.5 mm slice thickness and a 0.5 mm interval. Images were then transferred to commercial software (Vitrea 6.0, Vital images, Minnetonka, MN, USA) for post-processing and analysis.
Post-Processing and Analysis
The volume registration was performed with commercial software (Body perfusion, dual-input maximum slope analysis, Vitrea 6.0, Vital images, Minnetonka, MN, USA) to correct for respiratory motion and to create registered volume series. The registered volume series were loaded into the perfusion analysis tool. Elliptical regions of interest (ROI) were manually placed in the pulmonary trunk, the descending aorta, and the left atrium to generate a time-density curve (TDC), with the pulmonary trunk representing the pulmonary arterial input function and the descending thoracic aorta representing the systemic arterial input function, respectively (Fig. 1B, C). The TDC (Fig. 1D) of the left atrium was used to differentiate the pulmonary circulation, such that pulmonary circulation was regarded as the before-peak time point, and the systemic circulation was regarded as the after-peak time point (7). A freehand ROI was drawn around the lung tumor to generate the TDC of the contrast medium's first-pass attenuation in the lung nodule, and the Hounsfield unit (HU), area (mm2), PP, AP, and PI were automatically calculated (Fig. 1E-G) using the dual-input maximum slop method (8) according to following equation: PP (mL/min/100 mL) = max slop (start point to LA peak time)/max HU of pulmonary artery curve, AP (mL/min/100 mL) = max slop [(LA peak time to end point)/max HU of aorta curve, PI (%) = PP / (PP + AP)]. All ROIs were carefully drawn using the mediastinum window, and vascular structures or air-filled components were avoided. For each lesion, measurements were repeated on all relevant 1 mm thickness reformatted axial planes without gap and then the mean value of each parameter was calculated to obtain the final value and the tumor volume was calculated by summation of each area on the axial plane. Each of the ROIs was drawn three times, and the median value was applied as the final value. All measurements were obtained by two experienced radiologists (E.J.K., J.Y.H.) in order to assess inter-observer variability.
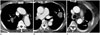
We divided lung tumors according to their location using CT images. Central location was defined as tumors abutting the proximal segmental bronchus with or without direct invasion. Peripheral location was defined as that between the central and pleural locations. Tumors abutting the pleural lesions were defined as tumors located in the peripheral subpleural area and broad based (more than half of the tumor diameter) at the pleura with or without invasion (Fig. 2). We investigated the presence of lymph node metastasis or organ metastasis in each patient by analyzing the results of various diagnostic modalities [CT, positron emission tomography (PET)-CT, bone scan, etc.] and medical records. On CT scans, enlarged mediastinal or lower neck lymph nodes more than 1 cm in the short axis diameter were regarded as suspicious for metastasis, and final confirmation was made according to the results of PET-CT. An experienced nuclear medicine physician (Y.J.J) read the PET-CT and bone scan, and lesions were regarded as lymph node metastasis or distant metastasis if their isotope uptake was higher than that of the mediastinal blood pool on visual assessment.
Estimation of Radiation Dose
CT data acquisition length, volume CT dose index, and dose length product (DLP) were displayed and recorded by the multidetector CT system. The effective doses (mSv) were calculated using a conversion coefficient for the chest [k = 0.014 mSv/(mGy·cm)] (9).
Statistics
We statistically analyzed the relationships between the perfusion parameters (PP, AP, PI) and tumor locations, tumor volumes, and lymph node and organ metastases. All estimated data (perfusion parameters) were expressed as means ± standard deviations. SPSS version 21.0 (SPSS Inc., Chicago, IL, USA) was used for statistical analyses. All analyses were performed with nonparametric methods because the number of subjects was insufficient for analysis with a parametric method. Bland-Altman method was used to analyze the interobserver agreement of tumor volume and each perfusion parameter. Correlations between the perfusion parameters and the tumor volume were analyzed using the Spearman's Rho (correlation coefficient), and scatter plots were used to demonstrate the data. Kruskal-Wallis test was used to analyze the statistical differences between the perfusion parameters and the tumor location (central, peripheral, and pleural). Mann-Whitney tests were used to compare lymph node metastasis or distant metastasis with the perfusion parameters. A p-value < 0.05 was considered statistically significant.
RESULTS
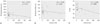
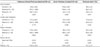
A total of 35 tumors from 35 patients were analyzed. All 35 lesions were pathologically diagnosed as primary lung cancers by the CT-guided aspiration biopsy, and they included 20 adenocarcinomas, 12 squamous cell carcinomas, two small cell carcinomas, and one pleomorphic carcinoma. Fifteen patients had lymph node metastasis, and 13 patients had distant metastasis in another organ. The interobserver agreements for tumor volume, mean PP, mean AP, and mean PI were good between the two observers in terms of CT analysis (intraclass correlation coefficient range: 0.899–0.999). The volume of the tumors analyzed from the CT data ranged from 1.2 to 305.2 mL (mean, 34.3 ± 58.6 mL). With respect to tumor locations, five of the 35 total lung tumors were categorized as central, 23 were categorized as peripheral, and seven were categorized as abutting the pleural lesions. The overall mean PP and AP were 136.9 ± 93.8 mL/min/100 mL and 104.0 ± 43.6 mL/min/100 mL, respectively. The mean PI was 53.7 ± 7.2%, and all data are summarized in Table 1. The PI showed a significant difference according to the tumor location (central, 49.2 ± 3.3%; peripheral, 56.2 ± 6.7%; abutting the pleural lesions, 48.9 ± 7.6%; p = 0.047), and other parameters (PP, AP) were not significantly different (p > 0.05) (Table 1). None of the values showed any significant differences according to the presence of lymph node metastasis or organ metastasis (p > 0.05). There was no significant correlation of the perfusion parameters with tumor volumes (p > 0.05) (Table 2, Fig. 3). Among the 23 patients who had peripheral lung tumors, lymph node metastasis and organ metastasis were observed in eight patients and six patients, respectively. There was no significant difference in the perfusion parameters according to the presence of lymph node metastasis or organ metastasis (p > 0.05) in peripheral lung tumors, and no significant correlations with tumor volumes were detected (Table 2).
The mean DLP of dynamic perfusion CT was 279.7 ± 44.6 mGy·cm, and the estimated effective dose was 3.9 ± 0.6 mSv (k = 0.014). The mean effective dose for the initial low-dose unenhanced CT was 2.9 ± 0.5 mSv.
DISCUSSION
Compared to the pulmonary arterial flow, the bronchial arterial flow represents a lower fraction in absolute terms in normal lung tissue. However, the bronchial flow is indispensable for supporting airway and lung function, and it tends to change more prominently and the vessels become more engorged under pathologic conditions, such as an inflammatory or cancerous state (10). Bronchial blood flow in lung cancer has been studied using bronchoangiography or postmortem arteriography (211).
Due to recent advances in CT technology, in vivo measurement of tissue perfusion (perfusion CT) has become possible. This imaging technique has been widely used in brain perfusion studies using a single-input artery (aorta). Several investigators have attempted to apply this technique to perfusion of lung tumors (3456), and most of them have used the maximum-slope method to assess the increase in maximum density of the thoracic aorta. However, the effect of the pulmonary artery as the input function was not considered.
The dual-input method of perfusion CT with the maximum slope analysis was originally applied to liver perfusion studies, and evaluations of the hepatic arterial and portal venous perfusions as color maps have been successful (121314). The abdominal aorta and the portal vein were selected as the dual-input vessels, and the peak time point of spleen enhancement was used to differentiate the hepatic circulation from the portal vein circulation. However, application of this method to lung tissue is difficult due to the very small (within several seconds) time differences between the pulmonary and bronchial circulations (15). Moreover, simultaneous assessment of dual input perfusion in lung tumors is difficult due to the limited coverage along the z-axis of CT systems, as the pulmonary artery, the aorta, the left atrium (used to differentiate the two circulations), and the tumor lesion should be included in a single temporal acquisition. Nakano et al. (15) investigated the feasibility of separately evaluating bronchial and pulmonary arterial perfusion of lung cancer using a single tube 128-detector CT scanner. They used the attenuation peak of tumor-free lung tissue instead of that of left atrium to divide the two circulations. They could not include the tumor which was located in the pulmonary apex or base because of insufficient z-axis length (3.8 cm). Yuan et al. (7) first reported about the dual blood supply in lung cancer using a 320 detector row CT scanner which provided 16 cm z-axis coverage. They reported that the PI showed a negative correlation with tumor size and it was significantly different between malignancy and benignancy (78).
Results of prior studies assessing the correlation between bronchial flow and tumor size are mixed, and therefore controversial. Studies using single-input perfusion (34) reported that tumors with a larger size showed significantly lower bronchial artery perfusion. Opposite results were obtained using dual-input perfusion, indicating that pulmonary perfusion correlated negatively with tumor size (815). This discrepancy is unsurprising and reasonable, as the pulmonary arterial flow may be included with the bronchial flow in single-input studies. Therefore, direct comparison of the results generated using each of these perfusion methods is not appropriate. In our study, the tumor volumes were not correlated with any perfusion parameters, and these results do not align with those from any prior studies. In our study, we speculate that there may be other factors affecting tumor perfusion, especially tumor location.
In 1976, Milne (2) evaluated the blood supply in 32 lung tumors from humans with postmortem arteriography and micro-arteriography. In his study, lung tumors were supplied by bronchial circulation; however, the pulmonary arterial component increased as the location of the tumor became more peripheral. This result has been reproduced by several researchers in perfusion CT studies (315). However, they did not analyze the pleural abutting tumors and their relationship with the dual blood supply. We speculated that the pattern of the dual blood supply in pleural abutting tumors would be different from that in peripherally located tumors completely surrounded by pulmonary parenchyma. In our study, the PI was higher in peripherally located tumors than in centrally located tumors or pleural tumors. This higher PI indicated that the pulmonary arterial perfusion was relatively higher than the systemic arterial perfusion. Therefore, these results demonstrated that the systemic arterial supply of centrally located cancers and pleural cancers is relatively higher than that of peripherally located cancers. We assumed that the systemic arterial supply of centrally located cancers was derived from the bronchial artery, and that of pleural cancers was derived from intercostal or phrenic arteries.
Li et al. (4) analyzed the first-pass tumor perfusion of 97 peripheral carcinomas with 64-detector CT, and they reported that tumors with distant metastasis showed significantly higher perfusion as compared to tumors without distant metastasis; however, there was no difference according to the presence or absence of nodal metastasis. In our study, perfusion values did not show any significant differences according to the presence of organ metastasis and lymph node metastasis. This discrepancy may be attributable to the different characteristics of the study subjects, as we included centrally located, peripherally located, and pleural tumors. Additionally, the number of subjects in the current study was relatively small. Findings from other published studies involving the pathologic analysis of tumor specimens demonstrated that microvessel counts were not correlated with lymph node metastases (1617). We speculate that the incidence of metastasis in lung cancer depends not only on tumor angiogenesis, but also on various other factors, such as pathologic type, or immunological or genetic differences.
We did not evaluate the perfusion parameters according to the pathologic type as the number of subjects in the current study was too small for such a statistical analysis. Several prior published studies, including both single- and double-input studies, revealed that perfusion values were not significantly different between the histological types (34 and 8).
Some limitations in our study deserve consideration. There are several published studies regarding dual-input dynamic lung perfusion CT (78 and 15). However, the validity of the perfusion measurements remains uncertain. To the best of our knowledge, there have been no studies demonstrating correlations between lung perfusion parameters and pathologic data. Second, various artifacts associated with CT technology, such as beam hardening, misregistration, or overlap of the two circulations, may have influenced the parameters of the dynamic perfusion CT. Third, radiation exposure is an inherent limitation of perfusion CT due to the number of CT volume exposures and wide coverage. In order to reduce radiation exposure, we reduced the tube voltage (kV) and current (mA) by using AIDR. Additionally, we chose a personalized scan range (10–16 cm) for each patient, taking tumor size or location into consideration. Fourth, the sample size of our study was relatively small, especially with respect to patients with centrally located and pleural tumors. In our medical center, pathological confirmation of centrally located and pleural lung masses is usually made by performing an endobronchial biopsy and ultrasound guided biopsy. Because we only included subjects who intended to undergo a CT guided biopsy, a relatively low number of subjects with centrally located or pleural tumors were included, and this may have affected the statistical results.
In conclusion, we assessed the dual blood supply of lung cancer using a 320-detector CT scanner perfusion technique, and analyzed the correlations between dual perfusion and various characteristics of lung cancer. The proportion of dual perfusion in lung cancer is significantly dependent on tumor location, with centrally located and pleural lung cancer showing a relatively higher proportion of systemic arterial supply as compared to peripherally located lung cancer. The tumor size, as well as the presence of lymph node metastasis or distant metastasis, was not significantly associated with any of the measured perfusion parameters.

 XML Download