

 PDF
PDF ePub
ePub Citation
 Print
Print


INTRODUCTION
Noninvasive measurements of subclinical atherosclerosis include coronary artery calcification (CAC), intima-media thickness and plaque of the carotid artery, the ankle brachial index, and aortic pulse wave velocity. Both American and European guidelines recommend CAC as a tool for screening asymptomatic individuals at intermediate risk for coronary heart disease (CHD) (1).
The Framingham risk score (FRS) is a multivariable statistical model that considers age, sex, smoking history, blood pressure, cholesterol, high-density lipoprotein (HDL) cholesterol, and blood glucose levels or history of diabetes to estimate coronary event risk among individuals without CHD (234). Although coronary risk stratification is universally recommended, the current prediction models, including FRS, based on conventional CHD risk factors, have limitations in discriminating between individuals who will or will not experience CHD. The search for new models to discriminate individuals who would benefit most from intensive primary prevention is a clinically important objective.
Studies in the United States have shown that CAC is a strong independent predictor of CHD in both sexes among middle-aged and elderly groups, various ethnic groups, and individuals with and without diabetes (1); in addition, CAC reportedly plays an important role in reclassifying individuals from intermediate to high risk and improves risk prediction over and above FRS. However, most of the studies and recommendation regarding CAC focuses on Western society. Large-scale studies of CAC in the Asian population have not yet been performed.
The primary objective of this study was to determine the degree to which FRS correlates with coronary artery calcium score (CACS) in asymptomatic Korean individuals. The second objective was to assess the clinical characteristics associated with the discrepancy between FRS and CACS.
MATERIALS AND METHODS
Subjects
Our retrospective study included 2295 asymptomatic participants aged from 30 to 80 years (1387 males and 908 females) who visited the Myongji Hospital (Goyang, Korea) between January 2010 and June 2014 for comprehensive health screening. All participants underwent medical examination and computed tomography (CT) for coronary artery calcium scoring. Participants with a clinical history of angina, cardiovascular disease, and coronary revascularization were excluded by using a questionnaire. After exclusion of 79 participants, 2216 asymptomatic participants (1346 males and 870 females) were included in the analysis.
Conventional Risk Factors
Conventional cardiovascular risk factors including hypertension, diabetes, smoking history, family history of premature heart disease, and lipid profile were obtained.
Hypertension was defined as systolic blood pressure ≥ 140 mm Hg or diastolic blood pressure ≥ 90 mm Hg, or a history of physician-diagnosed hypertension and taking antihypertensive medication. Diabetes was defined as fasting glucose ≥ 126 mg/dL or a history of physician-diagnosed diabetes and taking antidiabetic medication.
Lipid profile, including low-density lipoprotein (LDL) cholesterol, HDL cholesterol, total cholesterol, and triglyceride (TG), was obtained.
Coronary Artery Calcium Scoring
CACS was assessed using 64-slice multidetector CT (GE Healthcare, LightSpeed VCT, Milwaukee, WI, USA) with tube voltage of 120 kVp, 100 mAs, 0.63-mm slide thickness, and 0.4 sec CT gantry rotation time protocol.
CAC was defined as a hyperattenuating lesion above a threshold of 130 Hounsfield units with an area of at least 3 adjacent pixels. It was automatically quantified using CT calcium score analysis software using Smartscore, AW version 4.5 (GE Healthcare, Milwaukee, WI, USA) according to the Agatston score.
For analysis purposes, we stratified the study population into the following 5 categories using the Agatston score: 0, 0 to < 10, 10 to < 100, 100 to < 400, and ≥ 400.
Framingham Risk Score
We calculated the 10-year absolute coronary risk using the Framingham equation including age, sex, smoking history, systolic blood pressure, history of taking antihypertensive medication, total cholesterol, and HDL cholesterol. Population was stratified into the following 5 categories according to the FRS: 0 to < 5, 5 to < 10, 10 to < 15, 15 to < 20, and ≥ 20.
Consistent Group and Inconsistent Group
We reclassified the participants into consistent and inconsistent groups for the data analysis. Participants with low coronary event risk (FRS < 10) and low CACS (CACS < 100) were designated as the consistent group; and participants with low coronary event risk (FRS < 10) and high CACS (CACS ≥ 100) were designated as the inconsistent group.
Statistical Analysis
Data were expressed as mean ± standard deviation for continuous variables, and frequencies and percentages for categorical variables. Two-sample t-test and one-way analysis of variance were performed to compare continuous variables, and chi-square test was performed to compare categorical variables among different groups according to the CACS.
Spearman's correlation coefficient was used to investigate the relationship between CACS and FRS. Logistic regression was used to determine the factors between the consistent and inconsistent groups. Calibration was assessed by the Hosmer-Lemeshow test and discrimination was assessed using a receiver operating characteristic (ROC) curve.
All statistical analyses were performed using SPSS, version 20.0, for Windows (SPSS Inc., Chicago, IL, USA). A p value of < 0.05 was considered statistically significant.
RESULTS
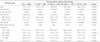
Of the 2295 participants with results of CT scan for CACS, 79 participants had missing risk factor data. Thus, the study included 2216 participants. Characteristics of these participants stratified by CACS groups were shown in Table 1.
Overall, the mean age (standard deviation) of the participants at the time of the CT scan was 50.3 (11.3) years and the proportion of male participants was 60.7%.
Among the risk factors included in the Framingham equation, age, male gender, systolic blood pressure, and HDL cholesterol showed a significant correlation with CACS. Among the risk factors not included in the Framingham equation, hypertension, diastolic blood pressure, diabetes mellitus, TG, and body mass index (BMI) were significantly correlated with CACS.
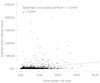
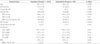
A positive correlation was observed between CACS and FRS representing the 10-year absolute risk for a coronary event (Spearman's correlation coefficient r = 0.464, p < 0.0001) (Fig. 1). However, comparison between risk stratification by CACS and FRS showed a discrepancy, i.e., many cases had a low coronary event risk profile and a high CACS, and vice versa (Table 2). Of these, we analyzed factors explaining the discrepancy between CACS and FRS in about 3.7% of participants from the inconsistent group [low coronary event risk (FRS < 10) and high CACS (CACS ≥ 100)], as compared to participants from the consistent group [low coronary event risk (FRS < 10) and low CACS (CACS < 100)]. Age, male gender, hypertension, systolic blood pressure, diastolic blood pressure, diabetes mellitus, and BMI were significantly associated with the discrepancy, respectively (Table 3).
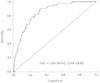
Age, male gender, smoker, presence of hypertension, total cholesterol, diabetes mellitus, and BMI (≥ 35) were associated factors in the multivariable model (Table 4). Our final diagnostic prediction model for discrepancy between FRS and CACS included factors associated with FRS and additional factors including diastolic blood pressure (≥ 75 mm Hg), diabetes mellitus, and BMI (≥ 35). In the ROC analysis, the area under the curve was 0.854 [95% confidence interval (CI), 0.819–0.890], which indicates good sensitivity and slightly improved results, as compared to the prediction model including only FRS-associated factors (area under the curve = 0.838, 95% CI = 0.801–0.874) (Fig. 2).
DISCUSSION
The main findings of this study were as follows. 1) A significant positive correlation was observed between the CACS and the FRS in asymptomatic Korean individuals. 2) In the inconsistent group, diabetes mellitus or obesity (BMI ≥ 35) were important factors to compensate for the weakness of FRS, according to the diagnostic prediction model.
Currently, the approach for managing asymptomatic individuals who have a risk for CHD is based on traditional clinical risk assessments such as the FRS or National Cholesterol Education Program guideline (234). However, there are limitations when these traditional risk assessment models are used to guide individual therapy and discriminate between individuals who will or will not experience CHD (56).
CACS represents the total plaque burden; and plaque rupture is more likely to occur when the overall plaque burden is high (17). Also, CACS is a strong predictor of coronary events independent of conventional coronary risk factors or risk-factor scores (891011). Occasionally, CACS fails to predict CHD events, which may be due to coronary artery spasm or high burden of noncalcified atherosclerotic plaques (12). Nevertheless, CACS has become a useful tool to treat and predict coronary artery disease in clinical practice, despite its questionable reliability due to lack of large population-based standard data, especially in Asia. Some studies have suggested that CAC differs among different ethnic groups (1314). Other studies have suggested that there are no racial differences in the prevalence and severity of CAC (15).
In this study, we identified the association between conventional cardiovascular risk factors and CAC in asymptomatic Korean individuals. Park et al. (16) reported that male gender, older age, high blood pressure, HbA1C, and obesity are related to the presence of CAC in the asymptomatic Korean population. In our study, we obtained similar results, which suggested that CACS is also significantly correlated with age, male gender, diabetes mellitus, hypertension, systolic blood pressure, diastolic blood pressure, HDL cholesterol, and TG, and BMI. However, smoking, total cholesterol, LDL cholesterol, and family history of premature heart disease were not correlated with CACS.
Previous studies have determined the degree to which FRS correlates with CACS in Korean individuals. Sung et al. (17) reported a significant positive correlation between the CACS and FRS; however, a large discrepancy between CACS and FRS was observed in older individuals (≥ 50 years) and in individuals with metabolic syndrome. Our study also showed a positive correlation between CACS and FRS (Spearman's correlation coefficient r = 0.464, p < 0.0001). Of these, about 3.7% of participants showed discrepancy with low coronary event risk and high CACS.
The multivariable model used in our study indicated that factors associated with FRS and additional factors including diabetes mellitus and BMI (≥ 35) are possible associated factors for discrepancy. Our final diagnostic prediction model and the ROC analysis showed improvement of sensitivity, as compared to the prediction model including only FRS-associated factors. This result suggested that individuals who have diabetes mellitus or obesity (BMI ≥ 35) might benefit from CACS using multidetector CT for coronary risk evaluation even if they belong to the low risk group according to FRS.
Our study had some limitations. First, this was a cross-sectional study, and thus it does not provide the outcome data or prognosis in the population included. Second, findings of this study may not be applicable to other populations of different ethnicities. Third, although CACS is a strong independent predictor of CHD, it is not a direct measure of atherosclerosis and it may have failed to detect some noncalcified plaques.
In conclusion, CACS and FRS showed a strong positive correlation in the asymptomatic Korean study population. Of these, about 3.7% of participants showed discrepancy between CACS and FRS and factors associated with the discrepancy included age, male gender, smoker, presence of hypertension, total cholesterol, diabetes mellitus, and BMI (≥ 35). According to our diagnostic prediction model, diabetes mellitus or obesity (BMI ≥ 35) are potential indicators for application of CACS using multidetector CT to compensate for the weakness of the FRS.

 XML Download