Journal List > J Korean Soc Radiol > v.74(5) > 1087657

Yoon, Shin, Ohm, Kim, Ahn, Yang, and Park: Comparison between Doppler Ultrasonography and Renal Scintigraphy in Assessment of Post-Transplant Renal Function

Abstract

Purpose

To compare the usefulness of Doppler ultrasonography and renal scintigraphy in the assessment of short- and long-term function of transplanted kidneys.

Materials and Methods

We retrospectively reviewed the cases of 79 patients who underwent Doppler ultrasonography and technetium-99m diethylene triamine pentaacetic acid renal scintigraphy on the same day, within 4 days of renal transplantation. Image parameters were evaluated for statistical differences.

Results

There was a strong positive correlation between the glomerular filtration rate (GFR) as measured by renal scintigraphy and the estimated GFR (eGFR) based on serum creatinine levels (correlation coefficient = 0.71). Scan grade according to the time-activity curve, resistive index, and end diastolic velocity showed moderate correlations with the eGFR (correlation coefficients = -0.557, -0.329, and 0.370, respectively) in the early post-transplantation period. The mean survival time was longer in patients with lower resistive indices (≤ 0.68, 54.9 months vs. > 0.68, 29.5 months) and lower pulsatility indices (≤ 1.32, 53.8 months vs. > 1.32, 28.7 months); however, there were no statistically significant differences in the long-term follow-up period (p = 0.121 for resistive index and p = 0.074 for pulsatility index).

Conclusion

Renal scintigraphy is a more sensitive method than Doppler ultrasonography for assessing transplanted kidney function in the early post-transplantation period. Doppler ultrasonography might reflect the long-term survival time. However, it is difficult to predict long-term renal function using either method.

Figures and Tables

Fig. 1

Flow chart summarizing the study method.

DTPA = diethylenetriaminepentaacetic acid, eGFR = estimated glomerular filtration rate, ROC = receiver operating characteristic, USG = ultrasonography
jksr-74-313-g001
Fig. 2

Kaplan–Meier survival curves of renal dysfunction comparing cases with low vs. high resistive indices (≤ 0.68 vs. > 0.68). Mean survival time was longer (54.9 months vs. 29.5 months) in patients with lower resistive indices. However, the difference was not statistically significant (p = 0.121).

jksr-74-313-g001
Table 1

Data of Laboratory Tests, Doppler Ultrasonography, and Renal Scintigraphy

jksr-74-313-i001
Total (n = 79) Cadaver (n = 43) Living (n = 36) p-Value
Serum Cr 2.76 ± 2.18 3.60 ± 2.33 1.77 ± 1.46 < 0.001
eGFR 41.7 ± 30.3 26.1 ± 17.1 60.4 ± 32.1 < 0.001
Doppler USG
 Resistive index 0.69 ± 0.08 0.71 ± 0.71 0.67 ± 0.07 0.024
 Pulsatility index 1.31 ± 0.32 1.37 ± 0.34 1.24 ± 0.29 0.072
 PSV (cm/sec) 40.2 ± 15.4 39.9 ± 16.5 40.6 ± 14.2 0.835
 EDV (cm/sec) 12.8 ± 6.1 12.0 ± 6.2 13.8 ± 5.8 0.190
Renal scintigraphy
 Scan grade 1.2 ± 0.8 1.5 ± 0.7 0.8 ± 0.7 < 0.001
 Scan GFR 45.1 ± 25.2 35.5 ± 13.5 56.7 ± 30.8 < 0.001
 Hilson's PI 206 ± 152 (n = 70) 251 ± 163 (n = 40) 146 ± 112 (n = 30) 0.002
 Tmax (min) 3.3 ± 3.0 3.0 ± 1.7 3.5 ± 4.1 0.463
 T1/2 (min) 36.4 ± 32.8 (n = 68) 38.6 ± 26.4 (n = 39) 33.3 ± 40.0 (n = 29) 0.519
 δP (sec) 4.4 ± 2.1 (n = 53) 5.1 ± 2.4 (n = 25) 3.9 ± 1.6 (n = 28) 0.032
 Perfusion index 16.6 ± 7.6 15.1 ± 5.8 18.4 ± 9.1 0.063
 Excretion index 1.00 ± 1.06 0.74 ± 0.56 1.31 ± 1.39 0.026

Plus-minus values are mean ± standard deviation.

Cr = creatinine, EDV = end diastolic velocity, eGFR = estimated GFR, GFR = glomerular filtration rate, PI = perfusion index, PSV = peak systolic velocity, T1/2 = time from peak to 1/2 peak, Tmax = time to peak of the renogram, USG = ultrasonography, δP = time in seconds between the peaks of the iliac and graft curve

Table 2

Comparison of Imaging Parameters between Two Groups According to eGFR Level (30 mL/min per 1.73 m2) by Using Student's t-Test

jksr-74-313-i002
< 30 mL/min (n = 38) ≥ 30 mL/min (n = 41) p-Value
Doppler USG
 Resistive index 0.71 ± 0.07 0.66 ± 0.07 0.003
 Pulsatility index 1.39 ± 0.31 1.24 ± 0.30 0.028
 PSV (cm/sec) 36.7 ± 16.0 43.1 ± 14.0 0.047
 EDV (cm/sec) 10.7 ± 5.7 14.5 ± 5.7 0.003
Renal scintigraphy
 Scan grade 1.6 ± 0.7 0.7 ± 0.7 < 0.001
 Scan GFR 32.5 ± 12.8 56.8 ± 28.3 < 0.001
 Hilson's PI 256 ± 171 (n = 35) 156 ± 112 (n = 35) 0.006
 Tmax (min) 3.0 ± 1.4 3.5 ± 4.0 0.518
 T1/2 (min) 43.0 ± 26.3 (n = 32) 30.4 ± 36.9 (n = 36) 0.117
 δP (sec) 5.0 ± 2.4 (n = 26) 3.9 ± 1.5 (n = 27) 0.052
 Perfusion index 14.3 ± 6.1 18.7 ± 8.1 0.009
 Excretion index 0.75 ± .57 1.19 ± 1.31 0.048

Plus-minus values are mean ± standard deviation.

EDV = end diastolic velocity, eGFR = estimated GFR, GFR = glomerular filtration rate, PI = perfusion index, PSV = peak systolic velocity, T1/2 = time from peak to 1/2 peak, Tmax = time to peak of the renogram, USG = ultrasonography, δP = time in seconds between the peaks of the iliac and graft curve

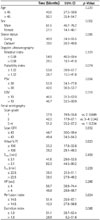
Table 3

Comparison of Clinical and Imaging Parameters According to the Occurrence of Renal Dysfunction Using the Kaplan–Meier Survival Analysis

jksr-74-313-i003
Time (Months) 95% CI p-Value
Age 0.220
 ≤ 45 43.6 27.5-59.6
 > 45 50.1 35.4-64.7
Sex 0.002
 Male 61.5 46.7-76.2
 Female 27.1 14.1-40.1
Donor status 0.995
 Living 49.9 34.3-65.5
 Cadaver 39.0 28.2-49.8
Doppler ultrasonography
 Resistive index 0.121
  ≤ 0.68 54.9 40.3-69.4
  > 0.68 29.5 18.1-41.0
 Pulsatility index 0.074
  ≤ 1.32 53.8 39.9-67.7
  > 1.32 28.7 15.5-41.8
 PSV 0.656
  ≤ 30 55.9 34.1-77.8
  > 30 42.0 30.3-53.7
 EDV 0.318
  ≤ 10 46.6 31.2-62.0
  > 10 46.7 32.5-60.9
Renal scintigraphy
 Scan grade
  1 37.9 19.9-55.8 vs. 2: 0.649
  2 42.5 17.9-67.1 vs. 3-4: 0.342
  3-4 51.2 35.2-67.2 vs. 1: 0.234
 Scan GFR 0.832
  ≤ 43 44.7 30.0-59.4
  > 43 49.4 34.5-64.3
 Hilson's PI 0.623
  ≤ 106 25.2 17.8-32.6
  > 106 39.2 29.1-49.3
 Tmax (min) 0.439
  ≤ 3.1 41.6 29.6-53.5
  > 3.1 62.3 44.5-80.2
 T1/2 (min) 0.229
  ≤ 22.5 36.5 21.9-51.1
  > 22.5 38.5 27.9-49.2
 δP (sec) 0.265
  ≤ 4 56.7 38.9-74.4
  > 4 49.8 29.8-69.7
 Perfusion index 0.624
  ≤ 14.5 51.4 35.6-67.1
  > 14.5 42.3 27.8-56.8
 Excretion index 0.065
  ≤ 1.8 51.1 38.7-63.4
  > 1.8 28.9 6.2-51.6

Doppler ultrasonography and renal scintigraphy parameters were divided according to cut-off value using ROC curve analysis.

CI = confidence interval, EDV = end diastolic velocity, GFR = glomerular filtration rate, PI = perfusion index, PSV = peak systolic velocity, ROC = receiver operating characteristic, T1/2 = time from peak to 1/2 peak, Tmax = time to peak of the renogram, δP = time in seconds between the peaks of the iliac and graft curve

References

1. Tonelli M, Wiebe N, Knoll G, Bello A, Browne S, Jadhav D, et al. Systematic review: kidney transplantation compared with dialysis in clinically relevant outcomes. Am J Transplant. 2011; 11:2093–2109.
2. Al-Jedai A, Alsultan M, Almeshari K, Alshaibani K, Elgamal H, Alkortas D, et al. Cost analysis of kidney transplantation in highly sensitized recipients compared to intermittent maintenance hemodialysis. Ann Transplant. 2012; 17:82–91.
3. Halawa A. The early diagnosis of acute renal graft dysfunction: a challenge we face. The role of novel biomarkers. Ann Transplant. 2011; 16:90–98.
4. Hariharan S, McBride MA, Cherikh WS, Tolleris CB, Bresnahan BA, Johnson CP. Post-transplant renal function in the first year predicts long-term kidney transplant survival. Kidney Int. 2002; 62:311–318.
5. Gourishankar S, Hunsicker LG, Jhangri GS, Cockfield SM, Halloran PF. The stability of the glomerular filtration rate after renal transplantation is improving. J Am Soc Nephrol. 2003; 14:2387–2394.
6. White C, Akbari A, Hussain N, Dinh L, Filler G, Lepage N, et al. Estimating glomerular filtration rate in kidney transplantation: a comparison between serum creatinine and cystatin C-based methods. J Am Soc Nephrol. 2005; 16:3763–3770.
7. Delaney V, Ling BN, Campbell WG, Bourke JE, Fekete PS, O'Brien DP 3rd, et al. Comparison of fine-needle aspiration biopsy, Doppler ultrasound, and radionuclide scintigraphy in the diagnosis of acute allograft dysfunction in renal transplant recipients: sensitivity, specificity, and cost analysis. Nephron. 1993; 63:263–272.
8. Kocabas¸ B, Aktas¸ A, Aras M, Is¸iklar I, Gençoğlu A. Renal scintigraphy findings in allograft recipients with increased resistance index on Doppler sonography. Transplant Proc. 2008; 40:100–103.
9. al-Nahhas AM, Kedar R, Morgan SH, Landells WN, al-Murrani B, Heary T, et al. Cellular versus vascular rejection in transplant kidneys. Correlation of radionuclide and Doppler studies with histology. Nucl Med Commun. 1993; 14:761–765.
10. Isiklar I, Aktas A, Uzuner O, Demirag A, Haberal M. Power Doppler ultrasonography compared with scintigraphy in the diagnosis of renal allograft dysfunction. Transplant Proc. 1999; 31:3330–3331.
11. Brown ED, Chen MY, Wolfman NT, Ott DJ, Watson NE Jr. Complications of renal transplantation: evaluation with US and radionuclide imaging. Radiographics. 2000; 20:607–622.
12. Saracino A, Santarsia G, Latorraca A, Gaudiano V. Early assessment of renal resistance index after kidney transplant can help predict long-term renal function. Nephrol Dial Transplant. 2006; 21:2916–2920.
13. Reinig JW, Gordon L, Frey D, Garrick E, Daniel WT 3rd. Glomerular filtration rate in transplantation patients: estimation of renal function using Tc-99m DTPA. Radiology. 1985; 156:505–507.
14. Heaf JG, Iversen J. Uses and limitations of renal scintigraphy in renal transplantation monitoring. Eur J Nucl Med. 2000; 27:871–879.
15. Baxter GM. Ultrasound of renal transplantation. Clin Radiol. 2001; 56:802–818.
16. Cosgrove DO, Chan KE. Renal transplants: what ultrasound can and cannot do. Ultrasound Q. 2008; 24:77–87. quiz 141-142
17. Nezami N, Tarzamni MK, Argani H, Nourifar M. Doppler ultrasonographic indexes in kidney transplant recipients: its relationship with kidney function. Iran J Kidney Dis. 2007; 1:82–87.
18. Rifkin MD, Needleman L, Pasto ME, Kurtz AB, Foy PM, McGlynn E, et al. Evaluation of renal transplant rejection by duplex Doppler examination: value of the resistive index. AJR Am J Roentgenol. 1987; 148:759–762.
19. Gao J, Rubin JM, Xiang DY, He W, Auh YH, Wang J, et al. Doppler parameters in renal transplant dysfunction: correlations with histopathologic changes. J Ultrasound Med. 2011; 30:169–175.
20. McArthur C, Geddes CC, Baxter GM. Early measurement of pulsatility and resistive indexes: correlation with long-term renal transplant function. Radiology. 2011; 259:278–285.
21. Radermacher J, Mengel M, Ellis S, Stuht S, Hiss M, Schwarz A, et al. The renal arterial resistance index and renal allograft survival. N Engl J Med. 2003; 349:115–124.
22. Naesens M, Heylen L, Lerut E, Claes K, De Wever L, Claus F, et al. Intrarenal resistive index after renal transplantation. N Engl J Med. 2013; 369:1797–1806.
23. Enhesari A, Mardpour S, Makki Z, Mardpour S. Early ultrasound assessment of renal transplantation as the valuable biomarker of long lasting graft survival: a cross-sectional study. Iran J Radiol. 2014; 11:e11492.
24. Gonzalez Molina M, Morales JM, Marcen R, Campistol JM, Oppenheimer F, Serón D, et al. Renal function in patients with cadaveric kidney transplants treated with tacrolimus or cyclosporine. Transplant Proc. 2007; 39:2167–2169.
TOOLS
Similar articles