

 PDF
PDF ePub
ePub Citation
 Print
Print


INTRODUCTION
Lung adenocarcinoma is the most common histological subtype of lung cancer worldwide, accounting for almost half of all lung cancers (1). Recently, the International Association for the Study of Lung Cancer, American Thoracic Society, and European Respiratory Society introduced a new classification for lung adenocarcinoma (1). The term bronchioloaveolar carcinoma should no longer be used for pure ground-glass nodule (GGN) or part-solid GGN with a predominant ground-glass opacity (GGO) component found on computed tomography (CT). These tumors are classified under the new terms of adenocarcinoma in situ (AIS), minimally invasive adenocarcinoma (MIA), lepidic predominant invasive adenocarcinoma (LPA), other subtype predominant adenocarcinoma having lepidic component and invasive mucinous adenocarcinoma (2).
Of special interest to thoracic surgeons are the new categories AIS and MIA, which are small (< 3 cm), solitary adenocarcinomas of purely lepidic growth without invasion for AIS or < 0.5 cm invasion for MIA. This conceptual change was because AIS has 100% disease-free survival, and MIA has near 100% disease-free survival with proper surgical intervention (3456). Limited resection can be an appropriate option for AIS and MIA, but the results of prospective trials are needed to determine the precise incidence of local recurrence (6). Therefore, if we can accurately diagnose AIS, MIA, and LPA through imaging prior to surgery, we might be able to select patients who are suitable for sublobar resection.
CT features of AIS, MIA, and LPA containing lepidic components are reported to be pure or part-solid GGN. Recently, Lee et al. (7) reported differentiation using CT features between invasive pulmonary adenocarcinoma, including lepidic and non-lepidic growth and preinvasive lesions (AIS, atypical adenomatous hyperplasia) appearing as GGN. To our knowledge, no studies have attempted to differentiate CT features among AIS, MIA and LPA. Therefore, the purpose of our study was to retrospectively investigate the CT features that differentiate among AIS, MIA and LPA that appeared as GGN in 32 patients.
MATERIALS AND METHODS
This retrospective study was approved by the Institutional Review Board of Gangneung Asan Hospital, which waived the requirement for informed consent from patients.
Patients
Between November 2006 and April 2013, AIS was pathologically confirmed in 19 patients at our institution, with 18 patients receiving video-assisted thoracic surgery (VATS). One patient had a lobectomy without biopsy because of the central location of the nodule in the lung. MIA was pathologically proven in 4 patients with wedge resection by VATS (n = 3) and lobectomy (n = 1). LPA was pathologically proven in 9 patients with direct lobectomy (n = 5) and lobectomy after wedge resection by VATS (n = 4).
Clinical Features of the Patients
We reviewed the patients' medical records at our hospital. The patients' recorded clinical features of patients were: age, multiplicity, smoking history, and past history of diseases including any malignancies. Two patients had multiple lesions: one patient with breast cancer showed AIS in the right middle lobe with a similar lesion in the left lower lobe on CT scans, and one patient with colon cancer showed LPA in the right upper lobe with two similar lesions in the left upper and left lower lobes on CT scans. Only the largest GGN was pathologically confirmed in the case that had multiple GGN. Other smaller GGN were not included in the material.
CT Scanning
In all individuals, a thin-section CT (GE Medical System, Milwaukee, WI, USA) was performed once during follow-up. Scanning parameters were 120 kVp and 400 mAs, pitch 0.87, and collimation 1.25 mm. Images were reconstructed with 1.25-2.5 mm thickness. Before surgery, each patient underwent chest CT examination. All patients except 5 LPA patients received follow-up chest CT. The interval between the initial CT scan and the last scan before surgery was an average of 548 days for AIS, 507 days for MIA, and 488 days for LPA. When multiple CT scans were available for CT morphological analysis, we selected the last scan before surgery or biopsy. The mean interval between CT and surgery or biopsy was 19.0 days (range, 1-87 days; median 12 days).
Analysis of CT Features and Pathology
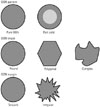
One radiologist (D.S.R.) and two radiology residents (D.Y.K. and M.H.L.) analyzed all CT images using the lung setting [window level of -700 Hounsfield units (HU) and a width 1500 HU]. Discrepancies were resolved by consensus. Recorded CT findings for each lesion were: 1) location of the lesion (central vs. subpleural), 2) Involved lobe, 3) shape (round, polygonal, and complex), 4) size, and 5) CT morphology as: (1) pure GGN vs. part-solid GGN, (2) margin (smooth vs. irregularity), (3) pleural tag, (4) internal air density, (5) any change in lesion on follow-up CT scans (Fig. 1) (8).
Subpleural location of the lesion was defined as the outer third of the lung. Pure GGN was defined as hazy opacity that did not obscure underlying pulmonary vessels (6). Pleural tag was defined as a linear strand that originated at the nodule surface and terminated at the pleural surface. Internal air density included pseudocavitation, bubble lucency and air bronchogram.
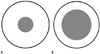
We measured the size of the solid portion of part-solid GGN as the maximum dimension of the solid component of the lung windows excluding GGO. We graded the area of the solid portion of part-solid GGN on thin-section CT scans with a two-point scale: Grade 1 was a solid portion ≤ 5 mm (Fig. 2A), and Grade 2 was > 5 mm (Fig. 2B).
Lesions were microscopically evaluated by conventional hematoxylin-eosin staining. Cases were diagnosed using the International Association for the Study of Lung Cancer, American Thoracic Society, and European Respiratory Society classifications from 2011. Pathological sections of each resected lesion were compared with corresponding CT images. Comparisons were performed via consensus between a pathologist (G.H.G.) and a radiologist (D.S.R.).
Statistical Analysis
Statistical analyses were performed with SAS software (version 9.13; SAS Institute, Cary, NC, USA). Patient demographics (age, GGN multiplicity, presence of smoking history, and prior history of other malignancy) were compared among AIS, MIA, and LPA using Fisher's exact test. Ages were compared using the Kruskal-Wallis test.
Morphological features regarding nodule size were compared among AIS, MIA, and LPA using the Kruskal-Wallis test. Shape, marginal characteristics, pleural tag, internal air density, and part-solid status were compared among AIS, MIA, and LPA using Fisher's exact test. A p value of less than 0.05 was considered to indicate a significant difference.
RESULTS
Clinical Features of Patients
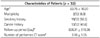
The clinical backgrounds of the 32 patients are shown in Table 1. The 32 patients were 18 men and 14 women, aged 36 to 81 years (mean: 63.7 years), with 13 patients who were non-smokers and 13 with a history of previous cancer (40.6%). Two patients had multiple GGN.
CT Findings of Patients
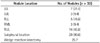
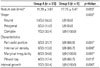
Lesion location was a subpleural portion of the lung (n = 29, 90.6%) in all 32 patients. Upper lobes (53.2%) were involved in 17 patients, especially the right upper lobe (43.8%) (Table 2).
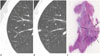
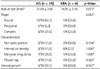
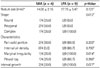
No significant differences were seen between AIS (Fig. 3) and MIA (Fig. 4) in shape, marginal irregularity, pleural tag, internal air density, lesion size or solid portion (Table 3).
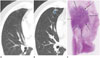
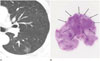
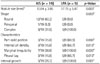
Significant differences were seen in lesion size, shape, solid portion, internal air density, marginal irregularity, and pleural tag (p < 0.05) (Table 4) between AIS (Fig. 3) and LPA (Figs. 5, 6).
Complex shape and marginal irregularity were significantly different between MIA and LPA (Table 5).
Comparison of CT Features in Group A and B
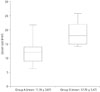
CT feature comparisons between Group A and B are shown in Table 6. Round or polygonal shape with smooth margin was significantly associated with Group A (Figs. 3, 4), and complex shape with marginal irregularity was associated with Group B (Figs. 5, 6). Groups A and B were significantly different in lesion size (Fig. 7), shape, solid portion, margin and pleural tag (p < 0.05). In Group A, 21.7% of lesions were part-solid GGN, and part-solid GGN except for mucinous AIS (Fig. 8) were classified as Grade 1. In Group B, 88.9% of lesions part-solid GGN, and all part-solid GGN were classified as Grade 2.
DISCUSSION
Van Schil et al. (6) reported that sublobar resection is generally considered acceptable for GGO lesions or adenocarcinomas with minimal invasion, so we classified AIS and MIA as Group A, suitable for sublobar resection. If we can accurately diagnose Group A and Group B using imaging before surgery, we might be able to select patients who are suitable for sublobar resection. Therefore, we investigated CT findings between Group A and Group B.
The morphological CT features of a lobulated border and spiculated margin are predictive of malignant lesions in pure GGN and part-solid GGN (9). A lobulated border in solid pulmonary nodules is associated with an increased probability of malignancy (10). Histologically, tumor margins can become lobulated, or scalloped pulling forces can originate from the desmoplastic reaction in lung cancer, directed towards tumor centers. Fibroblastic stromal invasion is a characteristic histological feature of adenocarcinoma (11) and could be the cause of the lobulated border of malignant GGN. In our study, complex shape indicated a lobulated border, and marginal irregularity indicated a spiculated margin. Complex border and marginal irregularity were the most important CT findings in Group B.
Larger pulmonary nodules are more likely to be malignant than smaller nodules (12). The solid component of GGN usually represents areas of fibroblastic proliferation or invasive tumor components (10). Considering two previous studies (1213), smaller GGN with smaller solid portions might have a higher probability of being AIS or MIA. In Group B, 88.9% of lesions were part-solid GGN, and in 5 of these patients (63%) more than 5 mm of the solid portion of GGN was considered Grade 2. The size of GGN in Group B was a mean of 17.78 mm, ranging from 12 mm to 26 mm. The size of GGN in Group A (n = 23) was a mean of 11.39 mm, ranging from 7 mm to 22 mm. In Group A, 21.7% (n = 5) of lesions were part-solid nodules and consisted of non-mucinous type (n = 4) and mucinous type (n = 1). In Group A, non-mucinous part-solid GGN (n = 4) had equal to or less than 5 mm solid portion of GGN as Grade 1. Group B was differentiated from Group A by larger lesion size (Fig. 7).
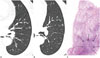
One mucinous AIS case had more than 50% solid portion in spite of a small size of 7 mm because there was a great deal of stromal fibrosis without invasion on pathologic specimen (Fig. 8). Lee et al. (2) described a rare case of mucinous MIA with a part-soild GGN. Naidich et al. (14) reported that a rapid transformation of initial pure GGN to a predominantly part-solid GGN was mucinous adenocarcinoma. Therefore, we suggest that mucinous AIS and mucinous MIA might show different radiologic patterns compared with slow-growing, non-mucinous AIS and non-mucinous MIA.
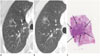
One case of LPA showed pure GGN with complex shape and marginal irregularity (Fig. 6). Theoretically, pure GGN on high-resolution CT (HRCT) should not have a nonaerated component because nonaerated components usually appear as focal solid portions on HRCT. However, because of the limited resolution (200-300 µmm) of HRCT images, stromal or myofibroblastic invasion of 5 mm in invasive adenocarcinoma can manifest as pure GGN on HRCT (1516). This discrepancy might have developed from partial volume averaging of relatively thick CT slices. Nakajima et al. (17) reported that 10% of pure GGN was adenocarcinoma with stromal invasion. Part-solid GGN occurred in 3 of 19 patients with AIS (15.8%). Scar tissue (fibrotic focus) without an invasive component within a peripheral lung AIS occasionally presents as a solid component within a GGN on HRCT (18).
In our study of 32 patients, previous cancer history was seen in 40.6% (n = 13). Therefore, for a patient with a history of extrathoracic malignancy, GGN on CT suggests atypical adenomatous hyperplasia (AAH), AIS, MIA, or LPA with lepidic growth pattern because of the rarity of pure metastatic GGN (19). Our study suggested that lepidic growth tumors might be prevalent in patients with a history of previous cancer.
The predilection of subpleural area (90.6%) and right upper lobe (43.8%) of the lesion with lepidic growth neoplasm was distinct, but the reason for this is not clear, although the most prevalent location of lung cancer is the right upper lobe, and the predilection of the upper lobe for AAH was distinct (20). Wedge resection by VATS was performed in 91% of Group A GGN because of the subpleural lesion location.
In our study, 26% AISs, 50% MIAs, and 100% LPAs had interval growth that indicated growth potential. Naidich et al. (14) recommend that solitary pure GGN larger than 5 mm have an initial follow-up CT examination in 3 months to determine persistence, followed by yearly surveillance by CT for a minimum of 3 years if the disease is persistent and unchanged.
Our study had a number of limitations. First, the retrospective design might have introduced selection bias. This study included only pathologically proven GGN, for which CT was more likely to find malignancies. Second, we retrospectively searched for patients with pulmonary GGN identified by CT using the medical records and the radiology information system at our hospital. GGN might have been unreported in original clinical readings and missed using this search method. Third, in our study, CT morphological assessment for differentiating AIS and MIA from LPA was made by the consensus of three observers (one chest radiologist and two radiology residents), and we did not analyze differentiating CT features based on each observer's assessment. Fourth, in GGN assessment, obtaining CT with a section thickness of 1.0-1.5 mm or less is essential (9). However, in our study, CT images with a section thickness of 2.5 mm were included. Fifth, multivariate analysis could not be performed because of the small number of cases.
In conclusion, round or polygonal shape indicated Group A. No significant difference between AIS and MIA was observed. In Group A with part-solid GGN, except for mucinous AIS, maximum diameter of the solid component excluding GGO was equal to or less than 5 mm. Group A could be distinguished from Group B by smaller lesion size, round or polygonal shape, smaller solid portion, and smooth margin.
 XML Download