

 PDF
PDF ePub
ePub Citation
 Print
Print


INTRODUCTION
Coronary CT angiography (CCTA) with a multidetector row computed tomography (MDCT) scanner holds diagnostic value in coronary artery disease (1, 2, 3). Even though many factors can affect the image quality of CCTA, including heart rate (HR), heart rate variability (HRV), breathing, obesity, and coronary calcification (4, 5, 6, 7), a relatively low and regular HR is essential to optimal image quality (4). With advances in CT technology, 64-slice MDCT was designed to accommodate a wider range of HRs with improved temporal resolution; however, studies have shown that HRV during CT scanning has a strong influence on the image quality and can decrease the diagnostic accuracy of CCTA (4, 6).
β-blockers reduce sympathetic influences and have been widely used to optimize HR in patients with tachycardia (5). β-blockers can amend HRV by stabilizing HR (6). Therefore, we assumed that administering a low dose β-blocker to patients with low HR could improve the image quality and diagnostic value of a prospective electrocardiography (ECG)-gated CCTA by reducing HR or HRV. We prospectively assessed the effectiveness of a low-dose β-blocker on HR, HRV and image quality of CCTA in subjects with a HR under 65 beats per minute (bpm), using a prospective ECG-triggered protocol (step-and-shoot technique) with a 64-slice MDCT scanner.
MATERIALS AND METHODS
Patient Preparation
The study was a prospective study that was approved by our Institutional Review Board. Written informed consent was obtained from all subjects. Healthy subjects with a HR of less than 65 bpm who underwent a prospective ECG-triggered CCTA using a 64-slice CT scanner to screen for coronary artery disease during the study period were enrolled. We excluded those who had a HR of greater than 65 bpm or less than 50 bpm before CT scan, history of coronary artery disease, known arrhythmia, previous allergic reaction to iodinated contrast media or β-blocker, renal insufficiency (serum creatinine > 150 µmol/L), hemodynamic instability, congestive heart failure, asthma, chronic obstructive pulmonary disease, systolic blood pressure of less than 100 mm Hg, and those taking an oral β-blocker at baseline (5). Enrolled subjects were randomly assigned to 2 groups (G1 and G2). Group 1 received a low-dose of β-blocker (Atenolol; 12.5 mg, Hyundai Pharmaceutical Ind. Co., Seoul, Korea) 30 minutes before the CCTA examination. Group 2 underwent CCTA without premedication.
CT Scan Protocol
All cardiac MDCT was performed with a 64-MDCT scanner (Philips Brilliance 64, Philips Medical System, Best, the Netherlands). Data acquisition was performed in the craniocaudal direction within a single breath-hold at end-inspiratory suspension. The scanning range covered the heart from the level of the carina to the diaphragm. A prospective ECG-triggered protocol was used with a step-and-shoot technique. The scanning parameters were as follows: step-and-shoot axial scanning direction, 420-msec gantry rotation time, 120 kV, 210 mAs, 64 × 910.625-mm slice collimation, 4-cm table feed per rotation, and the center of the imaging window set at 70-80% of the R-R interval. Seventy mL of iodinated contrast agent (Optiray 350; Tyco Healthcare, Kantata, Canada) was administered intravenously into an antecubital vein through an 18 gauge catheter at a rate of 5 mL/sec followed by 50 mL of normal saline at a rate of 5 mL/sec using a power injector (Nemoto; Nemoto Kyorindo, Tokyo, Japan). Imaging was performed using a real-time bolus tracking technique. The scans were started 7 seconds after a trigger threshold of 130 Hounsfield units was reached at the proximal descending aorta. The breath-hold maneuver was successfully performed by all patients. An ECG for each patient was recorded simultaneously.
CT Image Reconstruction
The image reconstruction was performed on the scanner's workstation using commercially available software (Extended Brilliance Workstation, Philips Medical System, Best, the Netherlands). The reconstruction parameters used were as follows: 0.9 mm slice thickness, 0.45 mm increment, 512 × 512 pixels image matrix, XCC kernel, and 15-23 cm field of view. MDCT data were transferred and post processing was performed on an Aquarius Workstation V3.6 (TeraRecon, San Mateo, CA, USA). Multi-planar reformatted (MPR), curved-planar reformatted (CPR), and medial axis reformatted (MAR) images with orthogonal and perpendicular projections to the vessel courses of each coronary segment were generated for the evaluation.
CT Image Analysis
Fifteen coronary segments were subdivided according to the American Heart Association guidelines (8); proximal right coronary artery (pRCA), middle RCA (mRCA), distal RCA (dRCA), right posterior descending artery (RPD), left main coronary artery, proximal left anterior descending artery (LAD), middle LAD, distal LAD, 1st diagonal branch (D1), 2nd diagonal branch, proximal left circumflex artery (pLCx), distal LCx (dLCx), obtuse marginal artery (OM), posterolateral artery and left posterior descending artery. The segments with a diameter of at least 1.5 mm at their origin were included.
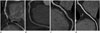
Two radiologists assessed the image quality of 15 coronary segments in consensus. We evaluated all reconstructed images using axial source images, as well as MPR, CPR, and MAR images. The image quality was assessed using the following 4-point grading scale by the 2 radiologists who were blinded to the HR and HRV: grade 1 (poor), severe degree of image degradation or discontinuation of vessel contour that prevented vessel lumen evaluation; grade 2 (adequate), moderate degree of image degradation with some obstacle to vessel lumen evaluation; grade 3 (good), minor degree of image degradation without compromising vessel lumen evaluation, and grade 4 (excellent), no image degradation (Fig. 1). Any segment with grade 1 was regarded as non-diagnostic.
Radiation Dose
The dose-length product was recorded for each cardiac CT examination by the CT scanner. The mean effective radiation dose was calculated by multiplying the dose-length product by the conversion coefficient (0.017) for the chest and expressed as millisieverts (9).
Heart Rate and Heart Rate Variability Analyses
The initial HR (HRpre) prior to β-blocker administration, was measured 30 minutes before the CCTA exam after sufficient rest in all patients. HRs were also checked during data acquisition of CCTA. Mean HR during scanning (HRmean) was obtained from the ECG-gated data. HR change (HRchg) was defined as difference between HRpre and HRmean (i.e., HRchg = HRpre - HRmean). HRV was calculated as 1 standard deviation (SD) of the HR during CT scanning (10).
Statistical Analysis
Continuous variables were expressed as mean ± SD and categorical variables as frequencies or percentages. Student's t-test or Mann-Whitney U test was used to evaluate the statistical significance of differences for the demographic data, HR, HRV and image quality scores between the 2 groups. Paired t-test was used to evaluate the statistical significance of difference between HRpre and HRmean in each group. Chi-square test was used to evaluate the statistical significance of differences for the number of segments in each score between the 2 groups. A linear regression and Pearson correlation were used to determine the correlations between the mean image quality score and HRmean or HRV. A p value of less than 0.05 was considered as statistically significant. All statistical analyses were performed with the commercially-available software (SPSS 20; Statistical Package for the Social Science, Chicago, IL, USA).
RESULTS
Heart Rate and Heart Rate Variability
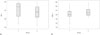
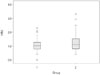
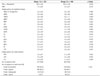
CCTA was performed in all subjects without complications. Demographic data including HR and HRV were summarized in Table 1. Mean age and body mass index were not statistically different between the 2 groups (p > 0.05). HRpre was not different in group 1 and group 2 (60.4 ± 4.2 bpm vs. 58.8 ± 3.6 bpm, p = 0.08). HRmean was significantly lower than HRpre in group 1 (50.3 ± 5.6 bpm vs. 60.4 ± 4.2 bpm, p = 0.011) but not in group 2 (53.3 ± 4.8 bpm vs. 58.8 ± 3.6 bpm, p = 0.193). HRchg was significantly higher in group 1 than in group 2 (10.1 ± 5.4 bpm vs. 5.5 ± 5.5 bpm, p < 0.001). HRmean during CCTA in group 1 was significantly lower than that of group 2 (50.3 ± 5.6 bpm vs. 53.3 ± 4.8 bpm, p = 0.016) (Table 1, Fig. 2). During CCTA, HRV was not different in group 1 and group 2 (1.1 ± 0.5 vs. 1.3 ± 0.7, p = 0.147) (Table 2, Fig. 3). The mean radiation dose of CCTA was 4.0 ± 0.4 mSv (range, 3.7-4.6 mSv). The radiation dose of group 1 was not different with that of group 2 (3.9 ± 0.5 mSv vs. 4.0 ± 0.4 mSv, p = 0.98).
Image Quality
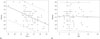
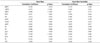
A total of 921 segments with a diameter greater than 1.5 mm were evaluated (431 segments in group 1 and 490 in group 2). Group 1 was diagnostic in 429 coronary segments (99.3%); excellent (score 4) in 190 (44.1%), good (score 3) in 184 (42.7%), and adequate (score 2) in 54 (12.5%). Three segments (0.7%) were non-diagnostic (score 1) due to severe degradation of vessel contours. Group 2 was diagnostic in 474 (97.7%); excellent (score 4) in 192 (39.2%), good (score 3) in 216 (44.1%), and adequate (score 2) in 66 (13.5%). Sixteen segments (3.3%) were non-diagnostic (score 1). On the segment-based analysis, the image quality scores for mRCA and D1 segments were higher in group 1 than in group 2 (3.0 ± 0.9 vs. 2.5 ± 1.1, p = 0.039 in mRCA, 3.4 ± 0.6 vs. 3.1 ± 0.7, p = 0.024 in D1). However, the mean scores of image quality were not different between group 1 and group 2 (3.3 ± 0.4 vs. 3.2 ± 0.3, p = 0.199), and the image quality scores on the vessel-based analysis were not different between group 1 and group 2 (Table 2). The mean image quality score of the coronary artery segments in both groups was negatively correlated with HRmean (r = -0.449, p < 0.001), but no significant correlation was found between HRV and mean image quality (r = -0.013, p = 0.913) (Fig. 4). On the segment-based analysis, the image quality scores of the pRCA, mRCA, dRCA, RPD, D1, pLCx, OM, and dLCx were negatively correlated to HRmean with statistical significance (p < 0.05). The correlation coefficient of mRCA was -0.575 (p < 0.001) and D1 was -0.297 (p = 0.013). None of the segments showed significant correlation between image quality and HRV (Table 3).
DISCUSSION
The aim of this study was to evaluate the effect of a low-dose β-blocker on HR and HRV, as well as the image quality of a prospective ECG-gated CCTA in healthy subjects with low HR. Our study demonstrated that the use of low dose β-blocker could improve the image quality of mRCA and D1 segments by reducing HR, even when the HR was less than 65 bpm.
The step-and-shoot technique using a prospective ECG-gated algorithm is one of the most powerful methods for radiation dose reduction. Dosage can be reduced up to 70-90% from that of retrospective ECG-gated CCTA (9, 11, 12, 13). However, a prospective ECG-gated CCTA mandates a low and regular HR of less than 60 to 65 bpm for optimal images (14). We postulated that the administration of low dose β-blocker could improve the image quality of a prospective ECG-gated CCTA by reducing HR or HRV, even in low HR subjects. We administered 12.5 mg oral atenolol that is less than the usual dose of 50-100 mg depending on the patient's weight for heart rate control (15). In group 1, the HR reduction (HRchg) was 11 bpm after low dose β-blocker administration. In group 2, the HRchg was 5.5 bpm without premedication, probably due to the increased vagal tone by breath-holding (16). Zhang et al. (17) reported that breath-holding reduced the mean HR by about 4 bpm. Low dose β-blocker affected the image quality of CCTA. Non-diagnostic segments were lower in group 1 (0.7%) than in group 2 (3.3%). Image quality on segmental analysis was better in group 1 at the mRCA, which was known to be easily degraded by motion artifact (18), and D1 branch. However, image quality improvement was only observed in mRCA and D1 segments. Also, there was no difference in image quality between the 2 groups on vessel based analysis. Leschka et al. (4, 6) reported that 64-slice MDCT had reasonable image quality over a wide range of HRs, and HRV has more effect than the HR. Earls (19) reported that a small dose of β-blocker might be helpful in minimizing HRV in patients with low HR and high HRV. HRV was not related directly to the image quality in our study. These findings may be the result of low HR and small HRV in the study subjects. Low HR provides sufficient duration of diastole for good quality images, and the HRV may have been too small to significantly affect the image quality in patients with low HR (20). Furthermore, there was no difference of HRV between the 2 groups, hence the effect of low dose β-blocker on HRV was hard to compare. The radiation dose of our study was similar to those of previous studies with a prospective ECG-gating technique (9, 21). Lowering HR could increase the radiation dose of prospective ECG-gated CCTA by lengthening the R-R interval. However, the radiation dose in group 1 and 2 were not significantly different.
There were several limitations to the study. First, the number of enrolled subjects was too small to be generalized to all patients. Second, the comparative study was not performed in the same patient groups due to the concern of radiation exposure. Nevertheless, there was no significant difference in demographic data and HRs prior to the administration of β-blocker between the 2 groups. Third, we evaluated the image quality based on motion artifact but not the diagnostic performance for detecting coronary artery disease. A future study has been planned to analyze the diagnostic accuracy of a prospective ECG-gated CCTA under the effect of a low dose β-blocker.
In conclusion, low-dose β-blocker could reduce the HR, including resting HRs of less than 65 bpm that are not usually indicated for β-blocker. The image quality of CCTA using a prospective gating technique was improved in the mRCA and D1 segments with a low-dose β-blocker by reducing HR. However, on the per-vessel analysis, the overall image quality was not changed. Therefore, usefulness of a low-dose β-blocker appears to be limited in healthy subjects with low HR.

 XML Download