

 PDF
PDF ePub
ePub Citation
 Print
Print


INTRODUCTION
Neoadjuvant chemotherapy (NAC) is a standard treatment for patients with locally advanced breast cancer and is gaining popularity for the treatment of patients with operable breast cancer to facilitate a breast-conserving surgery. Clinical and pathological responses to NAC represent the surrogates of long-term outcomes in breast cancer. The achievement of pathological complete response (pCR) or minimal disease after NAC is correlated to a favorable disease-free and overall survival (1, 2, 3). An accurate assessment of tumor response and early identification of responders during the treatment is important for a tailored therapy to each patient.
Dynamic contrast enhanced magnetic resonance imaging (DCE-MRI) is known to enable the most accurate assessment of tumor response in breast cancer after NAC in comparison to other conventional techniques (4, 5, 6). An objective response to NAC using DCE-MRI can be assessed by applying Response Evaluation Criteria in Solid Tumors version 1.1 (RECIST 1.1) criteria (7, 8), which are based on the anatomical changes of the tumor. Despite the wide acceptance of RECIST 1.1 criteria in the clinical practice, there are limitations for the response assessment because chemotherapy induced metabolic changes are known to precede anatomical changes in a tumor (9). The 18F-fluorodeoxyglucose (FDG) positron emission tomography/computed tomography (PET/CT) is a functional imaging modality which is commonly used in the area of oncology and provides information regarding the metabolic activity within tumors. The standardized uptake value (SUV) has been used as a quantitative parameter for the response assessment in PET/CT. The standardized response criteria for PET/CT, the so-called PET Response Evaluation Criteria in Solid Tumors version 1.0 (PERCIST 1.0) were also proposed by Wahl et al. (10).
DCE-MRI as well as PET/CT are promising methods to assess the tumor response after a NAC. So, the aim of this study was to evaluate the diagnostic performance of both DCE-MRI and PET/CT for the prediction of a pathological response after completion of NAC, applying each response assessment criterion.
MATERIALS AND METHODS
Patients
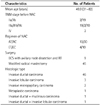
This retrospective study was approved by our Institutional Review Board. The need for an informed consent of patients was waived. A total of 54 patients with locally advanced breast cancer were included in this study between May 2007 and September 2011. The patients ranged in age from 31 to 82 years with a mean age of 49.9 years. All study participants were treated with chemotherapy based on anthracycline and taxane followed by surgery. MRI examinations and PET/CT were performed before each first cycle of chemotherapy (baseline) and after the completion of the planned chemotherapy (before surgery) for all study subjects. Both baseline and preoperative DCE-MRI and PET/CT were also performed in all patients. All patients underwent either breast conserving surgery with axillary nodal dissection and adjuvant radiotherapy or modified radical mastectomy within a month of imaging studies. Clinical characteristics are listed in Table 1.
MRI Imaging Acquisition
The MRI images were acquired with a 1.5-T scanner (Achieva; Philips Medical Systems, Best, the Netherlands) and a 3.0-T scanner (Magnetom Verio; Siemens Medical Solutions, Erlangen, Germany) equipped with a breast coil. The MRI images acquired with the Achieva scanner were obtained using the following sequences: 1) a sagittal, fat-suppressed, fast spin-echo T2-weighted imaging sequence with a repetition time (TR)/echo time (TE) of 6000/100, a flip angle of 90°, 30 slices with an field of view (FOV) of 320 mm, a matrix size of 424 × 296, 1 number of excitations (NEX), a slice thickness of 4 mm with a 0.1 mm interslice gap and an acquisition time of 2 minutes 56 seconds, and 2) a pre- and dynamic axial T1-weighted three-dimensional, fat-suppressed, fast-spoiled gradient-echo sequence with a TR/TE of 6.9/3.4, a flip angle of 12°, a slice thickness of 2.0 mm with no gap and an acquisition time of 1 minute 31 seconds. The images were obtained before and at 0, 91, 182, 273, 364, and 455 seconds after a rapid bolus injection of 0.1 mmol/kg body weight of gadolinium-diethylenetriamine pentaacetic acid (Gd-DTPA) (Magnevist, Schering, Berlin, Germany).
The MRI images produced by Verio scanner were obtained using the following sequences: 1) an axial, turbo spin-echo T2-weighted imaging sequence with a TR/TE of 4530/93, a flip angle of 80°, 34 slices, a FOV of 320 mm, a matrix size of 576 × 403, 1 NEX, a slice thickness of 4 mm and an acquisition time of 2 minutes 28 seconds, and 2) a pre- and post-contrast, axial T1-weighted flash three-dimensional volumetric interpolated breath hold examination sequence with a TR/TE of 4.4/1.7, a flip angle of 10°, a slice thickness of 1.2 mm with no gap and an acquisition time of 60 seconds. The images were obtained before and at 7, 67, 127, 187, 247, and 367 seconds after a rapid bolus injection of 0.1 mmol/kg body weight of Gd-DTPA (Magnevist, Schering, Berlin, Germany).
PET/CT Imaging Acquisition
PET/CT studies were acquired on combined PET/CT in-line systems, either on Biograph Duo or BiographTruepoint (Siemens Medical Solutions, Knoxville, TN, USA). The acquisition time was two to three minutes per bed position. All subjects were in supine position during PET/CT scanning. The CT started at the orbitomeatal line and progressed to the proximal thigh (130 kVp, 80 mAs, and 5 mm slice thickness; 120 kVp, 50 mAs, and 5 mm slice thickness). A PET scan followed immediately for the same body region. CT data were used for attenuation correction and images were reconstructed using a standard ordered-subset expectation maximization algorithm. The axial spatial resolution was 6.5 mm respectively 4.5 mm in the center of the FOV. A region of interest (ROI) was placed over the most intense area of FDG accumulation. The FDG uptake within the ROI was analyzed by the maximum SUV.
Response Assessment by Imaging
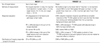
The response assessment criteria on both DCE-MRI and PET/CT were summarized in Table 2. DCE-MRI images were reviewed by one radiologist with 3 years experiences. For the DCE-MRI assessment, a maximum of two lesions per organ were assessed as target lesions and the maximal diameters of the target lesions were measured by the revised RECIST 1.1 criteria (8). Patients who had complete or partial response were assigned as responders. Patients with stable and progressive disease were assigned as non-responders.
PET/CT reports were reviewed by a radiologist. A cut-off value of a 30% decrease of the SUV for responders was used for the PET/CT response assessment (10). Patients with complete or partial metabolic response were assigned as responders. Patients with stable and progressive metabolic disease were assigned as non-responders.
Reference Standard
Core-needle biopsies of the primary tumor were performed before the initiation of treatment and the pathological response to the NAC was determined by evaluating the surgical specimen. We reviewed the pathological reports of the gross and microscopic evaluation of the post-chemotherapy surgical specimens. The pCR was defined as no recognizable invasive tumor cells encountered [ductal carcinoma in situ (DCIS) may be present]. A pathologic partial response (pPR) was characterized by microscopic residual cancers or macroscopic residual cancers with 1 cm in diameter (2). Tumors which did not exhibit pCR or pPR pathologic changes were assessed as showing a pathologic non-response (pNR). pCR and pPR were defined as responder and pNR were defined as a non-responder.
Statistical Analysis
The linear correlation between the different two methods and the pathology was analysed using Pearson's correlation. The accuracy, sensitivity, specificity, and positive and negative predictive values (PPV, NPV) of RECIST 1.1 and PERCIST 1.0 were calculated with respect to the response evaluation, using the pathologic results as a reference. Additionally, receiver operating characteristic (ROC) analysis was performed to assess and compare the diagnostic performance of DCE-MRI and PET/CT for predicting pathologic responders. Area under the curves (AUC) were calculated and compared to summarize the overall performances. Statistically significant differences between the AUC values are reported in terms of the 95% confidence interval (95% CI). The two-tailed Mann-Whitney test and Student's t test was used to assess the predictive role of the parameters among responders and non-responders. All of the statistical analyses were performed with SAS software (version 9.1, SAS Institute Inc., Cary, NC, USA) and MedCalc version 10.1.6 (MedCalc software, Mariakerke, Belgium). A p value less than 0.05 indicated statistical significance.
RESULTS
Twenty-one out of 54 patients (38.9%) were classified as pathological responders and thirty-three (61.1%) were classified as pathological non-responders. In their final pathology, twelve out of 54 patients (22.2%) had a complete remission and 9 patients (16.7%) had a pathological partial response.
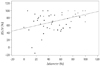
The percent change of the maximal diameter was moderately correlated with the percent change of the SUVmax (Pearson's correlation coefficient = 0.44, p = 0.001) (Fig. 1).
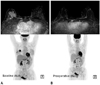
The assessment of tumor response for the use of DCE-MRI and PET/CT correlated with the pathological response are listed in Table 3. The disagreement rate of response assessment was 20/54 (37.0%) between DCE-MRI and pathology and 30/54 (55.6%) between PET/CT and pathology. In 26 cases (48.1%), both DCE-MRI and PET/CT examinations were classified as responders but the final surgical specimen indicated the pathological non-response (Fig. 2).
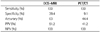
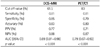
The sensitivity, specificity, accuracy, PPV, and NPV between both evaluation methods for the final pathological response assessment are summarized in Table 4. For the prediction of the pathological response, the diagnostic performance of DCE-MRI was better than that of PET/CT. But, the specificity was very low in the application of both criteria.
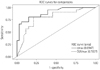
The AUC was 0.89 for DCE-MRI (p < 0.001) and 0.79 for PET/CT (p < 0.001) (Fig. 3). The sensitivity, specificity, accuracy, PPV, and NPV of DCE-MRI were 81%, 85%, 83%, 77%, and 88%, respectively, when the cut-off value of 61.5% was used. The sensitivity, specificity, accuracy, PPV, and NPV of PET/CT were 81%, 79%, 80%, 71%, and 87%, respectively, when the cut-off value of 83% was used (Table 5). The 95% CI was 0.81-0.98 for RECIST 1.1 criteria and 0.67-0.92 for PERCIST 1.0 criteria. There was no statistical difference in AUCs between RECIST 1.1 criteria and PERCIST 1.0 criteria (p = 0.15).
DISCUSSION
There are several previous studies which compared DCE-MRI and PET/CT for the response evaluation and assessment of residual lesion after NAC (11, 12, 13, 14, 15). There were some discrepancies and variations among those data (11, 12, 13, 14, 15), which could be explained by a significant difference in study population, data analysis and methodology. Chen et al. (11) reported their initial experience using both MRI and PET/CT to monitor responses and to assess residual lesions in 16 lesions of 15 patients with locally advanced breast cancer (LABC) in comparison to clinical breast examination and final pathology. In their correlated analysis of percent tumor size or SUV reduction with pathologic response, the PET/CT was more accurate in the prediction of the pNR in contrast to our study results. But, the complete response by MRI correlated well with the pathologic response. Recently, Choi et al. (12) estimated the predictive role of PET/CT and compared PET/CT with other modalities (including ultrasound and MRI) in 45 patients with breast cancer who were treated by NAC. They used RECIST 1.1 criteria for the assessment of tumor response for MRI and applied a cut off value of 30% for responders. For PET/CT examinations, they defined a response as a greater than 50% decline of SUVmax on PET/CT using the Research and Treatment of Cancer guideline. The idea was that the PET/CT may more accurately predict the pCR because of the functional imaging ability for viable tumor cells compared with the anatomic tumor size. However, the AUC in MRI were higher (0.91) than in ultrasonography (0.83) and PET/CT (0.62) in the ROC analysis, which is similar to our result. They explained the inferiority of PET/CT to MRI due to the lower anatomic discriminative resolution of PET/CT than of MRI. Also, the appropriate SUVmax cut-off value for the prediction of a pCR was undetermined. The clinician's experience in reading PET/CT has had a lack of sufficiency compared to the MRI. Dose-Schwarz et al. (13) evaluated the PET/CT for the assessment of residual lesions in 99 patients after primary chemotherapy of LABC in comparison with conventional imaging including MRI. In their study, FDG-PET/CT did not provide an accurate assessment of residual tumor after chemotherapy for subjects with breast cancer. Although all imaging modalities had distinct limitations in the assessment of residual lesions when compared with the histopathology, the MRI offered the highest sensitivity similar to our result. They explained the low detection rate of PET/CT due to 1) the limited spatial resolution of FDG-PET/CT and 2) the 'metabolic stunning' of the residual viable tumor after chemotherapy. Park et al. (14) compared MRI and PET/CT in the assessment of tumor response to NAC for subjects with breast cancer in 32 patients with the pathologic response as reference standard. They used a cut-off value of greater than 30% decrease in the maximal short diameter on MRI and of greater than 50% decrease in the SUVmax on PET/CT for responders. Similar to our study results, the change of the diameter of MRI correlated moderately with the change of the SUV on PET/CT. But, contrary to our study results, their results showed that the PET/CT had a higher sensitivity than the MRI although it was not statistically significant. For the prediction of the pathological response, the MRI was proven to be a more specific modality than PET/CT.
Recently, Tateishi et al. (15) compared the parameters of DCE-MRI and PET/CT at baseline and after two cycles of NAC. The sensitivity, specificity and accuracy to predict pCR with RECIST 1.1 criteria were 45.5%, 85.5%, and 82.4%, respectively and with PERCIST 1.0 criteria 70.4%, 95.7%, and 90.8%, respectively. In their study, the sensitivities of both response criteria were lower, but both, specificities and accuracies were higher than in our results. Additionally, they evaluated the usefulness of various predictive imaging parameters of DCE-MRI and PET/CT. Of the imaging parameters, the sensitivities of % SUVmax, % kep, and % AUC90 (66.7%, 51.7%, and 50%, respectively) were not strong enough but the specificities (96.4%, 92%, and 95.2%, respectively) were high for a stratification of pathological responders in breast cancer.
In our study, the response rates of DCE-MRI and PET/CT were 87% and 75.9%, respectively. The pCR rate was 22.2% which is similar with reported results (2, 16, 17) and the pathological response rate was 38.9%. Both DCE-MRI and PET/CT showed sensitivities and NPV of 100% for predicting the pathological response. Contrary to its high sensitivity and NPV, the specificity and PPV were very low. DCE-MRIs using RECIST 1.1 criteria showed better diagnostic performances than PET/CT using PERCIST 1.0 criteria in ROC analysis, but the accuracy of both diagnostic criteria was insufficient to predict the pathological response and residual lesion after NAC. Both examinations classified 26 of 54 study subjects (48.1%) as responders but the final pathology showed the non-response (Fig. 2). So, clinical decision based on both DCE-MRI and PET/CT examinations should be made prudently with these limitations in mind. Neither DCE-MRI nor PET/CT could replace the pathologic examination after NAC to determine a pCR in our study.
This present study has several limitations: 1) This is a retrospective study with a small sample size. So, the statistical power was limited as a consequence. The statistical power will be greater if the sample size is increased in future multicenter studies in order to assess the true accuracy of imaging techniques in NAC setting. 2) Inter/intraobserver variability, the reproducibility of diameter and the SUV measurement of target lesions were limited. An automatic measurement using emerging various computer aided diagnosis programs might overcome this. 3) The cut-off value of each imaging criterion was arbitrary. 4) The main problem in our study was that there are no widely accepted criteria for the response evaluation in the pathology. Especially, whether DCIS was or was not included in the definition of pCR might partly explain the difference observed in the DCE-MRI accuracy.
With these limitations, it is the first investigation to compare RECIST 1.1 criteria based on DCE-MRI measurements and PERCIST 1.0 criteria based on PET/CT measurements, which are both currently used as standard imaging response criteria in the clinical practice. Further studies or trials with a larger number of eligible study subjects are necessary to validate the ability of both, anatomical and functional response criteria for predicting the treatment benefit during NAC.
The conclusion of this study after summarizing all those results is that the MRI may be the best method for the response monitoring and assessment of residual lesions after NAC, although there was no statistically significant difference between the two (p = 0.15). Also, PET/CT is not superior to DCE-MRI. Despite its simplicity of both, RECIST 1.1 and PERCIST 1.0 criteria for the clinical use, the response assessment applying RECIST 1.1 and PERCIST 1.0 criteria had its limitations for an accurate assessment of residual tumor after NAC.

 XML Download