Abstract
Sclerotic bone lesions are common, but there are diverse groups of tumors and non-tumorous lesions. Although plain radiograph and computed tomography can reveal important characteristics of these lesions, diagnosis is often challenging for radiologists. A systematic approach and familiarity with the imaging features of various sclerotic bone lesions may be greatly helpful for eliminating in the differential diagnosis. This review describes the systematic approach to diagnosing sclerotic bone lesions based on imaging findings.
Bone sclerosis is defined as "an abnormal increase in density and hardening of bone" according to Biology online. In our clinical practice, sclerotic bone lesions are relatively common to be found on plain radiographs or CT scans. However, diagnosing the sclerotic bone lesions is often challenging for radiologists, and it would be greatly useful to differentiate these lesions by imaging criteria. To derive a systemic approach, we classified lesions by number, the extent of the sclerotic portion (focal, multifocal, or diffuse), and the tumor status (tumorous and non-tumorous conditions) (Fig. 1). To describe the focal patterns, we included location (intramedullary, cortical, and juxtacortical) and degree of homogeneity of sclerosis (homogeneous and heterogeneous) to the classification. In this article, we systematically described and illustrated important clues for the differential diagnosis of sclerotic bone lesions.
First, sclerotic lesions are classified into focal (solitary), multifocal, or diffuse, according to the number of lesions and the extent. The type with multiple lesions and relatively discrete border are classified as Multifocal (Figs. 2, 3, 4), and the lesions with indistinct border and large extent involving one or more anatomic site are classified as Diffuse (Fig. 5).
Focal lesions are classified as intramedullary, cortical, or juxtacortical, according to the location. Occasionally, locations provide crucial clues for diagnosis (1).
The next step involves the evaluation of degree of lesion homogeneity. Homogeneous density reflects a mixed pattern composed of osteoblastic and osteolytic portions (Fig. 7). The underlying osteolytic lesions containing scant or punctate mineralization such as enchondroma were excluded from this review. In osteochondroma, increased opacity by various degrees of endochondral mineralization was included as a sclerotic portion (1). In fibrous dysplasia (Fig. 6A, B), the degree of mineralization and the amount of woven bone ultimately determine the radiographic density of a lesion (2).
Although the radiographic findings may not allow tumorous and non-tumorous condition to be precisely differentiated, they may provide reliable information regarding aggressiveness or rate of growth. This information, coupled with patient's age and location of lesion, allows the formulation of a reasonable diagnosis in most cases (1). Additionally, tumorous lesions are categorized as benign or malignant.
Metastasis is the most commonly encountered malignant bone tumor. Thus, it can be included as malignant sclerotic bone tumor regardless of classification methods. Moreover, the first impression may be metastasis regardless of tumor morphology or number, even when a single, well-defined, sclerotic lesion is detected if patients had an underlying malignancy (Fig. 8).
The homogeneous pattern is relatively uncommon compared to the heterogeneous pattern. Therefore, knowing the homogeneously sclerotic bone lesions can be useful, such as enostosis (bone island) (Fig. 9), osteoma (Fig. 10), and callus or bone graft. The plain radiography and CT images of enostosis consist of a circular or oblong area of dense bone with an irregular and speculated margin, which have been described as 'thorny margins' or 'brush borders' (Fig. 9) (3). Osteomas appear on plain radiographs and CT as very dense, ivory-like sclerotic masses with a clear-cut outline growing from and attached to the external aspect of the cortical bone (Fig. 10) (3).
Characteristic imaging findings are more helpful for differential diagnosis, and some of the lesions can easily be diagnosed using only the plain radiographs or CT images. These lesions include melorheostosis (Fig. 11), osteopetrosis (Fig. 12), osteochondroma (Fig. 13), osteoid osteoma (Fig. 14A), fibrous dysplasia (Fig. 6A, B), osteopoikilosis, osteitis condensans ilii (Fig. 15), callus, osteophyte, osteonecrosis (Fig. 16), and heterotopic ossification. In melorheostosis, the epicenter is periosteal or endosteal. The appearance consists of cortical hyperostosis in one or multiple bones (4). The plain radiographic hallmarks of osteopetrosis are increased bone density, a lack of differentiation between the cortex and the medullary cavity, and occasionally a bone-in-bone appearance. The characteristic and pathognomonic findings of osteochondroma is cortical and medullary continuity between the lesion and parent bone by plain radiography (4). The most common appearance of osteoid osteoma is a cortically based lucent nidus centrally situated within the reactive sclerosis; this reactive cortical thickening may occasionally be so profound as to obscure the nidus. Central calcification may occasionally be visible within a radiolucent nidus surrounded by fusiform osteosclerosis, involving one side of a long bone diaphysis (3, 4). Fibrous dysplasia (Fig. 6A, B) is characterized by a "ground-glass" appearance on plain radiography, secondary to mineralized spicules of immature woven bone, sclerotic borders of varying thickness, endoteal scalloping, and altered and remodeled normal architecture (2). In osteitis condensans ilii (Fig. 15), bilateral (but can be also unilateral) osteosclerotic process in subchondral marrow adjacent to the sacroiliac joints and/or pubic symphysis usually occurs in women and is often associated with pregnancy (1). Prominent sclerosis is seen during the later phase of osteonecrosis (Fig. 16). Osteonecrosis in metaphyseal and diaphyseal regions of long bones often exhibit irregular peripheral zones of sclerosis within the marrow (1). Familiarity of these characteristic lesions may be helpful for differentiating many non-specific sclerotic lesions.
Ossifying fibroma (osteofibrous dysplasia) (Fig. 17), fibrous dysplasia (Fig. 6C), and adamantinoma (Fig. 18) are considered when a heterogeneously sclerotic lesion is cortically located. In osteofibrous dysplasia, the lesions are usually diaphyseal, especially involving the middle to distal third of the shaft and typically involving the anterior cortex (4). It occurs in the 1st or 2nd decade (4). Bowing and enlargement of the bones are seen, similar to intracortical osteolysis, and often with a characteristic of adjacent sclerotic band. Although the involvement of long bone in fibrous dysplasia is often intramedullary and diaphyseal, lesions may be eccentric (4). In adamantinoma, patients' age is usually 20-50 years. The location is most commonly in the tibia of the anterior cortex, the middle third of the anterior cortex, and the middle third of the diaphysis (4). This lesion may be locally aggressive.
On the other hand, in the case of osteosarcoma containing heterogeneously or homogeneously sclerotic portions representing osteoblastic matrix, all locations are possible (Fig. 19). The diagnosis of osteosarcoma may be possible based on age and relative characteristic imaging findings. The differentiation between osteoid (amorphous and cloudlike calcifications) and cartilage (well-defined punctuate opacities that often form circles or incomplete rings) matrix on images may be important clue for the differential diagnoses of bone tumors with mineralizations. On plain radiographic examination, the vast majority (approximately 90%) of osteosarcomas present with a variable amount of intralesional fluffy, cloudlike opacities, which are the characteristics of osteoid matrix production (5).
When focally cortical or juxtacortical thickening is the only finding, periosteal reaction by osteoid osteoma (Fig. 14B, C), healing or healed fracture including stress fracture, lymphoma (Fig. 20), sclerosing osteomyeltis of Garre, and Ewing sarcoma can be considered as differential diagnosis. In addition, when the common benign and aggressive periosteal reactions or margins are considered, benign and malignant lesions can be differentiated. The appearance of stress fracture consists of smooth cortical and endosteal thickening, sometimes associated with lucent foci (4).
Multifocally sclerotic lesions are nonspecific as an isolated finding, because they can be found in many other disorders, including osteopoikilosis, sarcoidosis (Fig. 2), POEMS syndrome (coined to refer to polyneuropathy, organomegaly, endocrinopathy, M protein, and skin changes) (Fig. 3), mastocytosis (Fig. 4), and tuberous sclerosis. Osteopoikilosis is characterized by multiple bone islands symmetrically distributed and clustered near articular ends of the bone. Although plain radiography is usually sufficient to make a diagnosis, questionable cases may require radionuclide imaging. However, in osteopoikilosis, a bone scan is relatively normal unlike that observed in metastatic disease (3). One study, conducted by Dispenzieri et al. (6) has reported 47% of POEMS patients with bone lesions had pure sclerotic lesion and that more than half of the patients with bony findings had more than one lesion. On plain radiographs or CT, the focal osseous lesions in POEMS syndrome are most commonly seen as either well-defined or fluffy sclerotic lesions or lytic lesions with peripheral sclerosis. Tuberous sclerosis and mastocytosis exhibit osteoblastic deposits predominantly in the spine or the innominate bone. Skeletal lesions are seen in 15% of children and 70% of adults with systemic mastocytosis. Futhermore, the sclerotic foci and septations seen on plain radiographs are consistent with the areas of fibrosis and osteoid formation (7).
In SAPHO (synovitis, acne, pustulosis, hyperostosis, and osteitis) syndrome, sternoclavicular joint is usually affected by hyperostosis and aseptic osteitis, which are considered as hallmark findings (Fig. 21) (8). Although these diseases are rare, we can make the diagnosis to some degree based on the involvements of other organs through the laboratory findings.
The non-tumorous conditions are more commonly found. The differential diagnoses for diffuse sclerotic lesions are including the following: metabolic disorders such as hyperthyroidism, hypoparathyroidism, renal osteodystrophy; fluorosis; myelofibrosis; mastocytosis; Hodgkin's lymphoma (Fig. 20); osteopetrosis (Fig. 12); osteoblastic metastases (Fig. 5); and Paget's disease (9). In the mixed phase of Paget's disease (Fig. 22), coarsening and thickening of the trabecula pattern and cortex are the characteristic radiographic findings. In the blastic phase, the areas of sclerosis, which can be extensive, may develop and obliterate the areas of previous trabecular thickening (10). In Paget's disease, osteoblastic activity is seen along all four margins of the vertebral body cortices, unlike the rugger jersey vertebrae observed in renal osteodystrophy, in which only the superior and inferior endplates are involved (10). In addition, the vertical trabecular thickening pattern observed in Paget disease is coarser than the more delicate pattern seen in hemangiomas, and this can be confusing (10). Fluorosis often appears as a dense diffuse osteosclerosis associated with osteophytes involving the spine, thorax, and pelvis (1).
Sclerotic bone lesions show various morphologies that range from definitely pathognomonic to non-specific and represent various disease entities. We hope the described systematic approach and familiarity with the imaging features of various sclerotic bone lesions will help in simplifying the differential diagnosis.
Figures and Tables
Fig. 1
Flow chart of sclerotic bone lesions.
Note.-BPOP = Bizzare periosteal osteochondral proliferation, FD = fibrous dysplasia, He = heterogeneous, Ho = homogeneous, LSMF = Liposclerosing myxofibrous tumor, N = non-tumorous condition, OM = osteomyelitis, OSA = osteosarcoma, POEMS = polyneuropathy, organomegaly, endocrinopathy, M protein, and skin changes, SAPHO = synovitis, acne, pustulosis, hyperostosis, osteitis, T = tumorous condition

Fig. 2
Sarcoidosis involving the spine. Abdomen CT image showing multifocal osteoblastic nodules in a vertebral body.

Fig. 3
POEMS syndrome with a 9-year history of diabetes, peripheral neuropathy, tightness of skin on both hands, pedal edema, increased hair growth, and skin darkening for 3 years. Coronally reformatted spine CT image revealing multiple punctuate osteoblastic lesions.
Note.-POEMS = polyneuropathy, organomegaly, endocrinopathy, M protein, and skin changes
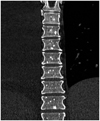
Fig. 4
Systemic mastocytosis involving pelvic bones. CT scan of pelvis showing multiple osteoblastic lesions at iliac and sacral bones.

Fig. 5
Osteoblastic metastasis from prostatic cancer. Plain radiograph showing diffuse, ill-defined sclerotic lesions through the spine, pelvic bones and both femurs.
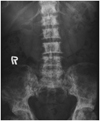
Fig. 6
Fibrous dysplasia.
A, B. Polyostoic fibrous dysplasia involving pelvic bones. Plain radiograph (A) and axial CT scan of pelvis (B) reveal ground glass appearance accompanied by bony expansion involving both ilii, left pubis, and ischium.
C. Cortical fibrous dysplasia of the tibia. Plain radiograph of the lower leg demonstrating a ill-defined, intracortically sclerotic lesion (arrows) in tibial diaphysis.

Fig. 7
Liposclerosing myxofibrous tumor of the femur.
A. Plain radiograph showing an ill-defined, mixed sclerotic and lytic lesion with a geographic pattern (arrows) in the intramedullary portion of the right femoral neck.
B. Corresponding coronal T1-weighted MR image showing a mixed signal intensity lesion including dark (sclerotic, arrowheads), low (myxoid, asterisk) and focal high (fat, arrow) signals.

Fig. 8
Single osteoblastic metastasis from pulmonary adenocarcinoma. Plain radiograph showing eccentrically locating, densly sclerotic lesion (arrows) in the proximal tibia. Imaging finding were non-specific.

Fig. 9
Enostosis (bone island) of the humeral head. This homogeneously sclerotic lesion with an irregular, spiculated margin (arrows) was incidentally noted in the humeral head on a plain radiogragh. The lesion margin has been described to resemble "thorny radiations" or a "brush border".
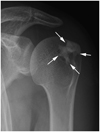
Fig. 10
Osteoma arising from the occipital bone. Axial CT scan shows sharply-defined dense, ivory-like sclerotic mass (arrows) with exophytic growing pattern abutting the occipital cortex.

Fig. 11
Melorheostosis of foot bones. Plain radiograph of the foot showing flowing cortical and endosteal hyperostosis (arrows) through the third metatarsal and lateral cuneiform bones.
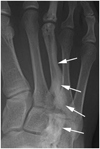
Fig. 12
Osteopetrosis of the entire skeleton. Plain radiograph showing densely sclerotic bones lacking differentiation between the cortex and medullary cavity in the entire skeleton.
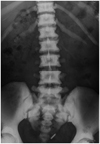
Fig. 13
Osteochondroma of the femur. Plain radiograph showing sclerotic lesion (arrows) composed of cortical and medullary bone protruding from and continuous with the lesser trochanter of femur.

Fig. 14
Osteoid osteoma.
A. Osteoid osteoma of the humerus. Plain radiograph of right humerus shows an dense sclerotic focus with a thin radiolucent rim, representing nidus (arrows) and surrounding cortical thickening involving the medial cortex of the diaphysis.
B, C. Osteoid osteoma of the femur. Plain radiograph showing only circumferentially cortical thickening (arrows) in the proximal diaphysis of femur (B). Corresponding axial CT scan showing a tiny, hypodense nidus (arrow) within the posterior cortex (C).

Fig. 15
Osteitis condensans ilii of the iliac side of sacroiliac joints. Plain radiograph of the pelvis shows sclerosis of the ilial portion of the sacroiliac joint, which remained intact.

Fig. 16
Osteonecrosis of the femur. Plain radiograph revealing irregular intramedullary sclerosis (arrows) in the distal femur.
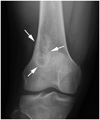
Fig. 17
Ossifying fibroma of the fibula. Plain radiograph of the lower leg showing a large, ill-defined sclerotic lesion with marked cortical expansion (arrows) in the fibular diaphysis.
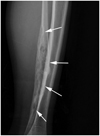
Fig. 18
Adamantinoma of the tibia. Lateral plain radiograph of the lower leg showing an irregular sclerotic lesion (arrows) within the anterior cortex of tibial diaphysis.
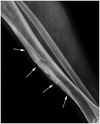
Fig. 19
Intramedullary osteosarcoma of the femur.
A. Plain radiograph revealing an ill-defined sclerotic lesion with aggressive periosteal reaction in the distal metadiaphysis of the femur.
B. Parosteal osteosarcoma of the distal femur. Plain radiograph of the knee showing an ossified exophytic tumor (arrows) on the surface of the femur. Osteolytic intramedullary extension was observed (arrowheads).

Fig. 20
Hodgkin's lymphoma of the femur.
A. Plain radiograph of the femur showing diffuse cortical thickening.
B. Diffuse marrow signal change of high signal intensity through the head, neck and diaphysis of right femur was observed on coronal T2-weighted fat-suppressed MR image (repetition time 2600 msec , echo time 100 msec).

Fig. 21
SAPHO syndrome.
A. Plain radiograph showing osteosclerosis and hypertrophy (arrows) in the medial portion of the clavicle.
B. Whole body bone scan shows increased uptake in sternoclavicular regions (white arrows), a small right axillary lymph node (black dotted arrow) after tracer leakage in the ipsilateral hand.
Note.-SAPHO = synovitis, acne, pustulosis, hyperostosis, osteitis

Fig. 22
Mixed phase of Paget disease of the pelvis. Anteroposterior plain radiograph showing extensive involvement with areas of cortical (iliopectineal, ilioischial lines, and cortex of the right femoral, arrows) and trabecular (arrowheads) thickening throughout the pelvis. Coxa varus deformity was noted in the right hip.

References
1. Meyers SP. MRI of bone and soft tissue tumors and tumorlike lesions: differential diagnosis and atlas. New York: Thieme;2008.
2. Kransdorf MJ, Moser RP Jr, Gilkey FW. Fibrous dysplasia. Radiographics. 1990; 10:519–537.
3. Cerase A, Priolo F. Skeletal benign bone-forming lesions. Eur J Radiol. 1998; 27:Suppl 1. S91–S97.
4. Levine SM, Lambiase RE, Petchprapa CN. Cortical lesions of the tibia: characteristic appearances at conventional radiography. Radiographics. 2003; 23:157–177.
5. Murphey MD, Robbin MR, McRae GA, Flemming DJ, Temple HT, Kransdorf MJ. The many faces of osteosarcoma. Radiographics. 1997; 17:1205–1231.
6. Dispenzieri A, Kyle RA, Lacy MQ, Rajkumar SV, Therneau TM, Larson DR, et al. POEMS syndrome: definitions and long-term outcome. Blood. 2003; 101:2496–2506.
7. Haney K, Russell W, Raila FA, Brower AC, Harrison RB. MRI characteristics of systemic mastocytosis of the lumbosacral spine. Skeletal Radiol. 1996; 25:171–173.
8. Boutin RD, Resnick D. The SAPHO syndrome: an evolving concept for unifying several idiopathic disorders of bone and skin. AJR Am J Roentgenol. 1998; 170:585–591.
9. Cloran F, Banks KP. AJR teaching file: diffuse osteosclerosis with hepatosplenomegaly. AJR Am J Roentgenol. 2007; 188:3 Suppl. S18–S20.
10. Smith SE, Murphey MD, Motamedi K, Mulligan ME, Resnik CS, Gannon FH. From the archives of the AFIP. Radiologic spectrum of Paget disease of bone and its complications with pathologic correlation. Radiographics. 2002; 22:1191–1216.


 PDF
PDF ePub
ePub Citation
 Print
Print


 XML Download