

 PDF
PDF ePub
ePub Citation
 Print
Print


Abstract
We studied the influence of proximal geometry on the results of computational fluid dynamics (CFD). We made five models of different proximal geometry from three dimensional angiography of 63-year-old women with intracranial aneurysm. CFD results were analyzed as peak systolic velocity (PSV) at inlet and outlet as well as flow velocity profile at proximal level of internal carotid artery (ICA) aneurysm. Modified model of cavernous one with proximal tubing showed faster PSV at outlet than that at inlet. The PSV of outlets of other models were slower than that of inlets. The flow velocity profiles at immediate proximal to ICA aneurysm showed similar patterns in all models, suggesting that proximal vessel geometries could affect CFD results.
Figures and Tables
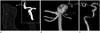 | Fig. 1Limitations of 3 dimensional surface modeling.
A. Approximated A2 segment of anterior communicating artery (circle) looks like bi-lobulated single vessel lumen on surface mesh model.
B. Basilar tip aneurysm shows donut-shaped filling defect due to non-opacified blood.
C. Three dimensional angiography from non-subtracted distal radiography shows stenotic lesion in middle cerebral artery and petrous carotid artery due to subtraction artifact by dense bone of skull base.
|
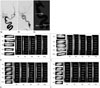 | Fig. 2Illustration of computational fluid dynamics of aneurysm models with variable geometry and length of proximal segment.
A. a, b: Left internal carotid angiogram shows almost 180° curve twice on a 54-year-old women. c: Edited level of each models.
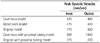
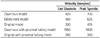
B. Peak systolic velocity of inlet in each models.
C. Peak systolic velocity of middle cerebral artery, outlet in each models.
D. Flow velocity profile at just proximal level of internal carotid artery aneurysm (diastolic phase).
E. Flow velocity profile at just proximal level of internal carotid artery aneurysm (systolic phase).
Note.-Mc = carvenous model, Mn = edited neck model, Mo = original model, Mop = original with proximal tubing model, Mp = cavenous with proximal tubing model
|
References
1. Kallmes DF. Point: CFD--computational fluid dynamics or confounding factor dissemination. AJNR Am J Neuroradiol. 2012; 33:395–396.
2. Milnor WR. Hemodynamics. 2nd ed. Baltimore: Williams & Wilkins;1982. p. 13–17.
3. Cebral JR, Mut F, Weir J, Putman CM. Association of hemodynamic characteristics and cerebral aneurysm rupture. AJNR Am J Neuroradiol. 2011; 32:264–270.
4. Korean Society of Stroke. Stroke. 1st ed. Seoul: Epublic;2009. p. 261–276.
5. Nakatani H, Hashimoto N, Kang Y, Yamazoe N, Kikuchi H, Yamaguchi S, et al. Cerebral blood flow patterns at major vessel bifurcations and aneurysms in rats. J Neurosurg. 1991; 74:258–262.
 XML Download