

 PDF
PDF ePub
ePub Citation
 Print
Print


INTRODUCTION
Gastrointestinal stromal tumors (GISTs) are the most common and comprise the majority of mesenchymal tumors of the gastrointestinal tract; unlike other tumors, they are considered potentially malignant (1). Surgery is the principal initial treatment for patients with an operable GIST, but curative therapy is difficult in more than half of patients with a malignant GIST due to the dispersed nature of the tumor, and high postoperative recurrence and metastasis rates are observed (40-90% of all surgically treated cases) (2, 3, 4). Malignant GISTs often fail to respond to treatment with conventional cytotoxic agents such as doxorubicin-based therapy and radiotherapy, and when there is a response, it is often not sustained (5, 6).
Imatinib mesylate (imatinib; formerly STI571), is a molecularly targeted drug that selectively inhibits constitutive activity of the KIT receptor tyrosine kinase in GIST cells. Imatinib reduces tumor size and arrests disease progression in > 80% of patients with advanced GIST (7, 8, 9). Adjuvant imatinib treatment also improves recurrence-free survival in patients with localized primary GIST (10).
Previous studies have indicated a dramatic change in tumor attenuation on contrast-enhanced computed tomography (CT) scans after imatinib treatment of a GIST, although the anatomical change (e.g., tumor size) was initially minor (11). Therefore, anatomic tumor response metrics can be misleading when applied to this molecular-targeted therapy. The Response Evaluation Criteria in Solid Tumor (RECIST) criteria, based on the sum of the longest diameters of the target lesions in the transverse plane, is the most widely used measurement system in clinical trials (12). However, a number of studies have shown that RECIST is inadequate for evaluating tumors treated with molecularly targeted drugs or locoregional therapies (13, 14, 15). Thus, several CT response criteria, such as the "Choi response criteria" (13, 14, 15) and the "modified RECIST (mRECIST) criteria" (16) have been proposed. Tumor changes in these criteria are assessed based on the CT attenuation coefficient (measured in Hounsfield units, HU) or only the enhancing area is incorporated into the changes in the response evaluation (17). These new criteria are reliable response evaluation methods for molecularly targeted agents, and radiologists need to evaluate changes in internal tumor attenuation for evidence of residual disease to determine if further treatment is required. Despite previous studies in which tumor attenuation changes of GISTs treated by imatinib were discussed, the correlation between CT and pathological findings are not fully understood, and only been a few incidental reports are available about the pathological changes underlying the CT attenuation of treated GISTs.
The purpose of this study was to investigate the correlation between changes in CT attenuation and GIST pathology after imatinib treatment and to present the pathological rationale for new proposed CT response criteria.
MATERIALS AND METHODS
Patients
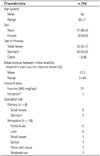
The Institutional Review Board of both institutions approved this retrospective study, and the requirement for informed consent was waived. A total of 26 patients, consisting of 17 men and 9 women with a mean age of 56 years (range, 36-71 years), with pathologically proven GIST were enrolled in an approved varied-dose trial of STI-571 (4-[(4-methyl-1-piperazynil)methyl]-N-[4-mepthyl-3-[[4-(3-pyridinyl)-2-pyrimidinyl]-amino]-phenyl] benzamide methane-sufonate; Gleevec® [imatinib mesylate]; Norvatis, Basel, Switzerland) at two institutions between August 2009 and May 2012. A single tumor was resected from each of these 26 patients after imatinib treatment. All tumors were resectable. Eight patients had a primary GIST (five had tumors in the small bowel and three had tumors in the stomach), and 18 patients had a single metastatic GIST (eight had tumors in the peritoneum, six had tumors in the liver, and one each had tumors in the small bowel, spleen, pelvic soft tissue, and mediastinum) (Table 1). The mean interval between initial imatinib treatment and the final follow-up CT before surgery was about 15 months. All patients underwent surgical resection within 2 months after the final follow-up CT. The electronic medical records of each patient were reviewed to establish the imatinib prescription.
Pathological Review
The pathologic records of each patient were reviewed to establish CD117 immunoreactivity (also known as proto-oncogene c-Kit or tyrosine-protein kinase Kit), which is a specific marker for GISTs among gastrointestinal tract tumors (8). The histopathology of surgical specimens was retrospectively assessed by a single gastrointestinal pathologist (13 years experience) for the presence of a viable hypercellular area and for the main secondary non-tumor findings within masses. Subsequently, the relevant CT scan was reviewed by radiologists to determine the relationship between CT and pathological findings.
Imaging
All CT scans were performed with three commercially available single-detector spiral CT scanners (Somatom Plus-S, Siemens, Erlangen, Germany; Somatom Plus 4, Siemens; Hispeed, GE Medical Systems, Milwaukee, WI, USA) or a multidetector-row CT scanner (LightSpeed QX/I; GE Medical Systems). Each patient was administered 100-120 mL iopromide (Ultravist 300® or Ultravist 370®; Schering, Berlin, Germany) or iopamidol (Iopamiro 300®; Braccco, Milano, Italy) through an 18- or 20-gauge angiographic catheter inserted in a antecubital vein with a mechanical injector (LF CT 9000; Liebel-Flarsheim, Cincinnati, OH, USA) at a rate of 2.5-3.0 mL/sec. CT scans were obtained during the portal venous phase (with a 72 second delay) after administration of contrast material. A helical CT image were obtained with a 7-8 mm collimation, a table pitch of 1.4, and 7-8 mm reconstruction intervals, whereas the multidetector row CT images were obtained with a 5-mm thick section, a pitch of 3:1 (high-quality mode), and 5-mm reconstruction intervals.
Image Analysis and Statistics
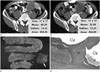
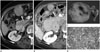
CT scans were retrospectively reviewed by two experienced gastrointestinal radiologists (13 years experience; 29 years experience) who provided a consensus report. The change in maximal diameter (unidimensional) of the masses before and after imatinib treatment based on RECIST 1.1 was recorded. A partial response (PR) for the unidimensional measurement approach was defined as > 30% reduction in tumor diameter, progressive disease (PD) as a > 20% increase in tumor diameter, and stable disease (SD) as a neither PR nor PD (18). A single radiologist (4 years experience) identified the area in which a significant interval change in CT attenuation occurred after imatinib treatment to objectively analyze tumor attenuation. The attenuation value of the masses before and after imatinib treatment was measured using the rectangular region of interest, encompassing as much as possible of the areas showing a significant change on the CT (Fig. 1).
The Kolmogorov-Smirnov test was used to determine whether the values were normally distributed. Statistical differences in the unidimensional maximal diameter of the tumor and CT attenuation values before and after imatinib treatment were analyzed with the paired t-test. Statistical differences in the change of the CT attenuation value according to the dominant pathological findings before and after imatinib treatment were analyzed with the Kruskal-Wallis and Mann-Whitney tests. All statistical analyses were performed using SPSS ver. 20.0 software (SPSS Inc., Chicago, IL, USA). A p-value < 0.05 was considered significant.
RESULTS
Clinical Features
All patients were administered a 400 mg oral dose of imatinib daily beginning in July 2009. The dose was reduced to 300 mg for 1 month in two patients due to a drug eruption; and administration of the drug was discontinued for 3 months in another patient due to cost. All other patients were treated continuously until surgery. Each patient underwent a baseline CT scan before starting imatinib treatment and a follow-up CT scan just prior to surgical resection. The mean interval between the initial prescription of imatinib and curative resection was 17.3 months (range, 3-44 months).
CT Findings
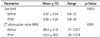
All surgically resected tumors were identified on CT scans. The mean size of the tumors was 6.97 ± 4.54 cm (range, 0.8-22 cm) prior to imatinib treatment and 5.58 ± 4.20 cm (range, 0.8-20 cm) on the final follow-up CT scan after imatinib treatment (Table 2). The mean size change in the tumors after imatinib treatment was a -1.4 cm (range, -7.8-2.5 cm) (p = 0.003). Nineteen of the 26 tumors were smaller after treatment, five increased in size, and the other two remained the same size. According to the RECIST guidelines, a PR was observed in 11 (42.3%) of the 26 tumors, whereas a SD and PD were observed in 13 (50%) and two (7.7%) tumors, respectively.
The mean CT attenuation value was 68.4 ± 21.9 HU (range, 17-103.7 HU) before imatinib treatment and 50.4 ± 26 HU (range, 18-102.4 HU) after imatinib treatment. CT attenuation values decreased in 20 (76.9%) of the 26 tumors after treatment, whereas the values increased in the remaining six tumors (23.1%) (Tables 2, 3). The mean attenuation decrease after imatinib treatment was 29.1 HU (range, 7.6-57.1 HU) in 20 of the 26 tumors (p = 0.001).
Histopathological Findings
Surgical specimens were available from all 26 tumors. Each GIST contained a variable amount of viable tumor together with non-tumorous tissue. CD117 expression was assessed immunohistochemically in all tumors. The main non-tumorous histopathological findings included hemorrhagic necrosis in seven tumors (26.9%), cystic degeneration in seven (26.9%), hyalinization in six (23.1%), and combined type findings in the remaining six tumors (23.1%), which contained a combination of hemorrhagic necrosis and hyaline and cystic degeneration. Two of these tumors with combined findings contained cystic degeneration and hemorrhagic necrosis without a viable tumor portion. The other four contained viable hypercellular areas with hyalinization and hemorrhagic necrosis but no cystic degeneration (Table 3). Finally, the histopathological features of the post-treatment GISTs were subdivided into five types.
Correlation between CT and Histopathological Findings
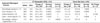
The CT attenuation values before and after imatinib treatment significantly varied in all five types of pathological features (p = 0.003). The changes in the CT attenuation values in tumors with a hyalinized change (n = 6) was more significant compared with that in the other pathological types (p < 0.05). No significant difference in CT attenuation change was observed among the four other pathological features.
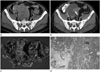
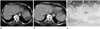
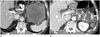
Twenty of the 26 tumors (77%), in which the CT attenuation value was lower on the final follow-up CT compared to the baseline CT, showed different types of dominant non-tumorous histopathological findings (Table 3). Six of these tumors (30%) exhibited cystic degeneration (Fig. 1), six (30%) showed hemorrhagic necrosis, six (30%) showed hyalinization (Figs. 2, 3), and two (10%) were of a combined type with a mixture of cystic degeneration and hemorrhagic necrosis. The remaining six tumors (23%) showed increased CT attenuation after treatment, four of which showed abundant viable tumor cells on histological examination, one of which showed hemorrhagic necrosis with hypercellular viable portion, and the last one of which showed cystic and hyaline changes in the viable portion underlying a predominant cystic mass before treatment. As an ancillary finding, a myxoid change was observed in one tumor with dominant hemorrhagic necrosis, and abundant calcification was noted in one other tumor with dominant hyalinization after imatinib treatment (Fig. 4).
Most tumors (21 of 26, 80.7%) were smaller (n = 19) or did not change (n = 2) in size after treatment. Of these, 15 (74%) showed decreased CT attenuation, but the other six (26%) had increased CT attenuation despite having decreased in size, and four of these showed abundant viable tumor cells on a histological examination (Fig. 5). These four tumors with high residual tumor cellularity had decreased in size after treatment, resulting in SD for one patient and PR in three other patients based on RECIST 1.1. In contrast, none of the five tumors that increased in size showed hypercellularity, although two of these patients showed PD based on RECIST 1.1 (Table 3).
We also assessed the correlation between secondary histopathological findings according to the duration of imatinib treatment and the resected tumor site (Table 4). Hemorrhagic necrosis was most commonly observed in tumors originating from the small intestine. Among the small bowel tumors (n = 6), five showed hemorrhagic necrosis and one showed cystic changes after treatment. A cystic change (n = 7) was most commonly observed in hepatic tumors (n = 4). The combined type of lesion with hypercellularity was only observed in peritoneal tumors.
DISCUSSION
Many reports are available regarding changes in CT features of GISTs following imatinib treatment (14, 19, 20, 21). However, most only provided a limited description of the histopathological changes associated with CT findings. In this study, the 26 treated tumors showed a high degree of variability based on the histopathological examination of GISTs after imatinib treatment; the non-tumorous portion included hemorrhagic necrosis, cystic degeneration, hyalinization, and combined pathology with or without viable tumor cells. We found that most tumors decreased in size; however, five of the 26 tumors grew, even though they eventually responded to imatinib treatment. The CT attenuation values also changed after imatinib treatment in most tumors; reduced attenuation was seen in 20 of 26 tumors, whereas increased attenuation was seen in the other six tumors; four of which contained a large proportion of viable cells and two residual tumors, which showed hemorrhagic necrosis without a viable portion, and a hyaline change in a predominant cystic mass. Our results show that increased CT attenuation after imatinib treatment was highly associated with residual viable tumor, and a weaker correlation was detected between an increase in GIST size after imatinib treatment and the proportion of viable cells. We assumed that hyperattenuation of the hemorrhage or fine septations of the cystic mass as well as the marked decrease in size of the tumor may have contributed to increase the CT attenuation in the two residual tumors. In particular, the last tumor showing increased attenuation may have been a measurement error due to the crowding effect of fine septations after the marked decreased in tumor size.
Six tumors with a dominant hyaline change showed the most prominent decrease in CT attenuation after imatinib treatment compared to other four dominant pathological types. The other four types, but not the combined type tumors with increased attenuation (hypercellular areas with hyalinization and hemorrhagic necrosis), showed similar CT attenuation values after imatinib treatment (Table 3). High CT attenuation (mean, 83.2 HU) before treatment in hyalinized tumors contributed to the most prominent change in CT attenuation. Some limitations of this study should be explained as it was impossible to confirm which histopathological feature contributed to the relatively high CT attenuation before surgery and the exact mechanism for the hyaline change in the tumors during imatinib treatment.
The main reason for reduced tumor attenuation was an apparent reduction in the proportion of viable and hypervascular tumor tissues after imatinib treatment. Of the four patients with a tumor showing a highly residual viable portion after treatment, one achieved SD and the other three achieved PR based on the RECIST criteria. However, it is likely that they will eventually progress and develop resistance, as their tumors contained a high proportion of residual viable cells compared to tumors showing decreased attenuation after treatment.
Some authors have reported the correlation between CT and pathological findings of surgically resected GISTs after imatinib treatment. Oh et al. (22) reported a few viable spindle cells and marked hyalinization of three stomach GISTs after neoadjuvant imatinib treatment. Dennis and Damjanov (7) reported that the most frequent changes found in resected GISTs after imatinib treatment were hyalinization and scarring. Additionally, myxoid degeneration, fibrosis, hemosiderin deposition, and infiltration of inflammatory and foam cells were common, whereas tumor necrosis was rare.
The exact pathophysiological basis for the relationship between the histopathological and CT findings is unknown (23), although some investigators have proposed a model in which tumor hypoattenuation arises after imatinib treatment. Imatinib, like other molecularly targeted agents, has both cytostatic and cytotoxic effects, and apoptosis (programmed cell death), rather than necrosis, may play a role in the killing of cells within GISTs following imatinib treatment (24).
Quantifying tumor burden using a CT and radiological response evaluation based on the RECIST criteria is an important surrogate marker for the therapeutic response in clinical trials of anticancer agents. However, several studies have indicated that the RECIST criteria, which use only tumor size in the response evaluation, are insufficient for monitoring GISTs during imatinib treatment or for hypervascular tumors such as hepatocellular carcinoma (13, 14, 15). As a result, several response criteria such as the "Choi response criteria" and the "mRECIST criteria for hepatocellular carcinoma" (16) have been proposed. The results of our study show that these new criteria more accurately reflect the pathological changes in treated GISTs.
In summary, reduced CT attenuation value in GISTs after imatinib treatment reflect hyalinization, cystic degeneration, and/or hemorrhagic necrosis with little viable tumor, whereas increased CT attenuation reflects the high possibility of residual hypercellular viable tumor with non-tumorous changes. Based on this histopathological background, changes in CT attenuation may indicate a satisfactory chemotherapeutic effect, even though the tumor has actually increased in size after imatinib treatment and even if the tumor is smaller after treatment. An increase in tumor attenuation may indicate that the chemotherapeutic effect is actually limited and there may be eventual progression and development of drug resistance.
Our study had several limitations, including its retrospective nature. First, the dominant pathological finding did not allow us to determine whether tumor shrinkage was due to chemotherapy or reflecting the natural course of the tumor. The second concern is that CT attenuation was not measured using a pre-enhanced CT scan. Increased attenuation in a tumor after imatinib treatment can be overestimated because of recent hemorrhagic necrosis. Finally, the radiologic changes were not directly correlated with the gross and microscopic pathological findings.
In conclusion, our results show that histopathological findings of GISTs treated with imatinib accurately reflect the changes on a CT scan, and this may be helpful when assessing the GIST response evaluation.
 XML Download