

 PDF
PDF ePub
ePub Citation
 Print
Print


INTRODUCTION
Coexistence of renal angiomyolipoma (AML) and renal cell carcinoma (RCC) without underlying tuberous sclerosis is a rare condition. The simultaneous occurrence of renal AML and RCC in the same kidney is even less common, with only two cases among a series of 5800 nephrectomy cases (1). To our knowledge, there are only three cases in the radiologic literature, and only one case report on this condition without evidence of tuberous sclerosis has been published (2,3,4).
We experienced two patients who had RCC and renal AML simultaneously in the same kidney without underlying tuberous sclerosis. It is important to radiologically differentiate a RCC from an AML to decide on treatment. This report emphasizes several radiologic features that help differentiate RCC from non-fatty components of AML.
CASE REPORT
Case 1
A 65-year-old female presented to the emergency room with an acute onset of right flank pain and gross hematuria that occurred one day earlier. There were no other unusual findings in her past medical history and family history. She was taking antihypertensive medication. No abnormalities were found on the physical examination.
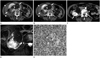
Contrast-enhanced abdominal computed tomography (CT) revealed a large, lobulated contoured fatty mass in the right kidney with a surrounding hematoma. The fatty mass was thought to be a ruptured AML. Contrast-enhanced CT demonstrated a 1.9-cm avidly enhancing mass, which was initially considered a non-fatty component of the AML, in the peripheral portion of the fatty mass (Fig. 1A, B). Because the most likely cause of perirenal hematoma was thought to be rupture of the fatty mass associated with the AML, we performed an emergent angiography, which showed multiple microaneurysms and contrast extravasation. Selective arterial embolization was successfully implemented with microcoils and Gelfoam.
During an 18-month follow-up, additional selective arterial embolizations and a single laparoscopic cryoablation were performed to reduce the size of the large fatty mass in the right kidney. During the cryoablation procedure a biopsy was performed for the fatty renal mass, and AML was diagnosed by histologic analysis. A CT scan performed 31 months after initial embolization showed a newly developed calcification in the enhancing mass.
The size of fatty components of the AML and the renal parenchyma decreased on serial follow-up CT scans. However, the enhancing mass on the initial CT scan, which had previously been thought to be a non-fatty component of the AML, gradually increased in size up to 4.6 cm over the 55-month follow-up period (Fig. 1C). In addition, the mass showed strong contrast enhancement on the corticomedullary phase and wash-out on the excretory phase. There were no apparent findings of any invasion to adjacent structures or lymphadenopathies in the upper retroperitoneum on the follow-up CT scans.
Contrast-enhanced, diffusion-weighted magnetic resonance imaging (MRI) was subsequently performed for further characterization of the enhancing and gradually enlarging mass in the right kidney. The mass appeared hypointense on T1-weighted images and hyperintense on T2-weighted images compared with the surrounding renal parenchyma (Fig. 1D). Strong contrast enhancement on the corticomedullary phase and wash-out on the excretory phase, identical to the previous CT scans, were evident. On diffusion-weighted images, the mass appeared hyperintense on the high b value (800 sec/mm2) image and showed a low diffusion coefficient value on the apparent diffusion coefficient (ADC) map.
Fluorine 18 fluorodeoxyglucose (FDG) positron emission tomography/CT (PET/CT) scan of the lesion showed intensively increased metabolism and no evidence of distant metastasis.
The relatively rapid growth evident in the follow-up CT scans, strong contrast enhancement on the corticomedullary phase and excretory phase wash-out, diffusion restriction on MRI, and hypermetabolism on FDG PET/CT indicated the potential for a malignant tumor, such as RCC. Appropriately, the patient therefore underwent ultrasonography-guided biopsy, and histologic examination confirmed the diagnosis of RCC. Right radical nephrectomy was performed. Surgical pathology revealed a large fatty mass and an adjacent solid mass surrounded by a fibrous capsule. The solid mass was diagnosed as a clear cell carcinoma with Fuhrman grade 3 that did not show adjacent tissue invasion or sarcomatous differentiation (Fig. 1E). The postoperative course was uneventful and the patient was well at the 7-month follow-up after surgery.
Case 2
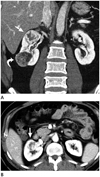
A 45-year-old male patient was admitted because of two incidental masses in his right kidney. He did not show any signs or symptoms. Routine preoperative laboratory tests, including urinalysis, were normal. Initial abdominal ultrasonography carried out for general examination revealed two masses in the kidney. The lower pole mass was an approximately 4.0-cm well-defined hyperechoic mass, and the upper pole mass was a 3.7-cm subtle hypoechoic mass. On contrast-enhanced abdominal CT, the lower pole mass was composed of soft tissue components presenting moderate prolonged enhancement and abundant gross fat components (Fig. 2A). In contrast, the upper pole mass showed heterogeneous strong enhancement on the corticomedullary phase and wash-out on the excretory phase (Fig. 2B). The masses were presented in the same kidney but completely separated. The patient underwent laparoscopic right radical nephrectomy. The diagnoses of a clear cell carcinoma for the upper pole mass and an AML for the lower pole mass were confirmed by a pathologic examination. There were no remarkable postoperative complications or tumor recurrences during a 1-year follow-up.
DISCUSSION
Angiomyolipomas are mixed mesenchymal tumors composed of smooth muscle, mature adipose tissue, and thick-walled vessels. They can develop from any region but occur most commonly in the kidneys (5).
Concurrent RCC with AML could be incidental or related to AML pathogenesis. AMLs are associated with tuberous sclerosis and the incidence rates of bilateral or multifocal AMLs are high among patients with tuberous sclerosis (5). However, the relationship between tuberous sclerosis and RCC remains unclear (6). The two presently described patients had no clinical evidence of tuberous sclerosis, except for the renal AMLs. Based on the results of pathologic and immunohistochemical examination of two cases, Mai et al. (7) suggested the possibility of developing a concurrent RCC from either the same stem cells as AMLs or from a component of an AML. However, this does not explain the separate presentation of AML and RCC, as in case 2.
AMLs can increase in size on follow-up examinations and the average doubling time is 1620 days (8). This was calculated by including both fatty components and non-fatty components, but in most cases of AML the size of the fatty components increased and any increase in size of non-fatty components was primarily due to hemorrhage inside the mass. The growth rate of RCCs varies widely, but Lee et al. (9) reported that the average doubling time was 505 days. When the non-fatty components of a renal mass shows a relatively high rate of increase in size, RCC might be considered if the possibility of hemorrhage can be ruled out using CT or MRI. In case 1, hemorrhage could be excluded on the follow-up CT scans and the doubling time calculated by the Schwartz equation was 431 days.
Generally, clear RCCs show strong contrast enhancement on the corticomedullary phase and wash-out on the excretory phase, whereas AMLs usually show less intense enhancement on corticomedullary phase on CT scan and no wash-out on nephrographic and excretory phases (5). Recently, Vargas et al. (10) reported that renal AMLs show maximum enhancement on the corticomedullary phase and wash-out on the nephrographic and excretory phases. So, close follow-up imaging or biopsy is warranted when non-fatty, solid masses are detected beside or apart from the fat-containing AML, with strong contrast enhancement on the corticomedullary phase.
In case 1, gross calcification was detected in the mass on the follow-up CT scan. Intratumoral calcification detected on CT scans is not an uncommon finding in RCCs but is rare in AMLs (11). Although various signal intensities are evident in RCCs on MRI, with the exception of papillary RCCs they generally show hyperintensity compared with normal renal parenchyma in T2-weighted images. No study has yet focused only on the non-fatty component of AML, but it is known that AMLs with minimal fat show lower signal intensity than normal renal parenchyma in T2-weighted images, probably because of the muscle component (12).
AMLs show a lower ADC value than RCCs, likely due to the fat and muscle components (13). Because fatty components are hypointense in diffusion-weighted images as a result of fat suppression, AMLs can be differentiated from other lesions in which diffusion restriction is present. Zhang et al. (14) reported ADC value of non-fatty components and RCC of 1.717 ± 0.431 × 10⁻³ mm2/sec and 1.264 ± 0.271 × 10⁻³ mm2/sec, respectively. In our study, the ADC value of the enhancing mass in case 1 was as low as 0.806 × 10⁻³ mm2/sec.
In summary, we experienced two cases of concurrent RCC and AML in ipsilateral kidneys. Radiologic features including arterial enhancement and delayed wash-out, T2 hyperintensity, low ADC value, and rapid growth can be clues indicating the possibility of simultaneous occurrence of RCC in patients with AML.
 XML Download