

 PDF
PDF ePub
ePub Citation
 Print
Print


INTRODUCTION
Pleurodesis is defined as the formation of a symphysis between the visceral and parietal pleura that prevents accumulation of air or liquid in the pleural space (1). Pleurodesis is performed by introducing sclerosing agents into the pleural cavity or by surgical abrasion of the pleura (2). Although a number of other sclerosing agents have been used for pleurodesis, talc is considered the best sclerosant based on success rates (3, 4). Talc induces an intrapleural inflammatory response and plural fibrosis that obliterate the pleural space (2).
Pleural changes after talc pleurodesis include pleural thickening, nodularity, formation of pleural masses, and residual effusion (5, 6). Focal areas of high attenuation within the pleural changes representing talc deposition and dystrophic calcification can be seen on computed tomography (CT) (2, 5, 7). Recent reports have documented talc-related fluorodeoxyglucose (FDG) uptake within high-attenuation areas (8-16). Pleural changes after talc pleurodesis make it difficult to distinguish between benign inflammatory processes and malignant pleural lesions, particularly in patients with a history of underlying malignancy.
The purpose of this study was to characterize the CT and FDG-positron emission tomography (PET)/CT findings of benign pleural changes and compare them to those of recurrent malignant pleural lesions after talc pleurodesis in patients with a history of underlying malignancy.
MATERIALS AND METHODS
Patients
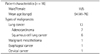
From January 2004 to December 2011, 194 patients who had undergone talc pleurodesis at our institution were retrospectively reviewed. Of these, we enrolled 16 patients who had a history of malignancy and who underwent follow-up CT and FDG-PET/CT scans. The mean age of the study group was 54 years (range, 41-76 years). Eleven patients were male and five were female. The underlying malignancies were lung cancer (n = 13), malignant mesothelioma (n = 1), esophageal cancer (n = 1), and cervical cancer (n = 1). Patient characteristics are listed in Table 1. Six patients had no evidence of active pleural disease (group 1) and 10 patients had recurrent malignant pleural lesions (group 2). Group 1 was pathologically confirmed by percutaneous needle biopsy (two patients) or clinically regarded as having benign conditions. Group 1 did not show evidence of recurrent pleural lesion based on imaging studies and clinical follow-up of at least 6 months. The mean follow-up period for group 1 was 16 months (range, 6-23 months). Group 2 was confirmed to have recurrent malignant pleural lesions such as pleural or mediastinal invasion and metastasis based on clinical presentation and follow-up studies. The mean follow-up period of group 2 was 9 months (range, 4-16 months). Our institutional review board approved this retrospective study and did not require informed patient consent.
CT Scans
CT scans were acquired by a helical technique using a Somatom Plus-4 (Siemens Medical Solutions, Erlangen, Germany) or a Somatom Sensation 64 (Siemens Medical Solutions) scanners. Scanning was performed from the lower part of the neck to the middle portion of the kidneys. All scanning was performed after intravenous (IV) administration of contrast medium (140 mL Iopamidol, Pamiray 300, Dongkuk Pharm., Seoul, Korea) with a power injector (Mallinckrodt, Tyco and Vistron CT, Medrad, Arrendale, PA, USA) at an injection rate of 2.5 mL/sec. The scanning parameters were 120 kVp; 90 and 150 mA; beam width, 2.5 mm; and table speed, 15 mm per rotation. Data were interfaced directly to a picture-archiving and communicating system (PACS; Marosis m-view, Infinitt, Korea), which displayed all image data on two monitors (1536 × 2048 image matrices, 8-bit viewable gray scale, and 60-foot-lambert luminescence). Scans were viewed with both mediastinal (window width, 400 H; window level, 20 H) and lung (window width, 1500 H; window level, -700 H) window settings.
PET/CT Scanning
All patients fasted for at least 6 hours and had a serum glucose level < 140 mg/dL before the IV injection of FDG. Scans were acquired for 60 minutes after administration using a PET/CT system (CTI, Knoxville, TN, USA) consisting of a full-ring PET scanner and a dual-detector-row spiral CT scanner (Somatom Emotion duo, Biograph, Erlangen, Germany). CT scans were performed from the head to the pelvic floor according to a standard protocol with the following settings: 130 kVp; 30 mA; tube rotation time, 0.8 seconds per rotation; pitch, 6; and section thickness, 5 mm to match the PET section thickness. Immediately after non-enhanced CT, PET was performed in the identical transverse field of view. PET datasets were obtained via iterative reconstruction with an ordered subset expectation maximization algorithm and by the application of segmented attenuation correction (two iterations, 28 subsets) to CT data. Co-registered scans were displayed using software that enabled image fusion and analysis.
Imaging Analysis
Imaging analyses were performed using morphologic CT findings including shape (nodular, linear, and patchy), thickness (mm), average attenuation [Hounsfield unit (HU)], and degree of enhancement (HU) of the pleural lesions. Attenuation (HU) was measured using the elliptical region of interest (ROI) around high-density pleural lesions, and the degrees of enhancement were recorded as the difference in attenuation between enhanced and non-enhanced images. The highest metabolic activity was evaluated using measurements of maximum standard uptake values (SUVmax) within the same ROI used for the average attenuation measurements. When a patient had two or more discontinuous lesions, images were separately evaluated for each lesion. All measured values were compared between groups 1 and 2.
Statistical Analysis
Differences in lesion shape and additional findings between groups 1 and 2 were assessed using Fisher's exact test. The Mann-Whitney U-test was used to compare thickness, attenuation, degree of enhancement, and SUVmax. p-values < 0.05 were considered significant. Statistical analysis was performed using PASW statistics 20 (SPSS Inc., Chicago, IL, USA).
RESULTS
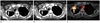
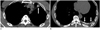
Characteristic high-density pleural deposits with contrast enhancement on CT and increased uptake on FDG-PET/CT were seen along the pleural thickening in 15 patients (Fig. 1). The total number of pleural lesions was 22, and the mean number of pleural lesions per patient was 1.4 (range, 1-3). Five patients had two or more discontinuous lesions (Fig. 2).
Shape
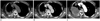
Of 22 pleural lesions, there were nodular patterns in three lesions (group 1, n = 2; group 2, n = 1), linear patterns in 10 (group 1, n = 5; group 2, n = 5), and patchy distributions in nine (group 1, n = 3; group 2, n = 6) (Figs. 2, 3). The shapes of the pleural lesions are summarized in Table 2. No significant differences were observed in lesion shape between groups 1 and 2 (p = 0.607).
Pleural Thickening
The thicknesses of the pleural lesions varied widely on CT (mean, 13.4 mm; range, 4.9-62.3 mm). The mean thicknesses of the pleural lesions were 11.7 mm (range, 7.0-16.9 mm) and 14.8 mm (range, 4.9-62.3 mm) in groups 1 and 2, respectively. No significant differences were observed in pleural thickening between the groups (p = 0.356).
Attenuation and Enhancement
The majority of pleural abnormalities were associated with areas of high attenuation (mean, 131 HU; range, 28-251 HU). The mean attenuations of the pleural lesions were 166 HU (range, 65-251 HU) in group 1 and 101 HU (range, 28-218 HU) in group 2. Attenuation of pleural lesions was significantly higher in group 1 than that in group 2 (p = 0.030). After contrast administration, all pleural lesions except two showed increased attenuation of 20 HU or more. One of the two unusual lesions belonged to group 1, and the other belonged to group 2. The mean degree of enhancement for all lesions was 40 HU (range, 5-73 HU). Although most pleural lesions showed contrast enhancement, the degree of enhancement was significantly higher in group 2 than that in group 1 (p = 0.048) (Fig. 3). The mean degree of enhancement was 29 HU (range, 5-62 HU) and 48 HU (range, 12-73 HU) in group 1 and group 2, respectively.
Maximum Standard Uptake Value
The areas of SUVmax corresponded to high attenuation pleural abnormalities in all lesions (mean, 12.04; range, 4.34-42.65). The mean SUVmax of pleural lesions was 10.89 (range, 7.74-18.25) and 12.99 (range, 4.34-42.65) in groups 1 and 2, respectively. No significant differences were observed between the groups (p = 0.598). Values for pleural thickening, attenuation, degree of enhancement and SUVmax are summarized in Table 3.
Additional Findings
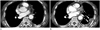
Pleural effusions (n = 5) and other pleural thickenings without high-density foci (n = 4) were seen only in group 2 (Fig. 4). However, the frequencies of pleural effusion and other pleural thickening were not significantly higher in group 2 than those in group 1 (pleural effusion, p = 0.093; other pleural thickening, p = 0.234) (Table 3).
DISCUSSION
Bethune (17) previously described anatomic changes in the pleura following talc pleurodesis in animal studies and observed that despite uniform scattering of talc powder over the pleura during thoracotomy, the powder subsequently accumulated into well-demarcated nodules. Jones (18) also described the presence of talc granulomata and pleural fibrosis after talc pleurodesis. Granulomatous giant cell reactions surrounding talc crystals in the pleura have been described in recent studies (6, 19).
The CT appearance of pleural changes after talc pleurodesis has not been widely reported. Murray et al. (5) observed typical findings after talc administration that presented as variable degrees of pleural thickening and nodularity with focal high attenuation areas. Narayanaswamy et al. (2) also described the presence of high-density deposits after talc pleurodesis. Various shapes and locations of lesions may occur because the appearance of talc-related pleural lesions is greatly influenced by the method of talc administration and the position of the patient (5). Most deposits have been described as linear or nodular pleural lesions (2, 5). Similar morphological findings were also observed in our study. Among the diverse shapes of deposits, a patchy and linear pattern was much more frequently observed than a nodular pattern. However, no differences were observed between benign and malignant samples.
There is controversy regarding the degree of contrast enhancement in talc-related pleural lesions. Kwek et al. (10) described seven patients who underwent CT scans with and without IV contrast and found no evidence of increased enhancement in areas of pleural thickening after contrast administration. In contrast, Avila et al. (7) observed contrast enhancement in stable pleural lesions after talc pleurodesis and proposed that fibrotic tissue within the pleural lesion may variably enhance depending on the amount of vascular granulation tissue. In our study, all pleural lesions except two showed increases in attenuation of 20 HU or more after contrast enhancement. Moreover, the degree of enhancement was significantly higher in recurrent malignant lesions than benign pleural changes.
The SUVmax of pleural lesions was not significantly different between the two groups. According to previous studies, pleural macrophages are activated during the inflammatory process after talc pleurodesis and are the most likely cause of pleural FDG uptake (11). Increased FDG uptake is persistent after talc pleurodesis, which indicates chronic influx and efflux of inflammatory cells (14). The stability of talc lesions on PET and PET/CT scan has been observed in case reports of patients followed for up to 42 years after talc pleurodesis (8-12, 15, 16, 20).
CT appearance after talc pleurodesis may simulate other conditions such as recurrence or metastasis, particularly in patients with a history of malignancy. Characteristic pleural thickening with high attenuation and a history of pleurodesis helps clinicians differentiate talc deposits from diverse pleural abnormalities (2). The use of FDG-PET/CT to distinguish malignant pleural involvement from benign inflammatory processes after talc pleurodesis remains challenging. Pleural lesions with increased FDG uptake that correspond to high attenuation on CT in patients with a history of talc pleurodesis is a typical finding of reactive inflammation (21). In contrast, pleural lesions without high-density foci associated with FDG uptake in follow-up studies should raise suspicion for malignant lesions.
In our study, pleural effusions and other pleural thickenings without high-density foci were seen only in the recurrent malignant group. Although the frequencies were not statistically significant between the two groups, we believe that these additional findings can be used to distinguish recurrent malignant lesions from benign pleural changes after talc pleurodesis.
Our study had limitations. First, it was a retrospective analysis of a small patient sample. Second, only two patients had histologically proven diagnoses by percutaneous biopsy. In the remaining patients, the lesions were assumed to be benign or malignant on the basis of follow-up imaging and clinical findings. Although not ideal, this is a recognized method for assessing pleural recurrence or metastasis. Third, we regarded the tumors as benign or malignant without confirming each lesion in patients with multiple lesions, which is a considerable weakness because benign and malignant lesions may exist concurrently in one patient.
In conclusion, pleural changes after talc pleurodesis are revealed as high-density pleural thickening with increased FDG uptake in both benign inflammatory processes and malignant lesions in patients with a history of malignancy. Malignant pleural lesions were characterized by lower pre-contrast attenuation and higher contrast enhancement, whereas benign pleural changes after talc pleurodesis were characterized by higher precontrast attenuation and lower contrast enhancement on CT. Our findings may help clinicians distinguish recurrent malignant pleural lesions from benign inflammatory processes after talc pleurodesis in patients with a history of malignancy.


 XML Download