

 PDF
PDF ePub
ePub Citation
 Print
Print


INTRODUCTION
Quantitative techniques including fluorodeoxyglucose positron emission tomography, perfusion CT, and dynamic contrast material enhanced magnetic resonance imaging (DCE-MRI) have recently been used for differentiating benign and malignant lesions (1-5). Among these, DCE-MRI was able to assess endothelial volume transfer, providing information about pharmacokinetic parameters such as volume transfer constant (Ktrans), the rate constant that represents transfer of the contrast agent from the extravascular extracelluar space (EES) to the blood plasma (Kep), and extravascular extracellular volume fraction (ve) (3-5). Using these parameters, DCE-MRI has been used in the diagnosis and management of many oncological cases, including arteribreast, bone, abdomen, and hematologic cancers (6-10).
However, it is still not easy to apply DCE-MRI to pulmonary lesions due to motion artifacts caused by respiration, cardiac pulsation, relatively low spatial resolution, and low reproducibility. Recently, studies have been reported that compare malignant and benign lung lesions from the enhancement pattern of DCE-MRI using kinetic and morphologic parameters (11-14). To the best of our knowledge, however, no study has been conducted that differentiates benign from malignant pulmonary lesions using quantitative perfusion parameters.
The purpose of our study was therefore to determine whether tissue permeability factor (Ktrans, Kep, or ve) on DCE-MRI can help to discriminate between malignant and benign pulmonary nodules or masses.
MATERIALS AND METHODS
Patient
A total of 43 consecutive patients with diagnosis of pulmonary nodules or masses underwent DCE-MRI from June 2010 to May 2011. All data were retrospectively reviewed and the study received institutional review board approval. However, informed consent was not waived for all patients. Inclusion criteria were as follows: 1) pulmonary nodule or mass sizes between 1 cm and 5 cm on chest CT regardless of enhancement; 2) pulmonary nodules or masses had been pathologically proven using biopsy after patients underwent MRI; 3) subjects had not undergone radiation therapy or chemotherapy previously if they had been diagnosed with lung cancer. Subsequently, 11 patients were excluded from analysis because their pulmonary lesions were unable to be detected correctly on dynamic contrast-enhanced MR images due to combined pneumonia or atelectasis. Two patients were excluded from post-processing analysis owing to substantial motion artifact. Finally, the remaining 30 patients (14 women, 16 men; median age, 64 years; age range, 41-80 years) were included in this study. Among the 30 nodules or masses, 15 were benign, including chronic granulomatous inflammation with/without necrosis (n = 7), nonspecific chronic inflammation (n = 4), organizing pneumonia (n = 2), and fibrotic nodule (n = 2). Fifteen cases of malignancy were detected, including adenocarcinoma (n = 9, mean size: 32.8 ± 1.25 mm) and squamous cell carcinoma (n = 6, mean size: 40 ± 1.05 mm). All 30 pulmonary nodules or masses were histologically proven by percutaneous transthoracic needle biopsies (n = 28) and transbronchial lung biopsies (n = 2). Biopsies were routinely performed before initiating the appropriate therapy. In addition, 5 patients subsequently underwent lung resection.
MR Protocol
All patients underwent MR imaging, which was performed with a 3.0-T (Magnetom Verio, Siemens Healthcare, Erlangen, Germany) in the supine position. A six-channel phased-array body coil with parallel imaging capability was placed over the thorax to reduce susceptibility artifacts and improve imaging quality. Initially, scout images were obtained using turbo-inversion recovery with a coronal plane. Subsequently, pre-contrast three-dimensional (3D) T1-weighted volumetric interpolated breath-hold examination (VIBE) sequences using different flip angles (2° and 15°) were obtained for anatomic images. All images were obtained in the transverse plane. The MRI scanning range was applied differently in each case to include the entire tumor within a volume of section. After the pre-contrast phase was completed, DCE-MRI was performed using a 3D T1-weighted VIBE sequence with a 15° flip angle (repetition time/echo time: 3.78/1.28, flip angle: 15°, matrix: 184 × 256, field of view: 350 × 350, slice thickness: 5 mm, slice per slab: 30, bandwidth: 450 Hz/pixel, NEX: 1, scan time: 4 min 57 s). Thirty-five dynamic measurements were performed. The acquisition time was 8.5 seconds with a single dynamic measurement. After the first three measurements, an intravenous bolus of 0.1 mmol gadobutrol (gadolinium-DO3A-butriol, Gadovist 1.0; Bayer HealthCare, Berlin, Germany) per kilogram of body weight was injected at amounts of 10 cc at 3 mL/sec using a power injector (Spectris®; Medrad, Pittsburgh, PA, USA). DCE-MRI obtained the repeated acquisition of a VIBE sequence before, during, and after a contrast agent.
Image Analysis and Statistical Analysis
Post-processing of all DCE-MRI data was performed by using a commercial software tool (Tissue 4D; Siemens Healthcare, Erlangen, Germany). Initially, motion correction was carried out automatically, after which we registered morphological and pre-contrast data to the dynamic series using software (Tissue 4D; Siemens Healthcare, Erlangen, Germany). A value for the arterial input function was automatically calculated using the software without an arterial region of interest (ROI). After obtaining a kinetic modeling parameter map, ROI was drawn on the post-contrast subtracting image. The ROIs were drawn along the contours of each pulmonary nodule to encompass the entire tumor; this was performed by a radiologist who was blind to the patient history with care taken to exclude areas of artifact and blood vessels. One month later, the same radiologist again drew the ROIs along contours of pulmonary nodules to obtain the average value of parameters. Three parameters, Ktrans, ve, and Kep were automatically calculated from the fitted model and concentration curve. Finally, the means of these parameters of pixels within the drawn regions of interest were recorded for all patients. Ktrans is the volume transfer constant that represents the transfer of contrast agent between the blood plasma and the EES (min-1). Kep is the rate constant that represents transfer of the contrast agent from the EES to the blood plasma (in min-1), and ve = Ktrans / Kep is the volume of EES per unit volume of tissue (5).
Statistical analysis was performed using a Graphpad prism, version 5.0 (GraphPad Software, San Diego, CA, USA). A Mann-Whitney test was used to compare the age, sex, size, location, and distribution of benign lesions with malignant lesions. A Mann-Whitney test was also used to calculate the statistical significance of quantitative perfusion parameters as follows: upper lobe vs. middle/lower lobe, central vs. peripheral, size (less than 30 mm, more than 30 mm), and benign vs. malignant nodules or masses. Receiver operating characteristic analysis was also performed for the evaluation of the sensitivity and specificity of perfusion parameters for diagnosis of malignancy. p < 0.05 was considered to be statistically significant.
RESULTS
The characteristics of our patients are shown in Table 1. No significant difference occurred in sex, location, or distribution between benign and malignant pulmonary lesions. However, the age and size of lesion of the malignant group were significantly greater than those of the benign group (p = 0.032 and 0.005, respectively).
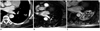
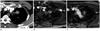
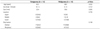
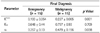
Table 2 and 3 show the quantitative perfusion parameters for the location and size of pulmonary lesions regardless of benignancy and malignancy. No significant difference of quantitative perfusion parameters occurred for the location and size of pulmonary lesions, regardless of the presence of malignancy. Table 4 shows the quantitative perfusion parameters between benignancy and malignancy of lesions regardless of size. Among the three perfusion parameters, the Ktrans and ve values showed a significant difference. The mean Ktrans and ve values of malignant lesions were significantly higher than those of benign lesions (0.227 ± 0.065 vs. 0.133 ± 0.054; p = 0.001, 0.479 ± 0.156 vs. 0.357 ± 0.13; p = 0.038, respectively) (Figs. 1, 2). However, the difference in Kep between the two groups was not significant. With a Ktrans value threshold of 0.202 (min-1), the sensitivity and specificity of Ktrans value were 66.6% and 93.3%, respectively, for differentiating malignant from benign pulmonary lesions. Meanwhile, the sensitivity and specificity of Ktrans value at a threshold of 0.158 (min-1) were 93.3% and 66.6%, respectively, for predicting malignancy. To produce a specificity of 100% while we maximized sensitivity, the optimal Ktrans threshold values for the prediction of differentiation of malignant pulmonary lesion from benign lesion was greater than 0.23 (min-1).
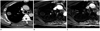
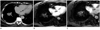
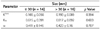
Table 5 shows the quantitative perfusion parameters between benign lesions and malignant lesions according to size. In lesion size of less than 30 mm, no significant difference of perfusion parameters was detected between benign and malignant lesions. Meanwhile, in lesion size of more than 30 mm, only the Ktrans values of malignant pulmonary lesions were significantly higher than the benign lesions (0.233 ± 0.07 vs. 0.104 ± 0.054; p = 0.007) (Figs. 3, 4).
Among malignant lesions, no significant difference of perfusion parameters between squamous cell carcinomas and adenocarcinomas was detected (mean Ktrans; 0.256 ± 0.076 vs. 0.208 ± 0.052, mean Kep; 1.183 ± 1.431 vs. 0.54 ± 0.221 mean ve; 0.451 ± 0.172 vs. 0.497 ± 0.152).
DISCUSSION
Recently, quantitative perfusion parameters using DCE-MRI are emerging as potential methods for differentiating benign from malignant lesions (15-20). Many investigators have suggested that Ktrans measured using DCE-MRI shows relatively high sensitivity and specificity for differentiating normal from cancerous tissue in colorectal and prostate cancer in selected patients (21-23). Similar to these results, our study demonstrated a significant difference in Ktrans value between benign and malignant pulmonary nodules or masses measured using DCE-MRI. Considering that Ktrans is positively coupled to blood flow, endothelial permeability and surface area, high Ktrans values imply an increased vascular permeability with disease progression such as malignant status (24). Meanwhile, Ng et al. (25) suggested that tumor size is not a significant variable for Ktrans, at least in the range of tumor size; that is, 2.5-9.3 cm. However, in our study, we found that Ktrans was affected by the size of the pulmonary lesion. In Ktrans values of lesions more than 30 mm in size, a statistically significant difference occurred between benign and malignant pulmonary nodules. This might be explained by the relative paucity of the functional blood vessels in small tumors, even if highly permeable. In addition, our results show no significant difference of perfusion parameters between squamous cell carcinomas and adenocarcinomas. The high Ktrans values of both malignant groups might be explained by the mean size of lesions of over 30 mm for both malignant groups.
In adenocarcinoma, the poorly represented microvascular component could be explained by the functional impairment of the vessel, incompletely formed, and by the presence of a prominent stromal matrix that embeds the vessels (26). This could also explain why small malignant pulmonary nodules have relatively low Ktrans values. Thus, we suspect that perfusion parameter values would be compromised with smaller pulmonary lesions. Our study shows that the Ktrans value was a useful parameter for discriminating malignant from benign pulmonary lesions. The Ktrans threshold value of more than 0.23 (min-1) shows 100% specificity for the differentiation of malignant from benign pulmonary lesions.
The range of Ktrans values of malignant pulmonary nodules or masses in our study is 0.16-0.39 min-1 (mean value = 0.227 ± 0.065 min-1). Our results differ from those of prior studies. Ng et al. (25) reported Ktrans values for liver and lung tumors in the range of 0.028-0.16 min-1. Galbraith et al. (27) reported Ktrans values for a variety of tumors in the range 0.07-1.03 min-1. Ktrans values for a variety of tumors are influenced by various factors such as permeability of vascular surface area, contrast of concentration in the vessel as well as vascular density, blood flow, and cardiac output (28). In our study, the high osmolar MR contrast was twice that of the high Ktrans in malignant nodules or masses than Ng et al. (25). We then demonstrated that the mean value of Ktrans in malignant nodules or masses can be affected by MR contrast concentration.
Another quantitative parameter, ve, representing the volume fraction of the contrast agent in the extravascular extracellular space, increases in proportion to capillary leakage (29). Much attention has been given to the change of ve before and after treatment; recently, ve has been regarded as a prognostic parameter for the outcome of cancer treatment, especially chemotherapy or radiotherapy (30). However, discrepancies between studies remain. A study of prostate cancers showed that no significant difference was shown in perfusion parameters (ve) between prostate tumors and benign inflammations (31). Furthermore, some overlaps still appear to exist in the enhancement patterns between tumors and benign areas of the peripheral zone such as those affected by prostatitis, post-biopsy hemorrhage, and benign prostatic hyperplasia (31). In our study, however, a marginally significant difference was detected in the ve value between benign and malignant pulmonary lesions of more than 30 mm size. In pulmonary lesions less than 30 mm in size, no significant difference of ve value was detected between benign lesions and malignant lesions. This might be due to tumor angiogenesis, characterized structurally by abnormal blood vessels lacking the vessel hierarchy and having a heterogeneous distribution, while the extravascular extracellular space could vary according to lesion size (24). These results suggest that ve values may not be important biomarkers to discriminate benign and malignant pulmonary nodules or masses.
Our study also suggests that tumor location in the lung was not a significant variable for all three perfusion parameters, regardless of benignancy and malignancy. This suggests that perfusion parameters may not be influenced by location or zonal distribution of lesions, but of course must exclude other abnormalities such as pneumonia. However, this speculation will need further experimental studies for confirmation.
Our study has several limitations. First, we did not fully exclude tumor necrosis in the selection of ROIs and we did not consider hotspot areas in the tumors. Thus, the quantitative parameters from the axial T1 weighted MR imaging might not reflect the tumors' real burden. Second, the total number of pulmonary lesions studied was relatively small. In particular, the numbers of pulmonary lesions according to size may be too small to perform reliable comparisons of the subgroup of benign and malignant lesions presented here. As such, a further study with a larger patient group and a more extensive histological type should be performed to appraise the diagnostic value of DCE-MRI in pulmonary lesions. Thirdly, the within-patient coefficients of variation for Ktrans for lung lesions was known to be about 20% because of MRI susceptibility artifacts, vascular pulsation artifacts, and difficulty in delineating tumor margins (25). Because we did not assess the intra-individual variability of pharmacokinetic parameters in our patient population, our data might not be widely accepted due to decreased confidence.
In conclusion, our study shows that the Ktrans values of malignant pulmonary lesions are higher than those of benign pulmonary lesions, and that the optimal value of Ktrans shows high sensitivity and specificity for pulmonary malignant nodules or masses. Thus, the Ktrans value of perfusion parameters on DCE-MRI can help to discriminate between benign and malignant pulmonary nodules or masses.


 XML Download