

 PDF
PDF ePub
ePub Citation
 Print
Print


INTRODUCTION
Hepatocellular carcinoma (HCC) is the fifth most common tumor in the world, and the incidence of HCC has been increasing rapidly, especially in western countries (1, 2). Imaging diagnosis is essential for planning the treatment and management of HCC. Contrast-enhanced ultrasound, contrast-enhanced computed tomography (CT), and magnetic resonance imaging (MRI) have made it possible to accurately detect and characterize HCC (3-5). MRI is particularly useful due to its high tissue contrast and the availability of tissue-specific contrast agents. Various liver-specific MRI contrast agents have been introduced to increase the accuracy of hepatic imaging (6-8). Gadoxetic acid (Eovist or Primovist, Bayer Schering: Berlin, Germany) has been approved for hepatic imaging and is being widely used (9-12). It is a liver-specific hepatobiliary contrast agent which can also be used extracellularly. It is taken up by functioning hepatocytes and up to 50% is excreted into the bile (9, 13). There have been several reports stating that gadoxetic acid-enhanced (Gdx) MRI improves the detection of HCC (4, 10, 11, 14). Furthermore, hepatobiliary phase imaging assists in surgical planning (14).
Recently, diffusion-weighted imaging (DWI) has been applied to liver MRI. DWI is sensitive to the molecular diffusion of water in biological tissues, and recent technological advancements in MRI have enabled the production of high quality DWI images on the liver. DWI is therefore often incorporated into routine liver MRI. It has been reported that DWI improves the accuracy of detection of hepatic metastases as compared to that of superparamagnetic iron-oxide (SPIO)-enhanced MRI (15). Moreover, higher signal to noise ratio at 3 T allows the use of higher b values, which are more sensitive to diffusion and less sensitive to transverse relaxation time (T2) and perfusion-related motion (16-18). However, the magnetic field inhomogeneities that degrade diffusion-weighted images are exacerbated at 3 T (19-21). It is important to assess the diagnostic value of DWI for the detection of HCC in a high field system because 3 T MRI is widely used for routine liver imaging (19, 20). To our knowledge, there has been no literature comparing the diagnostic performances of DWI and gadoxetic acid-enhanced MR imaging for the detection of HCC in the 3 T system. Therefore, the purpose of this study is to compare DWI, gadoxetic acid-enhanced MRI, and a combination of both techniques for the detection of HCC at 3 T.
MATERIALS AND METHODS
Patients
This study was approved by our institutional review board, and informed consent was not required due to its retrospective nature. By searching the radiological reports of the Department of Radiology between May 2007 and January 2009, a total of 143 patients who underwent gadoxetic acid-enhanced and diffusion-weighted MRI for evaluation of HCC were found. MRI examinations had been performed for ruled out or confirmed HCC because of suspected focal hepatic lesions on ultrasound or CT or due to elevated levels of serum tumor markers (alpha-fetoprotein or protein induced by vitamin K absence-II). The exclusion criteria were patients with a prior history of transarterial chemoembolization (TACE) (n = 60), radiofrequency ablation (n = 6), or more than five HCCs (n = 12). A total of 65 patients (56 men, 9 women; range 36-80 years, mean age 58.5 years) were included in this study. 49 patients had solitary lesions, 13 had two lesions, and three had three lesions. 51 patients had hepatitis B-related cirrhosis, 5 had hepatitis C-related cirrhosis, 2 had alcoholic cirrhosis, and the remaining 7 had no known underlying diseases. A total of 84 HCCs were identified in these 65 patients. A diagnosis of HCC was based on surgical findings (n = 31), percutaneous biopsy (n = 5), a typical clinical history and tumor marker levels in combination with lipiodol uptakes after TACE or the progressions of the disease as depicted on follow-up CT or MRI obtained at least one year after the initial imaging (n = 30).
Magnetic Resonance Imaging
All MRI examinations were performed using a 3 T imaging system (MAGNETOM Tim Trio, Siemens Healthcare sector, Erlangen, Germany), equipped with a phased-array coil (MAGNETOM Tim Trio, Siemens, Erlangen, Germany). We did not use any anti-peristaltic agents or oral contrast agents.
The MRI protocol consisted of a breath-hold transverse T1-weighted in- and out-of-phase two-dimensional gradient-recalled echo (GRE) sequence [repetition time (TR)/in-phase echo time (TE), 150/2.4 msec; out-of-phase TE = 1.2 msec; flip angle, 65°; field of view, 32-38 × 25-29 cm; matrix, 256 × 256; section thickness, 6 mm; slice spacing, 1.2 mm; one signal acquired; number of slices = 30]; a single slice turbo spin echo (TR/TE, 466/148; field of view, 32-36 × 25-29 cm; matrix, 288 × 230; section thickness, 4 mm; slice spacing, 1 mm) using the spectral fat suppression technique; and a breath-hold transverse three-dimensional (3D)-GRE (TR/TE, 2.5/0.9 msec; flip angle, 13°; field of view, 32-36 × 25-36 cm; matrix, 320 × 224; section thickness, 2 mm; no gap; acquisition time, 23 sec).
For contrast-enhanced dynamic MRI, the gadoxetic acid disodium (Eovist or Primovist, Bayer Schering; 0.025 mmol/kg) was injected as a rapid bolus, immediately followed by a saline flush of 15-20 mL. A 3D spoiled GRE sequence with chemically selective fat suppression was performed during suspended respiration 30-35 seconds (arterial phase), 65-70 seconds (portal phase), 100-120 seconds (hepatic venous phase) and five minutes (equilibrium phase) following the injection of the intravenous contrast agent. Additional hepatobiliary phase images were obtained 20 minutes after injection. An automatic infusion system (Sonic shot 50, Nemoto Kyorindo Co., Ltd., Tokyo, Japan) was used. The actual pulse sequence started manually when the fluoroscopic sequence revealed that the contrast material bolus had reached the abdominal aorta.
Respiratory-triggered fat-suppressed single-shot echo-planar diffusion-weighted imaging was performed in the transverse plane with tri-directional diffusion gradients by using three values (b values = 0, 50, 800 s/mm2). The other parameters for DWI were as follows: TR/TE, 2000/88; flip angle, 150 degrees; field of view, 400 mm; matrix, 192 × 108; section thickness, 5 mm; slice spacing, 6 mm; one signal acquired; number of slices = 96.
Image Analysis
Two radiologists (H.S.H., Y.E.C. with nine and five years of experience in abdominal imaging, respectively) independently reviewed three sets of MR images in random order: the DWI set [unenhanced T1-weighted images, DWI, and apparent diffusion coefficient (ADC) map]; the Gdx set (unenhanced, gadoxetic acid-enhanced dynamic and hepatobiliary phase images); and a combination set of both techniques. The two observers were blinded to the patient history, laboratory results, findings of other imaging modalities and final diagnosis. The interval between the reviews of the two sets of images was at least one month. The criteria for diagnosis of HCC were as follows (12-14, 22, 23): I) a nodule with increased enhancement on arterial phase and washout on late venous or equilibrium phases; II) a nodule with arterial enhancement and hypointensity on hepatobiliary phase; III) a nodule larger than 1.5 cm with no uptake of contrast agent on hepatobiliary phase images; IV) a nodule showing hyperintensity on DWI and with almost equivalent or lower ADCs as compared with that of the surrounding liver parenchyma. Each observer recorded the possibility of HCC for each lesion with the following four-point confidence rating scale: 1, definitely not HCC; 2, probably not HCC; 3, indeterminate; 4, probably HCC; 5, definitely HCC. Lesions rated as a 4 or 5 were classified as positive. Each lesion was documented as accurately as possible according to sizes and segmental locations using the template. All images were reviewed using a local picture archiving and communication system monitor (Centricity; GE Medical systems, Milwaukee, WI, USA). By comparing the scoring results from the two observers with the standard of reference, we calculated the number of true-positive, true-negative, false-positive and false-negative lesions for each observer. Quantitative analyses of ADCs were not performed because the aim of this study was to compare the sensitivity for detections of HCC.
Statistical Analysis
Statistical analyses were performed using statistical software (SPSS version 14.0, SPSS Inc., Chicago, IL, USA; MedCalc version 9.3.6.0, Mariakerke, Belgium). An alternative-free response receiver operating characteristic (ROC) curve was fitted to each observer's confidence ratings using maximum likelihood estimation. Sensitivity of MRI for detecting HCCs were calculated according to the lesion sizes. The generalized estimating equation method was used to compare the sensitivities, specificities, positive predictive values, and negative predictive values of the three MRI sets (Gdx, DWI, and the combined). Sensitivities were calculated as the number of true-positive lesions divided by the total number of HCCs. p values less than < 0.05 were considered statistically significant.
RESULTS
The areas under the ROC curve (Az) for each observer's ability to detect HCCs are shown in Table 1. The Az values for the Gdx and DWI sets were not significantly different when considering all lesions. The difference in Az values between the Gdx and DWI sets was statistically significant (p = 0.04) for observer 1 when considering lesions larger than or equal to 2 cm. The combination of the two techniques did not increase the Az values for either observers.
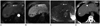
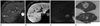
Of a total of 84 HCCs, observer 1 detected 71 lesions using Gdx MRI (85%) and 57 lesions were detected on DWI (68%), whereas observer 2 noted 75 lesions using Gdx MR imaging (89%) and 64 lesions using DWI (76%) (Fig. 1). Thirty-six lesions were located in the subphrenic (n = 30) or subcardiac area (n = 6), with 48 lesions located elsewhere. The sensitivities of detection of HCCs in the two image sets for the two observers are shown in Table 2. Overall, the sensitivities in the Gdx set (mean of 73 lesions detected) were significantly higher than those in the DWI set (mean of 60.5 lesions detected) (p = 0.0004 for observer 1 and p = 0.0012 for observer 2). When lesions smaller than 2 cm were considered, the DWI set yielded a significantly lower sensitivity as compared to either the Gdx set or the combination of both sets (p = 0.0186, 0.0001 for observer 1 and, p = 0.0005, 0.008 for observer 2, respectively) (Fig. 2). The sensitivity of observer 2 was not statistically significant when lesions larger than or equal to 2 cm were considered (p = 0.1731). The combination of both techniques did not increase the sensitivities of detecting HCC for either observer. Although the sensitivity of the combination set (92%) in observer 1 was higher than that of the Gdx set (85%), it did not reach statistical significances (p = 0.292). In observer 2, the sensitivity of the combination set (93%) was lower than that of the Gdx set (95%) (p = 0.412), which was not statistically significant.
The diagnostic performance, including the sensitivities, specificities, with positive and negative predictive values for HCC detection for each reviewer and for each image set, is summarized in Table 3. For observer 2, specificity with DWI set was higher than Gdx set, while for observer 1, specificity with DWI set was lower than Gdx set. There were no significant differences among the mean positive predictive values and negative predictive values for the three image sets.
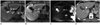
Eight lesions in 29 patients, which were confirmed via histopathological exam or imaging follow-up, but were not detected with a high confidence score of 4 or 5 by either observers on any image set, and were thus deemed false-negative lesions. In the Gdx lesion set, 14 lesions in 12 patients were not detected with high confidence by either of the observers. For the DWI set, 31 lesions in 27 patients were not detected with high confidence by either of the observers. All lesions detected in the DWI set were also seen in the Gdx set. Eight lesions (0.7-2.3 cm in size) were not noted in the DWI set, but were visualized in the Gdx set. The rates of false-positive reports for all lesions were 6.1% (6 of 98) for observer 1 and 7.1% (7 of 98) for observer 2, with a mean false positive rate of 2.5% (5 of 196) for Gdx set, 1.5% (3 of 196) for DWI set, and 4.5% (9 of 196) for combined set. In the Gdx set, four lesions in four patients were erroneously interpreted as positive findings, while in the DWI set, two lesions in two patients were erroneously interpreted as positive findings. The combined set showed five false-positive findings in five patients. On retrospective review, the false-positive interpretations for the Gdx set and combined set were attributed to presumed dysplastic nodules (Fig. 3).
DISCUSSION
This study found that gadoxetic acid-enhanced dynamic and hepatobiliary phase MRI is more sensitive for detecting HCC than the DWI when using 3 T MRI. Additions of DWI to gadoxetic acid-enhanced dynamic and hepatobiliary phase MRI did not increase the diagnostic performances for HCC detections. It has been indicated that detection and precise localization of HCC are known to be difficult with DWI alone because of its poor anatomic capabilities (24-26). Moreover, DWI has lower resolutions than hepatobiliary phase MRI and may lead to poor depictions of small focal hepatic lesions (26). All lesions detected on DWI were also seen on dynamic and hepatobiliary images. Therefore, we believe that DWI may not be helpful for the detection of HCC with 3 T MRI. Although sensitivity for HCC detection was increased in gadoxetic acid-enhanced dynamic and hepatobiliary phase of MRI as compared to that of DWI, the Az values for HCC detection did not reach statistical significances. This may be attributed to false positive findings in the hepatobiliary phase images. Small hepatic nodules (1-2 cm) only being noted on hepatobiliary phase imaging may lead to a false positive diagnosis of HCC, resulting in a lower Az value.
The potential usefulness of DWI for detecting and characterizing focal hepatic lesions including HCCs and metastases has been reported (25-29). In addition, combined reading of DWI and T2-weighted images were found to be superior to the SPIO-enhanced MRI (25, 26, 30), and the addition of DWI to conventional diagnostic criteria increased the sensitivity for HCC diagnosis (23). However, it is important to emphasize that most studies which evaluate the usefulness of DWI in the diagnosis of hepatic tumors use 1.5 T MRI scanners (23, 31, 32). Recently, 3 T MRI imaging is widely used in clinical practices because it allows high spatial and temporal resolution by increasing the signal-to-noise ratios. Higher b values are used for 3 T MRI, resulting in increased sensitivity to diffusions and less sensitivity to transverse relaxation time (T2) and perfusion-related motion (33). Therefore, 3 T scanners with DWI are widely used for routine liver MRI. Unfortunately, the magnetic field inhomogeneities that degrade DWI are increased with 3 T (19-21). Two important shortcomings of DWI are artifacts caused by cardiac motions and a susceptibility to artifacts caused by air (17, 26). Therefore, the subcardiac or subphrenic signal loss may significantly decrease the sensitivity for the detection of HCC in the left lobe or the hepatic dome. Our study results suggest that the degradation of DWI at 3 T outweighs the benefit of using DWI. Optimization of DWI at 3 T remains a work in progression, and future technical advancements could aid to overcome the low specificity and image quality of DWI.
Although DWI has been incorporated into the routine liver MRI protocol, it may not be helpful for diagnosis and characterization of HCC. DWI has been reported to be an unreliable predictor of local HCC recurrence after transarterial chemoembolization as compared to gadolinium-enhanced MRI (34), and it did not appear to contribute to the detection of HCC with well-differentiated components (31, 35). The limited performance of DWI for the detection of HCC is probably due to the cirrhotic or fibrotic background in patients with HCC. The presence of increased connective tissues in the cirrhotic liver is poor in protons and the decrease of blood flow results in restricted diffusions on DWI (18). Therefore, the lesion-to-liver contrast between the tumors and background liver may not be evident on DWI. Parikh et al. (25) found a sensitivity of 80.5% for HCC detection by DWI. In our study, the sensitivity (76%) was similar to the previous study for HCC detection using DWI, while increased sensitivity (89%) was achieved with dynamic and hepatobiliary phase imaging.
A hepatobiliary contrast agent provides both a dynamic and hepatobiliary phase. Previous studies have shown that a combination of dynamic imaging and a hepatobiliary phase improves HCC diagnostic performance (4, 14). Three-dimensional GRE MRI using a hepatobiliary contrast agent provides thin sections with no gaps, high signal-to-noise ratio, and high sensitivity for detecting sub-centimeter-sized hepatocellular lesions (5, 36-38). Three-dimensional GRE MRI also avoids the respiratory or susceptibility artifacts that are a problem in DWI. Therefore, gadoxetic acid-enhanced MRI appears to be better than DWI for the diagnosis of HCC when considering both diagnostic performances and image qualities of 3 T MRI.
Our results suggest that the addition of DWI to dynamic and hepatobiliary phase imaging may not be helpful for the detection of HCC. Nishie et al. (31) reported that an SPIO-enhanced MRI + DWI set outperformed the SPIO-enhanced set in HCC depiction when using a 1.5 T scanner. The average area under the ROC curve (Az) of the SPIO-enhanced MRI + DWI set (Az = 0.870) was significantly higher than that of SPIO-enhanced set (Az = 0.820) for detecting HCC. In our study, the combined interpretation of both DWI and gadoxetic acid-enhanced MRI did not increase the diagnostic performances of HCC detection. It has been reported that DWI may not contribute to the detections of HCC with well-differentiated components (27, 31). However, the gadoxetic acid-enhanced hepatobiliary phase of MR imaging has been reported to be useful for preoperative diagnosis of early HCC in a preliminary report (14). Therefore, gadoxetic acid-enhanced MRI appears to be more beneficial than DWI for depicting HCC. Cirrhotic patients with suspected HCC and impaired hepatobiliary enhancement due to decreased hepatic functions may benefit from DWI because it can detect HCCs in the absence of contrast materials (27). DWI can also be used for screening patients for hepatocellular lesions, by reducing the number of overlooked lesions.
HCC size is an important prognostic factor for patient survivals. Gadoxetic acid-enhanced dynamic and hepatobiliary phase of MRI have been reported to be helpful for the detection of small HCCs (4). However, DWI may simulate suspicious lesions and result in false-positive findings due to susceptibility artifacts. Sub-centimeter-sized hepatocellular lesions in the subphrenic space or left hepatic lobe may be missed due to artifacts. Furthermore, DWI with a high b value may not be superior to standard T2-weighted imaging in terms of lesion conspicuity of small HCCs in cirrhosis (39). In our study, when lesions smaller than 2 cm were considered, the DWI set had a significantly lower sensitivity as compared with either the Gdx set alone or the combination of both sets. However, small sized lesions (1-2 cm) only seen when using the hepatobiliary phase are also problematic. Because there are definite overlaps of size between early HCC and dysplastic nodules, indeterminate lesions may lead to false positive diagnoses. Further studies are needed to better define the criteria of early HCC.
Our study had several limitations. First, since we did not obtain a biopsy of every hepatic nodule, thus, not all lesions were histopathologically confirmed. However, if we had included only those lesions confirmed by histopathology, there would have been a chance of verification bias. Second, small (< 1.5 cm) nodules only seen on the hepatobiliary phase images were regarded as benign when there was no proven evidence of HCC during a follow-up period of one year. Given that an early HCC may require a substantial amount of time to increase in size, it may have been too early to determine whether those lesions were truly benign. The fates of indeterminate lesions should be documented in a long-term follow-up study. Third, optimization of DWI sequence parameters remains a work in progress for 3 T MRI. Further technical advancements could help overcome the problems of image quality in DWI while maintaining the specificity of 3 T MRI.
In conclusion, the gadoxetic acid-enhanced dynamic and hepatobiliary imaging was superior to DWI for detecting HCC with 3 T MRI. Additions of DWI to the dynamic and hepatobiliary imaging did not contribute to the detections of HCC.


 XML Download