

 PDF
PDF ePub
ePub Citation
 Print
Print


INTRODUCTION
CT and magnetic resonance imaging (MRI) are the two selected imaging modalities for the diagnosis and staging of head and neck tumors. Although both diagnostic tools have high accuracies for detecting and staging such cancers, the imaging features of benign and malignant head and neck lesions are often nonspecific and overlapping, because these techniques evaluate the macroscopic morphologies of biologic tissues and do not reflect microstructural differences (1). Although both diagnostic tools have high accuracies for detecting and staging such cancers.
However, advanced MR techniques are being developed which provides information concerning the metabolic, molecular and pathophysiological aspects of tumors; and imaging biomarkers are important tools for the detection and characterization of cancers and for monitoring the response to therapy.
Diffusion-weighted imaging (DWI) is a non-invasive technique that analyzes the structures of biologic tissues at the microscopic level. Furthermore, DWI has the advantages of being non-invasive, thus, requiring no exogenous contract agents or ionizing radiation, it owns a short imaging time and can be easily incorporated into routine evaluations (2, 3).
Several studies (4-7) have suggested that DWI could be used to differentiate and characterize head and neck lesions and to monitor responses to therapy. Recently, DWI has been used clinically to differentiate benign and malignant head and neck lesions. In this paper, we review the role and utility of DWI for assessing head and neck tumors and discuss the limitations and future perspectives.
THE BIOLOGICAL CONCEPT OF DWI IN HEAD AND NECK TUMORS
Biological tissues are composed of intra- and extra-cellular compartments. In these tissues, water molecules are in a state of continuous exchange between these two compartments. In the human body, free diffusion of water molecules does not exist due to restrictions imposed by cell membranes and molecular boundaries.
The biophysical mechanism underlying DWI is based on the different microscopic mobilities of water molecules in biological tissues. This mobility or Brownian motion, is highly influenced by the cellular environment, and is restricted by cellular packing and barriers, such as, intracellular organelles, cell membranes, and macromolecules.
Diffusion in the extracellular space is restricted by macromolecules and membranous organelles, whereas diffusion in the intracellular space is more restricted by physical (macromolecules and organelles) and chemical (specific binding and protein transitions and movements) factors and syneresis. Diffusion-weighted MR images are obtained using an echo planar imaging (EPI) technique, which can be performed rapidly and enables data acquisition, with different b-values, within a relatively short amount of time (8).
During diffusion-weighted MRI, translational motion causes phase dispersion of excited water protons, which leads to a DWI signal loss (9, 10) that can be quantified by calculating the apparent diffusion coefficients (ADC). ADCs are calculated during post-processing using at least two different b-values. Variations in ADC values reflect redistributions of water molecules between intracellular and extracellular tissue compartments, and thus, ADC values depend on microstructure and pathophysiologic state (4, 11).
UTILITY OF DWI IN HEAD AND NECK TUMORS
Characterization and Differential Diagnosis of Head and Neck Tumors
The differential diagnosis of benign and malignant lesions of the head and neck is critical as it enables clinicians to adopt appropriate management strategies. DWI has the ability to differentiate malignant and benign tumors in the head and neck lesions.
Mechanism of Diffusion Restriction in Malignant Tumors
The reason why malignant tumors have lower ADC values is poorly understood. However, the concept of restricted diffusivity in malignant tumors can be explained as follows. Within malignant tumors, the translational motion of water molecules is diminished due to increased extracellular space tortuosity, increased nuclear-to-cytoplasmic ratio, hyperchromatism, and hypercellularity. These histopathological characteristics of malignant tumor reduce the extracellular to intracellular volume ratio and the diffusion space available to water molecules, which reduce ADC values (4, 6).
The ADC Values for Benign and Malignant Lesions
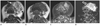
The mean ADC values for differentiation of benign and malignant lesions in the head and neck have been reported as patterns of disease entity or lesion sites. The mean ADC values for differentiation of benign and malignant lesions in the head and neck were revealed with a wide range. In general, cut-off values for differential diagnosis of benign and malignant lesions have been accepted as under 0.9 - 1.1 × 10⁻³ mm2/s (Figs. 1, 2). Kwon et al. (12) reported sensitivity, specificity, positive predictive, negative predictive values and accuracy as 92%, 66.6%, 87.8%, 76.1% and 85%, respectively, in differentiation of benign and malignant lesions in the pharynx with the cut-off ADC value as 1.1 × 10⁻³ mm2/s. Sasaki et al. (13) found that the ADCs of malignant tumors (0.87 ± 0.32 × 10⁻³ mm2/s) were significantly lower than those of benign (1.35 ± 0.29 × 10⁻³ mm2/s, p < 0.0001) and inflammatory (1.50 ± 0.50 × 10⁻³ mm2/s, p < 0.0002) lesions. Friedrich et al. (14) reported lower mean ADC value for head and neck squamous cell carcinoma (SCC) of 0.64 ± 0.28 × 10⁻³ mm2/s, and the result was probably because of one specific disease entity of squamous cell carcinoma enrolled in the study.
In the parotid gland, however, due to an overlap not only within the group of benign and malignant lesions but also an overlap between these groups, diagnoses should not be addressed on the basis of ADC values solely (15). Especially among those parotid gland tumors, Warthin's tumors revealed lower ADC values (mean ADC value of 0.89 ± 0.16 × 10⁻³ mm2/s) than those of pleomorphic adenoma and carcinoma (Fig. 3). This low ADC value is related to the hypercellularity of Warthin's tumor (16).
1.5 T versus 3.0 T
The majority of the previous studies have been performed using 1.5 telsa (T) magnetic resonance systems. Srinivasan et al. (6) reported ADC values for benign and malignant head and neck lesions at 3.0 T, and found a significant difference (p < 0.004) between the mean ADC values of benign (1.50 ± 0.48 × 10⁻³ mm2/s) and malignant (1.07 ± 0.29 × 10⁻³ mm2/s) lesions. However, it is unclear as to how ADC values vary at different field strengths, although the results obtained by Srinivasan et al. (6) were similar to those obtained using 1.5 T MR systems.
Lymphoma versus Carcinoma
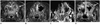
Some investigators have also reported significantly lower ADC values in lymphoma than in SCC of the head and neck (Fig. 4). Maeda et al. (7) reported a mean ADC value of 0.96 ± 0.11 × 10⁻³ mm2/s for SCC and of 0.65 ± 0.09 × 10⁻³ mm2/s for lymphoma (p < 0.001). In a study by Sumi et al. (17), authors evaluated the diagnostic ability of DWI with respect to the differentiation of lymphomas and carcinomas in the pharynx, and found that the ADCs of lymphomas (0.454 ± 0.075 × 10⁻³ mm2/s) were significantly lower than those of pharyngeal carcinomas (0.863 ± 0.238 × 10⁻³ mm2/s). Furthermore, when an ADC < 0.560 × 10⁻³ mm2/s was used to predict lymphoma, accuracy was maximal at 96% whereas sensitivity, specificity, positive predictive value, and negative predictive value were 100, 94, 86, and 100%, respectively. The lower ADC values of lymphoma than SCC can be explained by the histopathological characteristics of lymphomas, which contained densely packed cells with relatively high nuclear-to-cytoplasm ratios that decreased water diffusivity in the intra- and extracellular spaces.
Evaluation of Pathological Lymph Nodes
It is difficult to differentiate inflammatory lymph nodes (LNs) from metastatic lymphadenopathy on CT or MR images. Furthermore, morphologic features of malignancy, such as, necrosis, indistinct margins, and loss of fatty hilum in lymph nodes, are relatively infrequent findings, especially for small (< 10 mm) metastatic lymph nodes (18). Thus, anatomic imaging modalities, such as, CT and MR imaging rely mainly on node sizes to detect malignant and metastatic lymphadenopathies because of a lack of reliable morphologic criteria (19). In particular, for conventional MRI, the morphologic criteria used for nodal staging do not seem to exceed those of CT. As a metabolic imaging, 18F-fluorodeoxyglucose-positron emission tomography (FDG-PET) scans help this differentiation, but they cannot detect small tumor deposits with non-enlarged LNs. They are also expensive with less availability and have low spatial resolutions (20).
Several studies have reported that DWI can differentiate malignant and benign lymph nodes in the neck, and that malignant nodes exhibit lower ADC values than benign lymph nodes (5, 20, 21). In a study that evaluates the use of DWI for the detection of nodal metastasis in head and neck SCC, Vandecaveye et al. (21) reported that the mean ADC of malignant LNs (0.85 ± 0.27 × 10⁻³ mm2/s) was significantly lower than that of benign LNs (1.19 ± 0.22 × 10⁻³ mm2/s), and at a threshold ADC of 0.94 × 10⁻³ mm2/s, obtained a sensitivity of 84%, a specificity of 94%, and an accuracy of 91% for the differentiation of malignant and benign LNs.
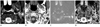
DWI is especially helpful for diagnosis of small malignant lymph nodes which is difficult with conventional CT or MR images (Fig. 5). Small lymph nodes with a maximum short axial diameter below 10 mm are more challenging for differential diagnosis, because the mere use of this size criterion will result in misclassification of malignant lymph nodes as normal on MRI evaluation. de Bondt et al. (22) studied the ADC value in especially small lymph nodes (smaller than 10 mm) in the head and neck squamous cell carcinoma, and reported that sensitivity 92.3% and specificity 83.9% with the ADC threshold as 1.0 × 10⁻³ mm2/s. Within this study, observations on the predominantly small lymph nodes show that the ADC criterion is the strongest independent predictor of presence of metastasis.
King et al. (23) reported that DWI showed significant differences between malignant nodes of SCC, lymphoma, and nasopharyngeal carcinoma (NPC), and found that ADC threshold values could help differentiate SCC and lymphoma (23). Mean ADC values for nodes of lymphoma, NPC, and SCC were 0.664 ± 0.071 × 10⁻³ mm2/s, 0.802 ± 0.128 × 10⁻³ mm2/s, and 1.057 ± 0.169 × 10⁻³ mm2/s, respectively, with significant differences between SCC and lymphoma or NPC (p < 0.001) and between NPC and lymphoma (p < 0.04).
DWI has also been used to characterize enlarged necrotic nodes associated with inflammation or neoplastic diseases, especially when the differentiation of central necrosis in metastatic nodes and in infectious necrotic nodes is difficult by conventional MRI. Koç et al. (24) reported that abscesses and necrotic lymphadenitis appear hyperintense on DW images and exhibit lower ADC values than necrotic nodal metastases that appear hypo-intense on DW images and have higher ADC values.
The difference between the ADC values of benign and malignant lymph nodes is probably related to different cellularities and histopathological features. As mentioned, malignant nodes have enlarged nuclei exhibits hypercellularity, and hyperchromatism, which decreases the ADC values of malignant lymph nodes.
Nevertheless, ADC values have potential for the detection of sub-centimeter nodal metastases, the lower in-plane resolution of ADC maps and potential image artifacts, especially if the nodes are located at the air-tissue interface, thus, result in technical limitations. Partial volume effects from the regions of interest which are used to measure the ADC values of these small lymph nodes may also lead to inaccurate ADC values.
Differentiation of Viable Tissue and Necrosis in Malignant Tumors
For head and neck cancer patients, an accurate depiction of viable and necrotic tumor regions is important for diagnosis and treatment planning, as well as being essential when choosing a biopsy site, because unsuitable choices may result in incorrect histological diagnosis. On contrast-enhanced T1-weighted images, tumors are usually visualized as contrast-enhancing lesions, and biopsy usually reveals that the enhanced portions of tumors contain viable tumor cells. However, non-enhanced portions may contain viable or necrotic tissues.
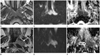
Razek et al. (25) investigated whether DWI could differentiate viable and necrotic regions in head and neck tumors. In this study, the mean ADC of viable tumor portions was 1.17 ± 0.33 × 10⁻³ mm2/s and that of necrotic portions was 2.11 ± 0.05 × 10⁻³ mm2/s. Low-signal-intensity regions with low ADC values on the ADC maps were found to represent viable tumor regions, whereas high signal intensities with high ADC values represented necrotic regions, and these ADC values of viable tumors was reported to be significantly lower than that for necrotic parts (Fig. 6). The sensitivity, specificity, and accuracy of ADC values were 92.9%, 93%, and 94.6%, respectively.
Tumor necrosis is characterized by increased membrane permeability and cell membrane breakdowns, which results in free diffusion and an increase in the mean free-path length of diffusing molecules. These changes lead to increased mobility and water molecule diffusion in necrotic regions (25).
The Differentiation of Tumor Recurrence and Post-Treatment Change
Currently, majority of patients with head and neck cancer undergo induction chemotherapy, and concurrent chemo-radiotherapy (CCRT) with surgery. After surgery, normal anatomic structures can be extensively distorted, and such radiotherapy can cause edema, fibrous inflammatory reactions, and scarring of adjacent normal soft tissues. The challenge presented to imaging methods is the differentiation of tumor recurrences and post-treatment changes, which is important for clinical decision-makings and patient management. However, after surgery and CCRT in patients with head and neck cancer, residual and recurrent lesions and treatment-induced changes exhibit similar imaging characteristics, and are, therefore, difficult to differentiate on routine follow-up MR images (26). Although FDG-PET/CT can aid the detection of recurrent head and neck cancer, it is prone to false positives owing to inflammatory changes within the first 4 months after radiation therapy (27). In addition, PET commonly produces false positive findings and suffers from low spatial resolutions that cause false negative findings within small volume of diseases. Biopsy is often necessary, but results of histopathologic speciments can be inaccurate due to sampling errors. Surgeons also fear initiating or aggravating radiation necrosis in previously irradiated areas when multiple or deep biopsy specimens are obtained (28-30).
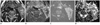
The results of recent studies deduce that diffusion-weighted MRI has the potential to distinguish post-radiation changes from recurrent cancer based on the ADC value differences (Fig. 7). Abdel Razek et al. (31) reported significant mean ADC value differences between post-treatment changes and residual/recurrent head and neck cancer; the mean ADC value of residual or recurrent lesions (1.17 ± 0.33 × 10⁻³ mm2/s) was significantly lower (p < 0.001) than that of post-treatment changes (2.07 ± 0.25 × 10⁻³ mm2/s).
Differences in ADC values reflect distinct histopathologic differences, water proton distribution in tumors, and post-treatment soft tissue changes. In tissues exhibiting post-treatment change, histopathological characteristics, such as, low cellularity associated with variable degrees of edema and inflammatory reaction increasing interstitial water contents, and thus, increases the ADC values (4, 31, 32).
Assessment of Treatment Response
As a reliable prediction method of therapeutic response during the early treatment stage, imaging markers may assist in the tailoring of treatment regimens and improve overall clinical outcomes. Several studies have already been published on the roles of DWI in the assessment and prediction of treatment responses for animal models and human brain tumors. Previous studies of animal models (33-36) and of human brain tumors (37-40) have demonstrated the sensitivity of DWI for detecting early changes induced by chemotherapy. In a study by Zhao et al. (41), it was found that ADC increased in a mouse RIF-1 tumor after treatment with the anticancer drug cyclophosphamide prior to a reduction in tumor volume, and thereafter, several groups have shown increased water diffusions through experimental tumors after treatment with anti-cancer drugs (35, 39) or gene therapy (36, 42). Furthermore, clinical studies on the efficacy of ADC for the prediction or early detection of treatment response have been conducted on brain tumors (43), breast cancer (44), and cervical cancer (45).
These several studies in animal and human models have shown that ADC values increase after treatment with antitumor therapies prior to reductions in tumor volume, and thus, enable the early detections of tumor response. Furthermore, in these studies it was also found that tumors with higher ADC values were associated with a reduced response to therapy, and low ADC tumors responded better to treatments than high ADC tumors.
In the follow-up imaging work-up of head and neck malignant lesions, the assessment of treatment response is often difficult for conventional CT or MR imaging due to anatomical derangement or alteration of primary lesions (Fig. 8). Recently, the potential use of ADC values for the prediction or early detection of treatment response in head and neck cancer was described by Kim et al. (46). In this study, patients that responded favorably to chemoradiation therapy were found to have significantly lower pretreatment ADC values than partial respondents or non-respondents. Furthermore, a significant increase in ADC was observed in full respondents within 1 week of treatment, and complete respondents also showed significantly greater increases in ADC values than partial respondents after one week of chemoradiation therapy.
A change in ADC values has also been reported to be associated with increased numbers of apoptotic cells and loss of cellularity during apoptosis targeted cancer therapy (47). Although the mechanism underlying increased water diffusions following cytotoxic chemotherapy in experimental and human tumors is not fully understood, the cytotoxic chemotherapy triggers apoptotic pathways which reduce cell density and enlarge extracellular spaces, which could explain the increase in ADC values observed after treatment (48). Although the mechanism underlying increased water diffusions following cytotoxic chemotherapy in experimental and human tumors is not fully understood, the cytotoxic chemotherapy which triggers apoptotic pathways reducing cell density and enlarging extracellular spaces are explanations for the ADC value increases after the treatment.
In addition, several studies have been conducted to determine the merits of imaging modalities, such as, perfusion CT (49), arterial spin labeling (50), and blood oxygen level dependent MRI (51), for the predictions of therapeutic responses. Zima et al. (52) reported that higher levels of blood flow and blood volume as measured by CT perfusion may be correlated with better oxygen and drug delivery, and suggested that such techniques might be useful to predict responses to radiotherapy and/or chemotherapy. In these studies, the authors emphasized the role that the tumor vasculature plays in the supply of nutrients and oxygen and acting as the chemotherapeutic agents to tumor cells.
TECHNICAL PITFALLS OF DWI
Image quality in diffusion-weighted MRI is characterized by signal-to-noise ratio (SNR) and freedom from artifacts. To obtain high quality images for qualitative or quantitative assessments, scanning factors should be optimized to maximize SNR and reduce artifacts. In order to optimize SNR, parallel imaging should be used because this shortens echo-train lengths and reduces susceptibility artifacts, and the echo time (TE) should be as short as possible.
EPI pulse sequences are highly susceptible to magnetic field heterogeneities, which result in geometric distortion artifacts. The intrinsic difficulties associated with EPI, such as susceptibility artifacts, chemical shift artifacts, and Nyquist (N/2) ghosting artifacts in the phase-encoding direction, are considerably more severe in the head and neck regions. Susceptibility artifacts are caused by the many air-bone and soft tissue-bone interfaces in the head and neck region, and result in image distortions and can present serious problems during diffusion-weighted image analysis. Other sources of susceptibility artifacts include metallic dental fillings.
One way to reduce susceptibility artifacts is to acquire DWI using the sensitivity encoding (SENSE) technique. Reduced echo train length at SENSE DWI reduces susceptibility artifacts, and thus, provides images of higher overall quality (53, 54). Newer techniques, such as, split acquisition of fast spin-echo signals (SPLICE) (55), DWI with line scan data acquisition (LSDWI) (7), and fast asymmetric SE (56) which are insensitive to susceptibility artifacts, have also been recently proposed for the acquisition of DWI data.
In LSDWI, multiple diffusion-weighted, spin-echo column excitations are used to obtain a two-dimensional image. This method is relatively insensitive to motion artifacts because the images are constructed column by column, and the acquisition time required for an individual column is approximately equal to the TE (7).
EPI often contains an aliased image or 'ghost' displaced by N/2 point from the main image along the phase-encode axis. The so-called 'Nyquist (N/2) artifact' describes a ghost image in half view of the phase-encoding direction. These artifacts are caused by zigzag data acquisition patterns in the EPI sequence, and can be reduced by using a calibrated scan, which is obtained at the beginning of the EPI sequence with the phase-encoding gradient being turned off (57).
Motion artifacts in head and neck area on DWI are associated with the continuous physiological motions associated with breathing and swallowing. Another source of motion artifacts by DWI is the pulsation of large arterial vessels. Thus, careful selection of the reference slice, avoiding vascular structures, is mandatory to obtain good diffusion-weighted image quality and reliable information about the diffusion capacity of the tumor under investigation (14). Increasing the speed of image acquisition, which is now possible with single-shot EPI, and the use of parallel imaging also provides possible means of reducing this artifact (3).
Partial volume effects from the regions of interest used to measure ADC values of small lesions or lymph nodes may also lead to ADC value inaccuracies. Furthermore, as ADC maps suffer from relatively poor resolutions, ADC values of lesions located at air-tissue interfaces may be questionable with respect to their specificities and reproducibilities. However, several factors enable the detection of small nodal metastases or small lesions by DWI, and the use of improved EPI technology, dedicated coils, and dedicated sequence optimization enable EPI-related artifacts to be maximally reduce at a relatively high spatial resolution (58).
FUTURE PERSPECTIVES
Diffusion-weighted MRI clearly differentiates itself from other imaging modalities because it is the only imaging modality that is able to depict water movements at the cellular level. However, although DWI is regarded as biologic imaging modality, the inherent shortcomings associated with EPI and the above-mentioned technical pitfalls can be problematic. Thus, better image quality by optimizing SNRs and new techniques that reduce artifacts would improve the accuracy, sensitivity, and specificity of DWI with respect to differentiating diagnosis of head and neck cancers, the evaluation of pathologic lymph nodes, the contrast of viable and necrotic lesions in malignant tumors, the variation of tumor recurrence and post-treatment changes, and the assessment of treatment response.
In patients with head and neck cancer, if DWI could detect treatment efficacy at an earlier stage after anticancer therapy commencements, the ineffective therapies could be stopped quickly. Specifically in cases of when the therapy concerned has severe adverse effects, is expensive, or when alternative approaches to treatments are available. Furthermore, pre- and post-treatment ADC values have the potential to become image markers for the prediction or detection of early treatment response in patients with head and neck cancer whom have received chemotherapy or radiation therapy. However, larger controlled studies are required to determine the sensitivity and specificity of DWI more accurately in order to predict treatment responses.
SUMMARY
The biophysical mechanism underlying DWI concerns the random translational motion of water molecules in biological tissues, and the diffusion in biologic systems is affected by water exchanging between intracellular and extracellular compartments and the tortuosity of extracellular spaces.
The ADC values of malignant tumors are significantly lower than those of benign lesions. The histopathological characteristics of malignant tumors, such as, an elevated nuclear/cytoplasm ratio, hyperchromatism, and hypercellularity, reduce the extracellular to intracellular volume ratio and the space available for water molecule diffusion. The delineations of viable and necrotic tumor regions are essential for identifying biopsy sites, diagnosis and treatment planning. The mean ADC values of viable tumors have been reported to be significantly lower than those of necrotic regions. On conventional MR images, residual or recurrent lesions and treatment-induced changes appear similarly and are often difficult to distinguish. However, residual and recurrent lesions have lower ADC values than post-treatment changes. DWI changes may provide a means of determining, at an early stage, likely treatment outcomes. For most malignant tumors, successful treatment is reflected by an increase in ADC values.
DWI is a useful clinical technique that provides information about histopathological characteristics, differential diagnosis, and stages of head and neck cancer and it also provides a means of assessing treatment responses. Due to the inherent drawbacks associated with EPI and the technical pitfalls of DWI, new acquisition methods are needed to improve image quality and reduce artifacts. Furthermore, larger-scale studies are required to ascertain whether DWI offers a robust and reproducible means of determining responses to anticancer therapies.


 XML Download