

 PDF
PDF ePub
ePub Citation
 Print
Print


INTRODUCTION
The lumbosacral plexus consists of the lumbar and sacral plexus. The lumbar plexus is formed by the ventral divisions of the first four lumbar nerves (L1-L4) and contributions of the subcostal nerve (T12), while nerve roots from the fourth lumbar roots to the third sacral nerve roots merge to form the sacral plexus. Including the sciatic nerve, the largest peripheral nerve in the body, many branching nerves are derived from the lumbosacral plexus. A variety of extrinsic and intrinsic conditions can involve lumbosacral plexus; the former includes disc herniation, perineural cyst, neoplasm, inflammation, infection and trauma in surrounding tissue, whereas intrinsic pathology includes lumbosacral nerve root avulsion or neurogenic tumors (1, 2).
Efforts to evaluate the sacral plexus with magnetic resonance imaging (MRI) have been made over a couple of decades. There was an assessment of optimal imaging planes for sacral plexus using conventional two-dimensional T1-weighted, fast spine echo T2-weighted, gradient echo or fat-saturated inversion-recovery sequences of 1.5 T MRI (3-6). With a recent widespread use of 3.0 T MRI and development of new sequences, evaluation of the peripheral nervous system has become easier. Therefore, imaging evaluation of sacral plexus and its branches has been facilitated as well. While preexisting T2-weighted fast spin-echo images have limitations in distinguishing nerves from blood vessels (7), three-dimensional (3D) diffusion-weighted sequence is known to be helpful in this matter (8). However, there has been no comparative study of different magnetic resonance (MR) sequences using 3.0 T MRI. The purpose of this study is to prospectively evaluate four different MR sequences [ProSet, fluid attenuation inversion recovery (FLAIR), balanced turbo field echo (B-TFE), T2 Drive] for imaging of lumbosacral plexus and its branches.
MATERIALS AND METHODS
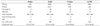
This study was approved by an Institutional Review Board and informed consents obtained from research participants. Ten healthy young volunteers (M : F = 8 : 2; Mean age = 31.6 years; range 27-39 years) underwent MRI of four different sequences: 3D T1-weighted fast field echo sequence with water-selective excitation (ProSet), FLAIR with fat-suppression, B-TFE and T2 Drive of MRI (Achieva 3.0 T, Phillips Medical System, Eindhoven, Netherlands) on lumbosacral area. ProSet applies a spectrally selective and slice selective binomial excitation pulse, which can produce water selective or fat selective images. FLAIR is an inversion recovery sequence with a turbo spin echo (TSE) echo train as read-out: 180° inversion pulse, after a long inversion time T1 90° excitation pulse followed by a number of 180° pulse resulting in multiple echoes or profiles. B-TFE is a TFE sequence with a balanced gradient wave form for all gradient directions. T2 Drive is a T2 weighted image with an additional radiofrequency (RF) refocusing pulse plus a reset RF pulse applied at the end of a TSE or a gradient and spin echo train. The parameters of MR sequences we utilized for this research are shown in Table 1. Coronal, oblique coronal and oblique sagittal reformatted images were obtained from the source data of each sequence using the software on the console of the MR imaging scanner.
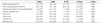
The overall image quality was scored from 1 (poor) to 5 (excellent). The number of visualized bilateral spinal nerves from L2 to S1 was counted (ten in total). The ability to discriminate between the nerves and the overlapping vessels obscuring plexus was evaluated with three-point scale (1 = many, 2 = some, 3 = few). Image quality defining spinal nerves and its branches (common peroneal nerve, tibial nerve, sciatic nerve, femoral nerve and obturator nerve) were also scored (0 = nonvisualized, 1 = poor, 2 = moderate, 3 = good). All of these analyses were done by two musculoskeletal radiologists in consensus. For statistical analysis, the Friedmann test was done to assess difference of four different sequences in ten volunteers. For post-hoc test, the Wilcoxon signed rank test was performed to assess difference of two different sequences in ten volunteers.Null hypotheses of no difference were rejected if p-values were less than 0.05. The Statistical Package for the Social Sciences for Windows (version 13.0 SPSS, SPSS Inc., Chicago, IL, USA) was used for statistical analyses.
RESULTS
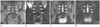
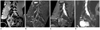
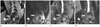
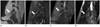
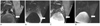
ProSet (mean = 4.2, range 3-5) and B-TFE (mean = 3.7, range 3-5) showed better image quality than FLAIR and T2 Drive images which showed relatively low image quality (2.6 and 1.1 points on average, respectively) (Fig. 1). The greatest number of spinal nerves was visualized on the ProSet image (mean = 9.2, range 8-10) and the smallest on T2 Drive image (mean = 3.8, range 1-8), while other sequences of FLAIR and B-TFE images could detect 8.3 and 8.6 spinal nerves on average, respectively. FLAIR (mean = 2.1, range 1-3) and T2 Drive sequences (mean = 2.1, range 1-3) discriminated the nerves well from the vessels (Fig. 2), while ProSet and B-TFE images were limited in discriminating the nerves from the vessels (1.6 and 1.1 respectively on average). The sciatic nerve, common peroneal nerve, and tibial nerve were well visualized on both ProSet (mean = 2.9, range 2-3) and FLAIR images (mean = 2.6, range 1-3) without significant statistical difference (Fig. 3). The femoral nerve was best seen on the FLAIR image (mean = 2.7, range 1-3) (Fig. 4) and the obturator nerve was well-visualized on the ProSet image (mean = 2.6, range 1-3) (Fig. 5). The scores are shown in Table 2.
DISCUSSION
Each sequence presented advantages and disadvantages and it was possible to utilize proper sequences for evaluation of lumbosacral plexus itself and its branches. Among the four sequences we received, ProSet turned out to be the best sequence to evaluate lumbosacral plexus and its major branches.
The acquisition time of each sequence varies, which could be significant in terms of patient's tolerance of the examination. ProSet sequence had the shortest acquisition time, 3 minutes and 51 seconds. Considering that most of the patients undergoing MR neurography of lumbosacral plexus complain of back pain, weakness of lower extremities, or paresthesia, the short scan time of ProSet sequence would be beneficial for patient's tolerance. It took 6 minutes and 38 seconds and 6 minutes and 42 seconds to obtain T2 Drive and B-TFE images respectively. Although scan times are longer than ProSet sequence's, it is expected that patients can tolerate the examinations. However, the acquisition time for FLAIR sequence was over ten minutes and this could limit obtaining images of patients with neuropathy.
The ProSet sequence showed good spatial resolution and high image quality (Fig. 1). On ProSet sequence, the lumbosacral plexus and its branches, except the femoral nerve, had high enough signals to be distinguished from other structures within a fat plane between the sacrum and pelvic viscera. Especially, smaller branches such as the obturator nerve were markedly better visualized on ProSet sequence than on the other sequences (Fig. 5). The disadvantage of the ProSet sequence is that the signal of vessels was higher than that of nerves, which made the nerves be obscured by crowded vascular bundles (Fig. 2).
FLAIR has not been used frequently in the evaluation of spine or peripheral nerve system, since the sequence showed relatively low resolution. However, the signal of the nerve was significantly higher than those of surrounding structures such as muscles, fat, and vessels, resulting excellent tissue contrast (Figs. 1, 2). Especially, the femoral nerve was best visualized in this sequence (Fig. 4). In addition, relatively darker signal of normal muscular structures in this sequence may allow us to detect muscle disorders more easily.
B-TFE sequence showed moderate degree of resolution and good contrast in this study. The diameter of nerves on this sequence showed smaller than those seen on the other sequences (Fig. 1). Vessel signals were prominently high, and it was difficult to discriminate individual peripheral nerves from vascular structures (Fig. 2). In this study, we did not evaluate the nerve roots in the thecal sac, which might be important in spinal pathology. Future research is needed to find out the best sequence to demonstrate the lumbar spinal pathology such as disk problem or spinal stenosis well.
T2 Drive sequence showed the poorest resolution and tissue contrast. Overall tissue signal was dark except the cerebrospinal fluid, which was not even useful in evaluation of disc disease (Fig. 1).
Using 3.0 T MRI, overall image quality was worthy of close attention when compared to the overall image quality of the study in 2006 about MR neurography using T1-weighted image and short-tau inversion recovery sequence on 1.5 T MRI by Lewis et al. (9). The ProSet and B-TFE sequence showed high resolution in our study, which allowed us to obtain information regarding lumbosacral plexus and its branches on basic coronal, oblique and sagittal reformatted imaging plane. Since these routine planes were reconstructed from the raw data, 3D reformatted images of other planes such as parasagittal images or oblique coronal images can be made for more detailed information of the individual peripheral nerves whenever we need them. Therefore, it is possible to evaluate lumbosacral plexus, proximal portion of its peripheral branches, and lumbar disc disease and stenosis all together in a single study, which is helpful in detecting smaller lesions involving peripheral nerves as shown in studies by Freund et al. (10) and Zhang et al. (8). Further study in abnormal groups is expected to establish more useful sequences and reformatted imaging planes.
With the evolution of 3 T MRI, MR neurography is becoming a large part of the evaluation of neuropathy. Due to the superb signal to noise ratio and contrast, 3 T MRI provides optimal imaging for the evaluation of the small sized nerve plexus segments with complex anatomy and frequent variations (11). Conventionally, peripheral neuropathy was diagnosed by electrodiagnostic studies. However, MR neurography has been becoming popular by virtue of eye-opening progress in MRI equipment and new imaging sequences (12). Conventional sequences such as T1-weighted images, T2-weighted images or fat-suppressed images have been utilized for MR neurography (11-13). We applied four different sequences of ProSet, B-TFE, FLAIR, and T2 Drive to young healthy individuals in efforts to find out a more effective sequence for detecting abnormalities of lumbosacral plexus. Future research using variable sequences, especially ProSet image is needed to provide more information of lumbosacral nerve plexus and increase the specificity of MR neurography in the evaluation of neuropathy.
In conclusion, overall, ProSet is the best sequence in evaluation of the lumbosacral plexus and its major branches while FLAIR sequence can be a complementary sequence for evaluation of nerves overlapping vascular and muscular structures.
 XML Download