

 PDF
PDF ePub
ePub Citation
 Print
Print


INTRODUCTION
Tuberculosis (TB) is an airborne infectious disease caused by Mycobacterium tuberculosis, which is transmitted from person to person via organ-containing droplets (1). Although the prevalence of TB has continued to decline over the past few years, the worldwide tuberculous infection rate remains quite high (2). In 2009, 9.4 million people worldwide newly developed TB and 1.3 million died due to the disease (3).
Confirming the diagnosis of TB is more important because it is necessary for the initiation of correct clinical management. TB can present itself as a relatively acute or subacute disease process like pneumonia. Commonly, bacterial pneumonia manifests as consolidation, centrilobular nodules and a tree-in-bud appearance, and can be with or without pleural effusion. Cavitation is often also present, especially in necrotizing pneumonia (2). On the other hand, postprimary TB is the reactivation of a latent primary focus. It is characterized by extensive inflammation and/or necrosis and manifests as centrilobular nodules, tree-in-bud opacity, granulomas, consolidation and cavitation. Postprimary TB predominantly involves the apical and posterior segments of the upper lobes and the superior segment of the lower lobes due to their high oxygen density. TB in unusual localizations, including basal segments of the lower lobes, anterior segments of the upper lobes, or the right middle lobe, occurs equally in diabetes mellitus and other less common diseases associated with an immunocompromised state (4, 5). As the features of TB and pneumonia can overlap, it can sometimes be difficult to differentiate between the two entities both clinically and radiologically. There have been no reports in the literature concerned with the comparison of chest CT findings to differentiate between TB and pneumonia. We have determined novel CT findings to differentiate between the two diseases.
MATERIALS AND METHODS
The institutional review board approved the research protocol for this study, whereas informed patient consent was waived due to the retrospective nature of this study.
Patients
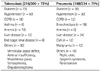
We retrospectively analyzed 300 TB patients with subacute disease duration less than one month (174 males, 126 females, age range: 23-82 years, mean age: 53.3 years) among 1668 chest CT examinations confirmed as pulmonary TB, which occurred between 2008 to 2011. As the control group, 234 patients (150 males, 84 females, age range: 15-89 years, mean age: 52.6 years) of 3064 chest CT with pneumonia from the same period were used. All selected patients were first admitted with relatively acute illness.
Among the tuberculous patients, 172 were positive on acid fast bacilli (AFB) staining, and 44 were positive for AFB culture. 36 were positive by polymerase chain reaction, and 28 were found to have caseous necrosis upon bronchoscopic or CT-guided biopsy. 16 had already been diagnosed with TB at another clinic, whereas 4 were diagnosed from a lymph node biopsy.
The diagnosis of pneumonia was made for 96 patients through the demonstration of a pathogen by culture (Staphylococcus in 24 cases); the other patients were diagnosed with pneumonia based on their clinical improvement after empirical antibiotic therapy. The patients' underlying diseases are listed in Table 1.
CT
CT examinations were performed with a 64 section CT system (Sensation 64; Siemens medical solution, Forchheim, Germany) and a 16 section CT system (Sensation 16; Siemens medical solution, Forchheim, Germany). CT scans were obtained with a 3-mm collimation at 3-mm intervals from the lower neck to the mid-level of the kidneys. The exposure parameters were 120 Kvp and 125 mAs. The infusion amount of the contrast medium was 120 mL (Ultravist, Shering, Berlin, Germany), and the infusion rate was 2 cc/sec. The scan delayed time was 70 sec. All images were obtained with window levels that were appropriate for the lung parenchyma [window width, 1000 to 1500 Hounsfield units (HU); window level -700 HU], and for the mediastinum (window width, 350 HU; window level, 50 HU). Automatic CT densitometry was performed in 30 TB cases and 24 pneumonia cases. The software was licensed as 'lung parenchyma analysis' in the Trial syngo InSpace (Sensation 64; Siemens medical solution, Forchheim, Germany).
Image Analysis
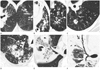
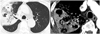
Two chest radiologists (with 10 and 20 years of experience in chest imaging) retrospectively interpreted the CT images and were blinded to the final diagnoses of the lesion at the time of their review. The following morphological features were evaluated: parenchymal abnormalities, including centrilobular nodules [presence or absence, the size (small nodules = less than 3 mm in diameter, large nodules = more than 3 mm in diameter), marginal definition (ill-defined or well-demarcated), and multisegmental involvement], a tree-in-bud appearance, granulomas (presence or absence, cavitary and/or conglomerated), and consolidation (multisegmental involvement, shape of air bronchogram, cavitation, and a decrease in lung lobe volume), pleural effusions, lymphadenopathy, and central bronchus as narrowing or wall thickening. We defined a round nodule of more than 1.0 cm in diameter as a granuloma. An irregularity of the internal bronchial shape within consolidation (air bronchogram) in which there was an alternation between dilatation and narrowing was defined as a beaded pattern bronchogram. The density of the region of interest (ROI) was measured between highly enhanced large vessels within a consolidation on enhanced CT, and the net enhancement was calculated. We excluded patients from this study based on the following CT findings: cicatricial atelectasis, consolidation associated with endobronchial TB and central bronchial obstruction (Fig. 1).
Densitometry
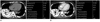
The procedure for automatic densitometry of consolidation was as follows: click the name box on the menu to begin. First, select 'Application', then 'CT', and then 'Volume'. Finally, the patient data is loaded. Choose the axial CT scan and then apply the freehand ROI from the Interactive Menu on consolidation. At this time, internal enhancing vessels (about 130 HU), air in bronchus and normal lung, and bones can be automatically eliminated, because the evaluation limit is 0 (lower limit) to 100 (upper limit) HU. The values were measured on pre- and post-enhanced CT scans with net enhancement value calculation (Fig. 2).
Statistical Analysis
Comparisons of continuous data between the two groups were performed with the independent two-sample t-test, whereas categorical variables were compared with the Fisher's exact test. We also calculated the sensitivity, specificity and accuracy for diagnosing a pulmonary lesion in the situation in which well-demarcated larger centrilobular nodules and/or a low density consolidation with internal beaded bronchi were used as indications of TB. SPSS software (version 12.0; Statistical Package for the Social Sciences, Chicago, IL, USA) was used for all statistical evaluations.
RESULTS
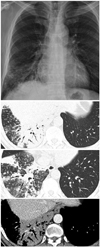
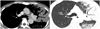
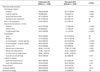
The CT findings of TB and pneumonia are presented in Table 2. 78% (234/300) of the patients with TB and 48.7% (114/234) of the patients with pneumonia had centrilobular nodules. Centrilobular nodules more commonly occurred in TB than in pneumonia (p < 0.004), and large, well-demarcated centrilobular nodules were more frequently observed in TB (64.1%; 150/234) than in pneumonia (21.1%; 24/114) (p < 0.002) (Fig. 3). There was no statistical difference between TB (64.1%; 150/234) and pneumonia (58.0%; 66/114) in the multisegmental involvement of centrilobular nodules (p > 0.07). A tree-in-bud appearance was present in both TB (55.6%; 130/234) and pneumonia (33.3%; 38/114) without significant difference (p > 0.05). Granulomas, defined as nodules larger than 1.0 cm, were found in 64% (192/300) of TB, but were rarely seen in 7.7% (18/234) of pneumonia (p < 0.0001). Further, the cavitary and conglomerated forms of granuloma were found in 32% (96/300) and 52% (156/300), respectively, of TB, but only in 7.7% (18/234) (p < 0.005) and 5.1% (12/234) (p < 0.0001) of pneumonia. Cavitary consolidation was present more often in TB (54.0%; 152/282) than pneumonia (28.2%; 66/234) (p < 0.005). The irregular, beaded air bronchograms were more commonly seen in TB (60.0%; 162/270) than in pneumonia (10.5%; 24/228) (p < 0.0001). The lung volume of the consolidative lobe decreased in 44% (124/282) of TB and in 28.2% (66/234) of pneumonia (p < 0.05). Upper lobar predominance was seen in 66% (198/300) of TB and 40.2% (94/234) of pneumonia (p < 0.05). Lymphadenopathy was more frequently present in TB (68.0%; 204/300) than pneumonia (46.2%; 108/234) (p < 0.05); however, there were no significant differences between the two groups in both pleural effusions and central bronchial narrowing (p > 0.05).
The mean enhancement value of tuberculous consolidation was 63.45 ± 14.10 HU (range, 35-90 HU) and the net enhancement value was 27.26 ± 14.32 HU. The mean enhancement value of pneumonic consolidation was 77.28 ± 21.20 HU (range, 40-129 HU) and the net enhancement value was 45.03 ± 20.62 HU. There were significant differences between the two groups in both the mean (p < 0.001) and the net enhancement value (p < 0.0001).
When a cut-off value (64.5 HU) was set in terms of mean enhancement value of consolidation, the sensitivity and specificity for TB were 69.2% and 58.4%, respectively. Alternatively, when a cut-off value (30 HU) was set in regards to the net enhancement of consolidation, the sensitivity and specificity were 74.4% and 63.7%, respectively. In another 54 patients (30 with TB and 24 with pneumonia), automatic density measurement was performed with the Siemens Syngo InSpace system. All of the mean values as determined by automatic measurement were lower than the manual measurement values shown in Table 2. When the diagnostic criteria for TB was set as well-demarcated larger centrilobular nodules and/or a less enhancing consolidation with internal beaded bronchi, the diagnostic accuracy was found to be 82.0%, whereas the sensitivity and specificity were both 82.0% (positive predictive value, 85.4%; negative predictive value, 78.0%) (Table 3).
DISCUSSION
Many of the adult tuberculous patients are admitted with high fever and relatively short disease duration. Typically, primary parenchymal TB manifests as a dense, homogeneous parenchymal consolidation in any lobe, and postprimary TB manifests as centrilobular nodules, tree-in-bud opacity, granulomas, consolidation and cavitation with upper lobe predominance (2, 5). Atypical pulmonary TB with unusual localizations involves the lower lobes, anterior segments of the upper lobes or the right middle lobes. Atypical TB in diabetes mellitus and immunocompromised patients has been reported (4, 6-8). Lymphadenopathy and pleural effusion are unusual in post-primary TB, but common in primary TB (2, 5, 9, 10). TB may affect the main or lobar bronchi and can result in airway stricture and/or stenosis (11, 12). Their appearances are often indistinguishable from that of bacterial pneumonia.
In our study, 72% of patients with TB and 71% with pneumonia had underlying diseases. Almost half of the underlying diseases were diabetes mellitus, chronic obstructive lung disease and other mild immune decrease, such as connective tissue disease, liver disease and end-stage renal disease.
When we investigated the frequency of variable CT findings in TB and pneumonia (Table 2), cavitary lesions were significantly more frequent in TB than in pneumonia (p < 0.005). Cavitation is as characteristic finding of TB, and the cavity is caused by communication between necrotic tissue and the bronchial tree (2, 9).
Well-demarcated and large centrilobular nodules were more frequently found in TB cases than in pneumonia cases (p < 0.002). Im et al. (13) found that the centrilobular lesions appeared as either a nodule or a branching linear structure in 95% of postprimary pulmonary TB patients. The histological features that contribute to the tree-in-bud pattern include caseous material within or around the terminal bronchioles, bronchiolar and alveolar ducts (14). Other infections of the bronchioles, such as bronchiolitis caused by Staphylococcus aureus or Haemophilus influenzae, can manifest as a peripheral tree-in bud pattern. This pattern correlates with the presence of intraluminal exudates and an inflammatory cell infiltrate within the walls of the bronchioles. It is believed that the tuberculous centrilobular nodules were larger and well-demarcated due to intraluminal location of thick caseous material, whereas the centrilobular nodules in pneumonia are more likely to be ill-defined and small because the walls are targeted.
Nodules larger than 1.0 cm in diameter were defined as granulomas and were a key CT finding for the diagnosis of TB. A tuberculoma is a round or oval granuloma caused by acid-fast bacilli that is encapsulated by connective tissue (15). The lesions are usually low in attenuation and show little to no enhancement after the administration of contrast medium (5). Inactive tuberculomas have been frequently found on chest CT scans in Korea. Acute pneumonia with underlying granulomatous sequelae cannot be clearly differentiated from reactivated TB. Nevertheless, the granulomatous nodules, especially the necrotic nodules, were found significantly more often in patients with TB than in those with pneumonia in our study.
We detected a difference in consolidation density between TB and pneumonia cases. Areas of consolidation in TB were significantly less enhanced (p < 0.001) and more likely to be associated with decreased lung lobe volume (p < 0.05) as compared with pneumonia. Jeong et al. (16) reported that caseating tuberculomas demonstrated less than 25 HU on enhanced CT scans. Moreover, several studies indicated that during the pathogenesis of bacterial pneumonia, the pulmonary capillaries are engorged, and the alveoli are filled with erythrocytes (14, 17, 18). Therefore, we expected that TB consolidation would be less enhanced, whereas acute bacterial pneumonia would be highly enhanced due to highly congested capillaries. In fact, enhancement in the consolidation of pneumonia was markedly high and was above 80 HU in about 65% of the cases, whereas that of TB was remarkably low (below 40 HU in 70% of patients). We believe that a thoracic radiologist can detect the enhancement density difference visually (Fig. 4), although our densitometry results, likely due to the small sample size, did not corroborate this belief. TB passes through progressive phases of exudation, the recruitment of macrophages and T lymphocytes, and granuloma formation, which are followed by repair with granulation tissue, fibrosis and mineralization (19). On the other hand, in bacterial pneumonia, particularly during the first stage, there is usually red hepatization, with the alveoli being filled with erythrocytes and fibrin, and the alveolar capillaries becoming very congested (20). In our study, tuberculous hypodense consolidation tended to be homogenous in the non-cavitary portions, whereas most necrotizing pneumonia were heterogeneous (Fig. 5).
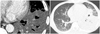
The second differentiating point between the two diseases was the bronchial shape within the consolidation. Irregularity, narrowing and dilatation of the bronchi, the so-called "beaded appearance", was significantly more common in consolidations of TB (Fig. 6) than in those of pneumonia (p < 0.0001). To the best of our knowledge, there have been no discussions regarding the internal bronchial features within tuberculous consolidation. When TB directly involves the bronchial wall, the disease undergoes several evolutionary stages (21, 22), which include the early formation of tubercles in the submucosal layer, ulceration and necrosis of the mucosal wall, and healing with a variable degree of fibrosis and/or residual stenosis (11).
This study has several limitations. First, there was selection bias due to the retrospective nature of this study. Second, the imaging analysis that includes the determination of centrilobular nodules and the bronchial shape is always subjective. Third, the measurement of the enhancement in an area of consolidation, which is composed of several different structures, including vessels, alveoli and the interstitium, can lead to a major statistical bias. However, the authors feel confident that they could visualize the difference in the level of enhancement between the two diseases. Moreover, the automatic densitometry trial was attempted to remove such bias. As far as we know, this was the first attempt to use automatic densitometry to measure the increased density of an area, and we believe that this method holds some kind of promise. For instance, it can automatically measure nodular density. Lastly, we did not compare the enhancement patterns of TB and other chronic infections, such as fungal infections. As such, the CT enhancement pattern of the tuberculous consolidation demonstrated in this study could be nonspecific findings that could also be found in any type of chronic lung infection.
In conclusion, in addition to the well-known CT findings, the characteristics of TB, which include cavities and granulomatous nodules, areas of consolidation with a low level of enhancement, decreased lung lobe volume, bronchi with an irregular, beaded shape and denser and larger centrilobular nodules, are helpful CT findings in the determination of TB diagnosis.

 XML Download