

 PDF
PDF ePub
ePub Citation
 Print
Print


INTRODUCTION
Gadoxetic acid (GA) is a liver-specific contrast agent that is used for magnetic resonance (MR) imaging. GA has features of a bolus-injectable extracellular contrast agent and a late hepatocyte-specific phase (1). After intravenous injection, GA is transported from the extracellular space into the hepatocytes and is subsequently excreted into the biliary canaliculi. GA accumulates in normally functioning hepatocytes at the hepatobiliary phase, so the hepatic parenchyma is enhanced (1-5). The use of GA for liver MR imaging has proven to be valuable in both the detection and characterization of focal hepatic lesions. In particular, the GA-enhanced hepatobiliary phase MR imaging may assist in better diagnosis of hepatocellular carcinoma (HCC) and thus, may help guide in the treatment planning (6-13).
The hepatic uptake of GA allows data acquisition during hepatobiliary phase in addition to dynamic phase examination. In patients with normal liver function, hepatobiliary phase imaging can usually be acquired within 20 min after GA injection. Because of the marked hepatic uptake of GA, this hepatobiliary phase is usually reached within 20 min after initiation of GA injection in patients with normal hepatic function and lasts for at least 60 min (2-7, 9). However, a 20 min wait is too long time consuming on routine liver MR imaging. Liver MR imaging included diffusion-weighted images is available within 15 min. Compared with non-cirrhotic liver, cirrhotic liver may have diminished parenchymal enhancement in the hepatobiliary phase (14). The uptake of GA in cirrhotic liver is variable and may be difficult to predict parenchymal enhancement (14-16).
Although some studies have suggested that decreasing the delay time for the hepatobiliary phase to 10 min sufficient to detect focal hepatic lesions in non-cirrhotic liver (9, 17, 18), there has been no report focused on determining the optimal scan time delay between 10 min, 15 min and 20 min hepatobiliary phase image for the evaluation of small-sized (≤ 3 cm) HCCs in the cirrhotic liver. Therefore, the purpose of this study is to assess the optimal scan delay of the hepatobiliary phase of GA-enhanced MR imaging for small-sized HCCs in the cirrhotic liver.
MATERIALS AND METHODS
Patients
This retrospective study was approved by the review board of our hospital, and followed the guidelines of the Declaration of Helsinki and subsequent amendments. Between Jan. 2009 and Dec. 2010, 182 patients underwent GA-enhanced MR imaging for the evaluation of HCCs in patients with cirrhotic liver. Exclusion criteria included the following: lesions larger than 3 cm or infiltrative lesions (n = 58), a history of chemoembolization, ethanol instillation, or thermal ablation within 6 months before study (n = 70). Lesions with background hemochromatosis were excluded (n = 1) because signal intensity changes of the liver parenchyma due to iron deposition would likely affect measurements for liver to lesion contrast. In final, 53 patients were included in this study.
The patients' age ranged from 40 y to 82 y of age (mean, 60.8 ± 9.9 y). There were 42 male patients and 11 female patients. There were 71 lesions diagnosed as HCCs in 53 patients; 40 patients had solitary lesions, 9 patients had 2 lesions, 3 patients had 3 lesions, and 1 patient had 4 lesions. Among 71 HCCs, 19 were confirmed by surgery, and one was diagnosed by percutaneous biopsy. The remaining HCCs were confirmed by image findings and alpha fetoprotein level > 200 IU/mL in combination with follow-up imaging obtained more than 6 months later. The criteria for diagnosis of HCCs is as follows (10, 19, 20): 1) a nodule with increased enhancement on arterial phase and washout on portal or delayed phase images; 2) a nodule with arterial enhancement and no washout on portal or delayed phase images, but hypointensity on hepatobiliary phases; or 3) a nodule with isointensity during contrast-enhanced dynamic study, hyperintensity on T2-weighted image (T2WI) and no uptake of contrast agent on hepatobiliary phase images.
The mean size of the HCCs was 1.9 cm (range, 0.8-3 cm). There were 11 HCCs equal to or smaller than 1 cm, 33 HCCs were 1-2 cm, and 27 HCCs were larger than 2 cm at maximum diameter. All patients had underlying liver cirrhosis caused by hepatitis B in 39 patients, hepatitis C in 12 patients, alcohol abuse in 6 patients, and idiopathic cirrhosis in 2 patients. Cirrhosis was classified as Child-Pugh class A in 51 patients, as Child-Pugh class B in 1 patient, and Child-Pugh class C in 1 patient (21).
MR Imaging
MR examinations were performed with a 3.0 T MR scanner (Magnetom Tim Trio, Siemens, Munich, Germany) using an 8-channel phased-array coil. The MR imaging protocols was as follows: T1-weighted gradient-echo in-phase imaging [repetition time (TR)/echo time (TE): 4.4 ms/2.5 ms, flip angle: 9.0°, matrix: 320 × 168, bandwidth: 680 Hz per pixel]; an out-of-phase imaging (TR/TE: 4.4 ms/1.3 ms, flip angle: 9.0°, matrix: 320 × 168, bandwidth: 980 Hz per pixel); a prospective acquisition correction turbo spin echo T2WI (TR/TE: 3000 ms/80 ms, flip angle: 140°, matrix: 320 × 219, bandwidth: 260 Hz per pixel), a half-Fourier acquisition single-shot turbo spin-echo heavily T2WI (TR/TE: 1600 ms/182 ms, flip angle: 150°, matrix: 320 × 230, bandwidth: 781 Hz per pixel) with a 5-7 mm section thickness, a 1-mm intersection gap, and a field of view of 360 × 297 mm. A dose of 0.1 mL/kg (0.025 mmol/kg gadoxetic acid) contrast agent was bolus injected intravenously at a rate of 1 mL/sec followed by a 20 mL saline solution flush. For contrast-enhanced MR imaging, the unenhanced, dynamic phase (30 s, 60 s, 100 s, 140 s and 180 s after contrast injection) and hepatobiliary phase (10 min, 15 min and 20 min after contrast injection) images were obtained using a fat-suppressed T1-weighted gradient-echo in-phase imaging (TR/TE: 3.4 ms/1.3 ms, flip angle: 13°, matrix: 320 × 176, bandwidth: 500 Hz per pixel) with a 3.5 mm section thickness with no intersection gap and a field of view of 360 × 260 mm. Otherwise, T2WIs were obtained between 180 s and 10 minutes; diffusion weighted imaging was obtained between 10 min and 15 min.
Image Analysis
Quantitative Analysis
Quantitative analysis of the reference lesions was performed by one radiologist (J.H.L) without knowledge of the results of tumor grading on histology. One radiologist calculated signal-to-noise ratio (SNR), enhancement ratio (ER) of the tumor and liver parenchyma and contrast-to-noise ratios (CNR) at 10, 15 and 20 minute images, respectively. Signal intensity (SI) of the liver parenchyma, reference hepatic lesion and background were measured in each patient for all image before and 10, 15 and 20 minutes after contrast injection.
Regions of interest (ROI) were drawn as large as possible in the structure of interest avoiding necrotic areas and vessels. To avoid affection of signal intensity, ROI were drawn on liver parenchyma away from focal hepatic lesions. All ROIs were positioned at identical intra-axial positions for each sequence. Background noise was defined as the standard deviation (SD) of the SI measured in the air outside the body, avoiding artifacts resulting from breathing. SNR, ER of HCCs and liver parenchyma, and liver-to-lesion CNR were calculated with the following formula; SNR = SI of liver / SD of background noise, ER = [(SI after enhancement - SI before enhancement) / SI before enhancement] × 100, and CNR = [(SI of tumor - SI of liver) / SD of background noise].
Qualitative Analysis
Three abdominal radiologists (Y.Y.J, S.S.S, J.W.K) blinded to the results of histology and quantitative analyses reviewed 71 HCCs independently at 10 min, 15 min, and 20 min GA-enhanced hepatobiliary phase MR imaging with additional T1WI, T2WI, heavily T2WI, and dynamic contrast enhanced image. The interval between the reviews of the 3 phases of images was at least 2 weeks. The reference hepatic lesion was evaluated regarding HCC possibility using a 5-point scale: 1, definitely not HCC; 2, probably not HCC; 3, indeterminate; 4, probably HCC; 5, definitely HCC. A score of 0 was assigned retrospectively when an observer did not find a lesion documented as a reference standard. When an observer estimated the lesion as a score of 4 or 5, the lesion was classified as positive. To achieve accurate correlation between the findings of the scored lesions and the reference standard, each observer recorded the individual image number, the locations of all of the lesions and the diameter of each lesions. For patients with multiple lesions located in the same segment, the observers added further descriptions regarding the size and location of the lesion within each segment in order to avoid confusion during the data analysis.
Statistical Analysis
All statistical analyses were performed with commercially available software (MedCalc for Windows. Version 11.6.1.0; MedCalc Software, Mariakerke, Belgium). For each observer, accuracy [area under the alternative free-response receiver operating characteristic curve (Az)] for the diagnosis of HCCs was calculated and compared by using latent binomial alternative free-response receiver operating characteristic analysis (22, 23). Sensitivity was calculated for the 3 hepatobiliary phases for each observer according to lesion size: equal to or < 1 cm, 1-2 cm, and > 2 cm. Sensitivity was calculated as the number of true-positive lesions divided by the total number of HCCs. For positive predictive value, numbers in parentheses are the number of true-positive lesions divided by the total number of lesions assigned a confidence level of 4 or 5. Statistical analyses for the differences of the sensitivities and positive predictive values (PPV) for each observer were based on a previous report (24).
Descriptive statistics including mean value, standard deviation, and range were calculated for ER, CNR, and SNR. The statistical significance of any differences between calculated ER, CNR, and SNR at 10 min, 15 min, and 20 min was examined using analysis of variance. A p-value < 0.05 was considered statistically significant. By comparing the scoring results from the 3 observers with the reference standard, we calculated the kappa value: 0.0-0.2, poor; 0.2-0.4, fair; 0.4-0.6, moderate; 0.6-0.8, good; 0.8-1.0, excellent (25).
RESULTS
Quantitative Analysis
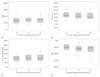
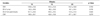
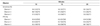
The time course of SNR, ER and CNR between 10, 15 and, 20 minute imaging is shown in Table 1 and Fig. 1. The liver parenchyma showed a slight increase in the SNR between 10 and 20 minute imaging. However, significant changes in SNR were not observed. The mean ER of HCCs was maximal at 10 minute imaging. The mean ER of liver parenchyma increased according to time course after GA injection. However, ER of HCCs and liver parenchyma were not statistically significant (p = 0.569 and 0.143, respectively). There were no significant differences in CNR at 10, 15 and 20 minute imaging (p = 0.279).
Qualitative Analysis
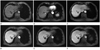
The calculated Az values for each observer for the GA-enhanced hepatobiliary phase MR imaging are shown in Table 2. The diagnostic accuracy of hepatobiliary phase imaging does not significant change when performed 10, 15 and 20 minutes after injection (Fig. 2). The average Az values for 10, 15, and 20 minutes between the observers were not significantly different (p > 0.05).
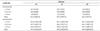
The sensitivity and PPV between the 3 hepatobiliary phases imaging for each observer are summarized in Table 3. The differences of sensitivity and PPV between the 3 hepatobiliary phase images for each observer were not statistically significant (p > 0.05). The PPV of all 3 observers ranged from 81.8% to 86.8%.The sensitivity and specificity of the 3 observers is shown in Table 4. The sensitivities were increased according to increasing sizes of HCCs. Although 3 observers determined lower sensitivities in the detection of HCCs smaller than 1 cm in diameter, the mean sensitivities were similar in all 3 imagings and there was no significant difference was found. The sensitivities for all observers were 100% for all 3 phases of HCCs larger than 2 cm in maximum diameter.
Three observers recorded 22, 17, and 19 false-positive findings on 10 min, 15 min, and 20 min images, respectively. Twelve, 11, and 12 false-positive findings for each observer were most commonly attributed to intrahepatic vasculature. Eight, 5, and 6 false-positive findings for each observer were attributed to cirrhotic nodules.
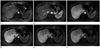
With regard to the false-negative findings, 24, 22, and 8 lesions were overlooked because of small size below 1 cm, iso-intensity on T2WI, and intrahepatic vasculature on 3 imaging. The one HCC was overlooked by all 3 observers on the 3 imaging, because the liver parenchyma appeared heterogeneous due to the presence of cirrhotic nodules of variable sizes (Fig. 3).
The kappa values among the 3 observers ranged from 0.756 to 0.853, indicating good or excellent agreement for the 3 images.
DISCUSSION
Compared with the non-cirrhotic liver, the cirrhotic liver may have diminished parenchymal enhancement on the hepatobiliary phase after GA injection, and the time to peak enhancement may be delayed. GA enhancement of the cirrhotic liver may be modest and the peak may not be achieved for 40 min or more. The reason for the diminished and delayed enhancement is due to impaired transport mechanism including dysfunctional transporters or reduced functional hepatocytes (26). As in previous studies, our study showed that the liver parenchyma with cirrhosis showed a slight increase in the SNR between 10 min and 20 min after GA injection. However, no statistically significant differences in SNR were observed between the 10 min, 15 min, and 20 min MR images.
ER of liver parenchyma was not significantly different between 10 min, 15 min, and 20 min in our study, although it was higher on 20 min images than on 10 min images. Lee et al. (27) also showed that the mean ER of chronic liver disease was not significantly different after 10 min and after 20 min. Reimer et al. (9) showed that CNR was lower on the images obtained 20 min after GA injection than on those obtained after 10 min, but the difference was not significant. Our study showed similar results that there was no significant difference in CNR between 10 min, 15 min, and 20 min images. One of the causes of these consistent results is that most patients in our study had liver cirrhosis that corresponds to a relatively normal liver function. However, according to Frericks et al. (1), CNR decreased significantly between 10 min and 20 min after contrast GA injection. The cause of the inconsistent result is that included HCCs are not limited to small size less than 3 cm and considerable number of Child-Pugh class B was included by Frericks et al.
GA-enhanced MR imaging showed clear superiority in the detection of HCCs in cirrhotic liver. The sensitivities of GA-enhanced MR imaging for detection of HCCs ranged from 81.3 to 99.4% in previous studies (10, 28-32). The hepatobiliary phase MR imaging may be useful in detecting iso- and hypovascular small HCCs that are nonspecific in the dynamic phases (16). Haradome et al. (28) demonstrated that the sensitivity of hepatobiliary phase MR imaging for detection of early stage HCCs (range 0.5-2.8 cm, mean size 1.7 cm) was 93.0%. In our study, the sensitivities of hepatobiliary phase MR imaging for detecting HCCs smaller than 3 cm were 92.0, 92.4 and 92.4% at 10 min, 15 min, and 20 min, respectively. Our result was consistent with previous reports because of the same contrast medium and the small HCC size in cirrhotic liver chosen.
However, pre-enhanced and dynamic phase images may lead to an increased in detection of HCC. Small HCCs showing typical arterial enhancement and washout on portal or delayed phase images were seen as isointense or slightly hypointense lesions on hepatobiliary phase image. The reason of decreased detection of HCC may be related to residual hepatocyte activity due to well-differentiated lesion and heterogeneous hepatic parenchyma due to the presence of cirrhotic nodules.
In our study, the numbers of false-positive lesions by 3 observers were similar between 10 min, 15 min, and 20 min images. The false-positive lesions were caused by intrahepatic vasculature and cirrhotic nodules. The liver parenchyma of cirrhotic liver appeared heterogeneous due to the presence of cirrhotic nodules of variable sizes and signal intensity interdispersed in a mesh of hypointense fibrotic scars that may be fine, coarse, nodular or confluent (32). Previous reports (28, 30) showed that the false-positive findings for detection of HCCs on GA-enhanced MR imaging were attributed to arterio-portal (AP) shunts and high-flow hemangioma. AP shunts usually exhibit intense enhancement on arterial phase images and identical signal intensity to that of surrounding liver parenchyma on GA-enhanced equilibrium or hepatobiliary phase MR imaging. The presence of high signal intensity on T2WI for hemangioma could be helpful for differentiating high-flow hemangiomas from HCC. AP shunts and hemangioma could not be false-positive findings because the assessment in our study included moderate, heavily T2WI and hepatobiliary phase MR imaging.
The numbers of false-negative lesions by three observers were same between the 10, 15 and 20 minutes images. Fifty-four HCCs, which were interpreted as a false-negative lesions from the 3 phases for each observer were too small to be interpreted as such according to the diagnostic criteria, were isointense to the surrounding parenchyma on T2WI, or overlooked because of intravascular structures. Small HCCs may not show definite hypointensity on hepatobiliary phase MR imaging due to retention of GA in well-differentiated HCC and/or decreased parenchymal enhancement in the cirrhotic background liver (32). According to the diagnostic criteria of our study, since small HCCs did not show a definite hypointensity on hepatobiliary phase MR imaging, it was not regarded as HCC.
Our study has several limitations: first, only 20 HCCs were pathologically confirmed, the rest of the reference tumors were diagnosed by imaging and clinical data. The inclusion of only those lesions that were confirmed at pathologic examination could have led to a verification bias. Second, this study included 51 patients with cirrhosis of Child-Pugh class A, which corresponded to liver cirrhosis. It was possible that they had relatively normal liver function. The number of patients with Child-Pugh class B or C, which could lead to an increased false negative rate, was too small to compare the other 2 classes. We could not compare quantitative and qualitative evaluation of the reference tumors according to liver function in the hepatobiliary phase MR imaging. Further studies should be performed to compare differences of qualitative and quantitative evaluation between Child-Pugh classes of A, B and C.
In conclusion, hepatobiliary phase MR imaging obtained 10 min, 15 min, and 20 min yield comparable diagnostic information, so that the choice of scan delay can be adapted according to the clinical routine needs to evaluate small-sized HCCs in cirrhotic liver.

 XML Download