

 PDF
PDF ePub
ePub Citation
 Print
Print


INTRODUCTION
Since its first clinical success in 1990 (1), living donor liver transplantation (LDLT) has been performed increasingly and gradually accepted as a treatment of end stage liver disease (2). Multivariate analysis identified several parameters such as graft size, degree of fatty change, donor age, and length of cold ischemic time as significant risk factors affecting graft survival (3). Among these parameters, graft size is one of the major concerns. It should be adequately decided to ensure sufficient liver function for both recipient and donor. In recipients, graft size more than 0.8-1% of the recipient's body weight is required since smaller graft is related to significantly lower graft survival (4). In donors, 30% of the total liver volume is usually considered as a lower limit of the residual liver volume (5, 6). Therefore, accurate preoperative measurement and determination of potential graft volume is a critical step of preoperative planning of LDLT.
Preoperative calculation of graft size was usually performed by manually tracing the liver contour in each slice of liver CT and summing up each volume of all slices (7-9). However, such manual tracing method is time-consuming and labor-intensive. Indeed, regardless of the modality used (CT and MRI), the manual method requires approximately 30 minutes across the studies (10-12). Furthermore, manual tracing method provides operator-dependent and subjective results. According to Henderson et al. (13), there is a considerable intra- and inter-observer variability in measuring liver volume. Situation might become worse for the measurement of territorial or partial liver volume because it requires much more readers' decision to determine the border of the territorial liver.
To reduce the time required for volumetry of the liver as well as to obtain precise and repeatable measurements, there is a big need to develop semi-automated or fully automated volumetry software. Indeed, there have been several articles reporting the accuracy of liver volumetry (9, 10, 14-19). However, because only a few commercial softwares are available to undertake the analyses, many research groups are therefore reliant on self-scripted software for liver volumetry. Not surprisingly, this has led to disparate efforts in developing measurement tools, which are often institution-specific and non-standardized. Furthermore, most of the investigators measured total liver volume (not territorial liver volume) (9, 10, 14, 15, 18, 19) and used the results of manual method which is vulnerable to inter-reader variability as a "gold standard" and recruited small number (8-88 patients) of study population to prove the accuracy of their software. Therefore, there is a need to prove the accuracy of commercially available software for measuring liver volume including territorial liver volume using a large study population and intraoperative weight or volume as a "gold standard".
Therefore, the purpose of our study is to assess the feasibility and accuracy of commercially available, fully automated hepatic CT volumetry for both total and territorial liver volumes by comparing it with interactive manual volumetry as well as estimated ex-vivo liver volume using a large study population.
MATERIALS AND METHODS
This retrospective study obtained approval by our institutional review board and the requirement for informed consent was waived.
Patients
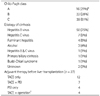
From 2005 to 2009, 77 recipients who underwent liver transplantation and 107 donors who underwent right hemihepatectomy for liver donation were consecutively included in this retrospective study. Recipients were included for total liver volume measurement and donors were included for right hemiliver volume measurement. All of them underwent preoperative dynamic CT using a multidetector computed tomography (MDCT) scanner. Recipient group consists of 62 men and 15 women with a mean age of 50.8 years (range, 31-79 years). Donor group includes 76 men and 31 women with a mean age of 31.4 years (age range, 16-53 years). Demographics and clinical characteristics of 77 recipients are presented in Table 1.
CT Acquisition
All patients underwent quadruple-phase CT using one of the following four MDCT scanners; Somatom Definition (Siemens Medical Solution, Erlangen, Germany) in 76 patients, Brilliance (Philips Medical Systems, Cleveland, OH, USA) in 32, Sensation 16 (Siemens Medical Solution, Erlangen, Germany) in 54, and LightSpeed Ultra (GE Medical Systems, Milwaukee, WI, USA) in 22. Scanning and acquisition parameters including detector configuration were listed in Table 2. Quadruple-phase CT consisted of precontrast, early arterial (EAP), late arterial (LAP), and portal venous (PVP) phase images. After obtaining precontrast scan, 1.5 mL of an intravenous non-ionic contrast medium (Ultravist 370, Schering, Berlin, Germany) per patient's body weight (kg) was administered to each patient by means of a mechanical power injector for 30 seconds. After reaching the enhancement of the descending aorta up to 100 Hounsfield units, as measured by a bolus-tracking technique, the scanning delay for the EAP was 5-6 seconds and inter-scan delay for the LAP and PVP was 7-11 seconds and 20-32 seconds, respectively. The details of scanning delay for the three dynamic CT phases were also presented in Table 2. For the analysis of volumetry, portal phase images out of quadruple-phase CT images were used to maximize the intensity difference between the liver parenchyma and non-hepatic tissue. Mean interval between the MDCT examination and liver transplantation were 14.6 days (range, 0-50 days) for recipients and 17.2 days (range, 1-40 days) for donors.
Fully Automated Liver Volumetry
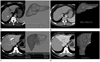
For fully automated liver volumetry, two radiologists (J.H.R and S.H.K with 3 and 14 years of experience) used commercial volumetry software (Advanced Liver Analysis, Philips Healthcare, Cleveland, OH, USA) on a viewing workstation (Extended Brilliance Workspace version 4.0.2, Philips Healthcare, Cleveland, OH, USA) to determine the liver volume on CT images in a consensus manner. When radiologists just clicked the icon for the automated volume measurement in the workstation installed with automated volumetry, the software automatically calculated the entire liver volume (Fig. 1). Radiologists were not able to perform any manual corrections on the results of fully automated liver segmentation. For the automated measurement of right hemiliver volume, the software was designed to divide the liver into right and left lobes using either hepatic vein or portal vein as a landmark. In our study, middle hepatic vein was selected as a border between right and left hepatic lobes. Software automatically calculated and showed the result of the segmentation as areas of different colors and displayed measured liver volumes in a table form (Fig. 1). The user time required to analyze liver volume on the CT images was measured with a stopwatch.
Interactive Manual Volumetry
Same radiologists performed interactive manual measurement for the liver volume with the same software used for automated measurement. To minimize recall bias, manual measurements were performed with a time interval of at least 2 weeks after automated measurement. At the time of interactive manual measurement, the radiologists were blinded to the results of the actual graft volume. The method was described by Heymsfield et al. (20) for measuring the volume of the total liver and adapted by Kawasaki et al. (21) for measuring the territorial volumes. For each measurement of the entire liver, the radiologists roughly drew the free-hand region-of-interest (ROI) to include the entire liver. Then, software selected a homogeneous volume of a specified liver which was included within the pre-determined ROI and calculated its volume (Fig. 1). Then if the radiologists believed that the selected area had been over- or underestimated by the software, the radiologists were able to modify the segmentation results using either an adding or eraser tool to enlarge or shrink the liver volume.
For right hemiliver interactive manual volumetry, the radiologists used several anatomic landmarks such as gallbladder, middle hepatic vein, and inferior vena cava to separate the right lobe from the left lobe. Radiologists roughly drew the free-hand ROI on CT image taken at the mid-level of the liver to include right hemiliver using the previously mentioned anatomical landmarks. The software color-coded the right hemiliver on the initially chosen CT image and then expanded its volume-of-interest (VOI) craniocaudally to include the right hemiliver (Fig. 1). Then if the radiologists believed that the selected VOI had been over- or underestimated by the software, the radiologists were able to modify the segmentation results using either an adding or eraser tool to enlarge or shrink the right hemiliver volume. For CT cases in which the anatomic landmarks were not clearly identified (such as non-opacification or collapsed state), the separation lines were mentally interpolated. The user time required completing interactive manual volumetry from ROI drawing and modification to calculating the liver volume by the software was also recorded for each case. For both total and territorial liver volumetry, the radiologists paid attention not to include gallbladder.
Calculation of Estimated Ex-Vivo Liver Volume
On the day of operation, total liver and the right lobe of the liver were excised from recipients and donors, respectively. Immediately after resection of the liver, the excised specimen was shook by surgeons to spill out the remaining blood in the large hepatic vessels. Then, the weights of explanted total liver and right hemi-liver graft were measured using an electronic laboratory scale. The weights of the entire liver and right hemi-liver were converted to the volumes on the basis of the previously reported hepatic density [0.943 for cirrhotic total liver (10) and 1 for normal donors' right hemi-liver (22)]. The calculated ex-vivo liver volume was used as a gold standard.
Analysis of Segmentation Quality
The quality of the fully automated segmentation and volume measurement was analyzed on a 4-point scale (3 for excellent segmentation, 2 for good, 1 for fair, and 0 for poor). Since the software displayed measured hepatic segments in colored area, segmentation quality was visually and subjectively graded according to the degree of matching between the displayed colored areas and hepatic contour of the entire or right hemiliver. Grade 3 was given for the liver if there was < 5% of difference between segmented, color-coded liver and actual liver; grade 2 for 5-10%, grade 1 for 10-30%, and grade 0 for > 30% difference. Then, the percentage of cases with grade 3 or 2 of quality was calculated to evaluate the feasibility of automated volume measurement. For the cases with grade 1 or 0, the possible causes for suboptimal quality of segmentation were analyzed.
Statistical Analysis
Only for the cases which showed excellent-to-good quality fully automated segmentation, results of automatically measured hepatic volume were compared with manually measured volumes and estimated ex-vivo liver volumes using an analysis of variance (ANOVA) test. For the results showing a statistical significance, post-hoc test was performed to analyze the significant difference between the two volumes. The p values less than 0.05 was considered as significant. A percentage volume error (E) for measured volume (VM) with the reference standard estimated ex-vivo volume (VE) was calculated as follows: E = (VM - VE) / VE. Pearson's and Spearman correlation test were performed to evaluate the relationship between the results of automated measurement and estimated ex-vivo volumes, for both total and territorial hemiliver volume measurement, respectively. Measurement time for both fully automated and interactive manual methods was also compared using a paired t-test for total liver volumetry and Wilcoxon signed rank test for right hemiliver volumetry.
RESULTS
Segmentation Quality of Automated Measurement
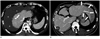
For the automated volume measurement for the entire liver in transplantation recipients, 44 of 77 livers (57.1%) had grade 2 (n = 16) or 3 (n = 28) and therefore, were categorized to cases with optimal quality of automated segmentation (Fig. 2). Fully automated volumetry software showed suboptimal quality of segmentation for 33 entire livers. Eight livers showed grade 1 (fair) and 25 showed grade 0 (poor). The causes of suboptimal segmentation for total liver by automated volumetry software were listed in Table 3. The most common cause of suboptimal segmentation showed in 18 patients was ascites which was included for the segmentation as a part of the liver and subsequently led to overestimation of liver volume (Fig. 3). The second most common cause of suboptimal segmentation showed in 6 was abnormal inclusion of adjacent organs such as right kidney which abutted against the liver and showed similar CT attenuation. It also led to overestimation of segmented total liver volume. Other causes of suboptimal segmentation include unusual anatomy of left hepatic lobe (n = 3) (Fig. 3), pleural effusion (n = 2), unknown (n = 2), a large hepatic cyst excluded from the segmentation (n = 1) (Fig. 3), and fissural attenuation (n = 1).
When it comes to the measurement of right hemi-liver volume in donors, only 19 out of 107 livers (17.8%) had grade 2 (n = 10) or 3 (n = 9) quality of segmentation and were also categorized to cases with optimal quality of automated segmentation (Fig. 2). Automated volumetry software showed suboptimal quality for separating and segmenting right hepatic lobe from left lobe in 88 livers (82.2%). 23 livers had grade 1 (fair) and 65 had grade 0 (poor). The causes of suboptimal quality of segmentation for right territorial hemiliver were presented in Table 4. The most common cause of suboptimal quality of segmentation was non-anatomical mis-segmentation in the periphery of the liver (n = 26). The second most common cause was selection of wrong vessels such as portal vein or right hepatic vein as an anatomic landmark (n = 20) (Fig. 4). Including extrahepatic organs and structures such as ribs during segmentation (n = 16) consisted of the third common cause of suboptimal quality. Other causes included segmentation of segmental liver volume such as segment VIII or segments VIII and VII (n = 2), and non-opacification of hepatic veins (n = 2). In the remaining 22 cases, causes of suboptimal segmentation were non-anatomical and unexplainable.
Comparison of Results among Fully Automated, Interactive Manual, and Ex-Vivo Volume Measurements
Comparison among the three measurement methods was performed only for the cases (44 total livers and 19 right hemilivers) which showed optimal quality of segmentation. The results of measured volume and estimated volume were presented in Table 5.
Total Liver Volumetry
The mean and standard deviation (SD) of the total liver volume estimated with automated and interactive manual methods for 44 entire livers was 1041.6 ± 530.3 mL (range, 505.4-3882.3 mL) and 795.05 ± 280.97 mL (range, 352.30-1535.70 mL), respectively. The mean actual weight and converted volume of the 44 entire livers were 908.61 ± 298.59 g (range, 540-1975 g) and 963.13 ± 316.51 mL (range, 572.4-2093.5 mL), respectively. There was a significant difference among the three volumes (p = 0.012). At the post-hoc test, there was a significant difference between automatedly measured volume and manually measured volume (p = 0.011). However, there was no significant difference between the estimated ex-vivo liver volume and the measured volume regardless of the method used. The percentage volume error between the measured volume and estimated ex-vivo volume was 0.106 ± 0.423 [95% confidence interval (CI): -0.022, 0.235] for automated volume measurements and -0.120 ± 0.396 (95% CI: -0.240, 0.001) for interactive manual method. Correlation between the measured volume and estimated ex-vivo volume was good for automated method (correlation coefficient = 0.637) and fair for interactive manual method (correlation coefficient = 0.310).
Right Hemiliver Volumetry
The mean volume measured with automated and interactive manual method for 19 right hemilivers showing excellent or good quality of segmentation was 830.25 ± 153.20 mL (range, 519.1-1085.4 mL) and 784.77 ± 180.70 mL (range, 351.5-1100.0 mL), respectively. The mean actual weight and converted volume of the 19 right hemilivers were 725.53 ± 107.44 g (range, 580.0-920.0 g) and 725.55 ± 107.44 mL (range, 580.0-920.0 mL), respectively. There was no significant difference among the automatically measured volume, manually measured volume, and estimated ex-vivo volume (p > 0.05). The percentage volume error between the measured volume and estimated ex-vivo volume was 0.145 ± 0.139 (95% CI: 0.078, 0.212) for automated volume measurements and 0.080 ± 0.171 (95% CI: -0.003, 0.162) for interactive manual method. Correlation between the measured volume and estimated ex-vivo volume was good for both automated (correlation coefficient = 0.767) and interactive manual methods (correlation coefficient = 0.764).
Measurement Time
Mean measurement time required for automated volume measurement was 48.6 seconds for total liver and 53.2 seconds for right hemi-liver and was significantly shorter than those required for interactive manual method (182.0 seconds for total liver and 244.5 seconds for right hemiliver) (p < 0.001).
DISCUSSION
In our study, the automated volumetry software exhibited good or excellent segmentation performance in more than half of the total livers and showed good correlation (correlation coefficient = 0.637) between the volume measured with automated volumetry and reference volume measured and converted from extracted total liver. In addition, there was no significant difference between the automated volume (mean ± SD, 1041.6 ± 530.3 mL) and reference volume (mean ± SD, 963.1 ± 316.5 mL) (p > 0.05). Evaluation of total and territorial liver volumes is important because assuring appropriate graft size is one of the major predictors of a safe, successful outcome for both donor and recipient. Specifically, a liver remnant measuring 30-40% of the original liver volume is required for the donor to survive and graft-to-recipient body weight ratio should be larger than 0.8% for recipient. Although the clinical need for hepatic volumetry is greater in measuring segmented liver volume than total liver volume due to the popularity of living donor liver transplantation, we believe that there is a potential clinical need for total liver volumetry. For instance, regeneration and hypertrophy of the remnant liver after major hepatic surgery including hemiliver donation can be monitored with CT volumetry using whole liver volumetry. In addition, CT volumetry for the entire liver can be used to measure the volume of the remaining native liver when planning auxiliary partial orthotopic liver transplantation for small-for-size grafts.
Although the fully automated volume measurements showed better results compared to interactive manual volumetry, the correlation did not reach the almost perfect correlation (r = 0.94-0.997) which was reported on previous literatures (11, 23). More specifically, mean liver volume measured with automated volumetry software is greater than mean volume converted from the weight of extracted total liver. Several reasons might be responsible for this discrepancy: first, we used the volume converted from the weight of extracted liver using the density of the liver as a reference of standard. As well described in the previous studies (16, 24, 25) there is a tendency for overestimation with CT volumetry compared with the intraoperatively measured hepatic volume or converted volume from the weight of the explanted liver. Main source of CT volumetric overestimation is likely related to the blood volume circulating in the liver in vivo because the blood volume is included at CT volumetry whereas graft volume or weight usually is measured blood free. Second, in our study, we enrolled the patients who had end-stage liver cirrhosis and therefore underwent liver transplantation while healthy liver donors or volunteers were recruited in previous volumetry studies. Most of our patients (86%, 66/77) for total liver volumetry had macronodular cirrhosis which was caused by chronic hepatitis B or C infection. In macronodular cirrhosis, the surface of the liver was severely undulated and therefore, exact segmentation of the liver might not be easy even in automated segmentation as well as in interactive manual segmentation compared to the normal liver. Finally, we did not perform any manual corrections on the results of fully automated liver segmentation in the current study because the aim was to test the feasibility of automated volumetry software alone to measure the entire liver volume and to compare the results automated liver volumetry alone with that determined by the interactive manual method and reference standard. If we performed manual correction on the results of automated liver segmentation, the correlation and accuracy might be improved.
When we analyzed the cause of poor or fair hepatic segmentation using automated liver volumetry, we found that the presence of large ascites (n = 18) or right pleural effusion (n = 2) were a problematic source of mis-segmentation for the liver, constituting 60.6% of all causes. If the large amount of ascites is present around the right hepatic lobe, software misrecognized the ascites as a part of the liver or as an entire liver although there was an attenuation difference between ascites and liver parenchyma on portal venous phase CT. In our study, we used commercially available, fully automated software which cannot be adjustable by the user. With the software, we did not need to click any button for the volumetry, rather the software selected and calculated the liver volume automatically. This convenient user interface can be a strong point, however, at the same time, it can be a weak point. Simplicity and quick calculation may provide reproducible and objective results in a short time. Indeed, compared with other automated software which was developed by major CT vendors or by academic researchers, the time for automated volumetry in our study (mean: 48.6 seconds) is much shorter than in other (mean: 216 seconds) (11) due to the simple and convenient user interface. However, because the user cannot intervene the processes of segmentation and cannot modify the unsatisfactory results, the results of volumetry completely rely on segmentation performance of the automated software. If the user can apply several initial points within the liver to help the approximate localization of the liver for the software, the number of poor segmentation cases by ascites or pleural effusion might decrease. Understanding the relative strengths and weaknesses of automated software in terms of liver segmentation may be helpful for both software developers and users because it can provide a positive impact on the future research and upgrade for software developers and on real clinical practice for surgeons and radiologists.
On the contrary to our expectation, the automated software poorly performed in terms of measuring right hemiliver volume. The software showed satisfactory (good or excellent) segmentation results only in 17.8% (19/107) of liver donors. However, in the subgroups showing good or excellent segmentation results, the correlation between the volume measured by automated software and volume converted from the weight of donated right hemiliver was better in territorial liver segmentation than in whole liver segmentation. One of the reasons for better correlation might be a smaller blood volume contributing to right hemiliver than that to entire liver. When we analyzed the cause of poor or fair segmentation in territorial liver volumetry, we found that unexplainable, non-anatomical mis-segmentation is the major source of error. We believe that our results may stimulate the software developers to upgrade their software performance and for further research. With the increasing need of living donor liver transplantation due to shortage of deceased liver donors, the accuracy of the territorial volumetry by automated software should be improved. In routine clinical practice, liver transplantation fellows or residents spend lots of time to measure the territorial liver volume. Accurate assessment of hepatic territorial volume is the most important step in determining donor appropriateness because adequate hepatic mass should be provided to the recipients as well as ensuring donor safety. If the software provides fully automated and accurate territorial volume in such cases, clinicians may save a lot of time for determining the adequacy of liver donors. Therefore, software developers should concentrate on research to improve the segmentation performance for territorial liver.
There are several limitations in our study. First, we did not analyze inter-observer variation in measuring liver volume using automated and interactive manual method. However, given that fully automated software with which users cannot adjust or modify the interface may provide reproducible volumes, we can guess that inter-observer variation might not be significantly large. Nevertheless, further studies are required to prove the repeatability and reproducibility of the results by automated volumetry. Second, we can simply observe the segmentation performance of specific software, but we do not know the exact features of the commercial volumetric algorithm. Although we tried to contact the company to know the segmentation algorithms used by their software, we were not able to obtain information about the detailed algorithm used by their segmentation software. A wider knowledge for the algorithm would help explain why the software nicely or poorly performed in specific cases. Third, we tested the feasibility and performance of the software from single vendor. Therefore, our results cannot be applicable to other software from other vendors or developers. Furthermore, we should bear in mind that commercial software rapidly evolves to overcome its weaknesses and therefore, our results cannot be applicable even to the software of the same vender used in our study. Considering the rapid evolution of information technology and the time gap between the study design and publication of our study's results, readers should keep in mind that limitations of certain volumetry software evaluated in the article might no longer exist when they try to use the automated volumetry software. Therefore, authors who evaluate the performance of liver segmentation software should describe the version of each system in their article because the performances of automated volumetry software may differ for different versions of the software.
In conclusion, fully automated hepatic CT volumetry is feasible and time-efficient for total liver volume measurement. However, radiologists should know that its usefulness for territorial liver volumetry needs to be improved.


 XML Download