

 PDF
PDF ePub
ePub Citation
 Print
Print


INTRODUCTION
According to the seventh edition TNM staging system for non-small cell lung cancer (NSCLC), the T component was divided into T1a, T1b, T2a, T2b, and T3, depending on tumor size cut-offs of 2, 3, 5 and 7 cm because of significant differences in the five-year survival rates of patients with lung cancer, which are 53%, 47%, 43%, 36% and 26%, respectively (1). Therefore, accurate assessment of tumor size and staging is essential for patient management and prognosis prediction.
Tumor size is affected by the morphology and location of the tumor, as irregular tumors and those in a juxtavascular location are subject to the greatest degree of variability (2). In addition, consistent measurement of tumor size is necessary in the evaluation of chemotherapy response (3). Computer-aided diagnosis (CAD) can be used to complement the limitations of manual measurements when conducting serial CT examinations because measurements taken using CAD software programs are more accurate and reproducible than manual measurements (45).
In our study, we evaluated tumor size and staging based on the new seventh edition T-staging criteria. To the best of our knowledge, there has been no reported study evaluating the interobserver agreement of the T component with reference to the new seventh edition TNM classification. We evaluated the clinical tumor size of the T component in TNM staging measured manually or by CAD of CT scans, as compared to the pathologic tumor size and T staging after surgical resection in patients with NSCLC.
The purpose of this study was to assess the interobserver agreement of T-staging based on the seventh edition of TNM classification published by the International Association for the Study of Lung Cancer (IASLC) in patients with lung cancer based on preoperative CT scans.
MATERIALS AND METHODS
Twenty patients (M : F = 14 : 6; age range, 45-77 years; mean age, 62.6 years) who had undergone a lobectomy (n = 18) or pneumonectomy (n = 2) for primary lung cancer (8 squamous cell carcinomas, 10 adenocarcinomas, 1 large cell carcinoma, and 1 bronchioloalveolar carcinoma) at our institution between February 2009 and June 2011 were included in this study. Their CT and pathologic findings were retrospectively reviewed.
Chest CT scans were obtained using a 256-slice multidetector CT scanner (Brilliance iCT, Philips Healthcare, Andover, MA, USA), from the lung apices to the level of the middle portion of both kidneys. The scanning parameters were 120 kVp and 125 mA, with a beam width of 10-20 mm, a beam pitch of 0.915, and a reconstruction thickness of 2.5 mm. CT scanning was performed after the injection of 150 mL of iopamidol, an iodinated contrast medium (Pamiray 300; Dongkook Pharm. Co., Ltd., Seoul, Korea) at a rate of 2 mL/sec with a power injector (Stellant; MEDRAD, Inc., Indianola, PA, USA). Image data were reconstructed with a soft tissue algorithm for mediastinal window images and with a bone algorithm for lung window images. The reconstructed images were directly interfaced with a picture archiving and communication system (Marosis; Infinitt Co., Ltd., Seoul, Korea), which displayed all image data on two monitors (1,536 × 2,048 matrix, 8-bit viewable gray scale and 60-ft-lambert luminescence). All images were reviewed on both mediastinal (width: 360 HU, level: 60 HU) and lung (width: 1,500 HU, level: -700 HU) windows.
We evaluated the location (central or peripheral; lobar segmentation) and morphology (smooth, lobulated or irregular) of each primary tumor. The maximum diameter of the primary tumor was measured by two thoracic radiologists with seven and nine years of experience, respectively, and by a CAD system (Extended Brilliance Workspace; Philips Health Care; Andover, MA, USA) and categorized according to the seventh edition TNM classification (6). In cases of manual measurement, the maximum diameter of each tumor was measured on an axial and lung window image. The observers were blinded to the clinical details and outcomes and evaluated the preoperative CT images independently. In cases of CAD measurement, all reconstructed thin-section (1-mm) CT images were transferred to a workstation, and the 2D diameter and 3D volumetric measurements were obtained using the lung nodule assessment application of the commercially available CAD system. We used an axial slab image as the main viewport, and coronal and sagittal image as the reference image. After our inspection indicated the existence of a nodule, we used the mark nodule tool to automatically segment the nodule. On the mark nodule tool, the pointer of a pencil-shaped cursor was clicked on the nodule, which was automatically accepted. Next, a volume-rendered image of the nodule and lesion measurement table including maximum diameter, was provided. We calculated the CT scanning interval, which was defined as the time interval from CT scanning to resection of the primary lung cancer.
All references were based on the pathologic tumor size and staging. The CT sizes and staging of the primary tumors were estimated by radiologists or by the CAD system and compared as a function of pathologic sizes and staging. The pathologic tumor size and staging was evaluated by two pathologists with twelve and four years of experience, respectively. The surgical specimens were all inflated transbronchially with neutrally buffered formalin until the pleura was smooth. After overnight fixation, the lungs were sliced at 1-cm intervals in the parasagittal plane. The maximal superior-inferior, anteroposterior and mediolateral macroscopic dimensions of the primary lesion were documented by the pathologists. Of these three-dimensional diameters, the largest one was considered to be the reference tumor size.
Statistical analyses were performed with a statistical software (PASW Statistics 18.0; IBM Corporation; Armonk, NY, USA), and p-values less than 0.05 were considered to be statistically significant. We evaluated the interobserver difference and agreement by the Wilcoxon signed-rank test and the Spearman's rho correlation coefficient. The linear regression model was used in evaluating factors associated with the CT size of the primary tumors. CT T-staging was statistically evaluated by the marginal homogeneity test and Spearman's rho correlation coefficient.
RESULTS
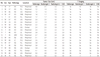
Table 1 summarizes tumor characteristics, sizes, and staging in 20 patients with lung cancer. The morphology of all tumors was irregular. The maximum diameters of the primary tumors were 2.8 ± 1.4 cm, 2.9 ± 1.6 cm, 3.0 ± 1.6 cm, 3.4 ± 1.1 cm, as measured by pathological examination, radiologic observer 1, radiologic observer 2, and the CAD system, respectively. The pathologic staging of 20 non-small cell lung cancers included stage 1a (n = 6), stage 1b (n = 6), stage 2a (n = 6) and stage 2b (n = 2). The time interval from CT scanning to pathologic analysis ranged from 3 to 32 days (mean interval, 16.1 days).
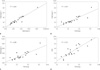
There was statistically significant interobserver agreement for CT size between the two radiologists (p = 0.984) and between the pathologic size and the CT size estimated by the manual measurement (radiologist 1, p = 0.679; radiologist 2, p = 0.558). There was a high correlation of CT size measurement between the two radiologists (Fig. 1), and a statistically significant interobserver difference between each radiologist and the CAD system (radiologist 1, p = 0.005; radiologist 2, p = 0.006), and between the pathologic size and the CT size estimated by the CAD system (p = 0.003). The correlation of CT size measurement in CAD was lower than in radiologist 1, but higher than in radiologist 2 (Fig. 1). However, there was no statistically significant interobserver difference between pathologic and CT staging by manual measurement (radiologist 1, p = 0.705; radiologist 2, p = 0.739) using the CAD system (p = 0.132). Table 2 summarizes the correlation coefficient of tumor size measurement and T-staging between observers and pathology. The location of the primary tumors was peripheral (n = 17) or central (n = 3), but could not be statistically analyzed on interobserver variability because of the very small sample size.
DISCUSSION
Tumor size measurement is very important for the accurate staging of non-small cell lung cancers, determination of management methods, and evaluation of the response to chemotherapy (7). In the seventh TNM classification, the T1 descriptor was divided into T1a (≤ 2 cm) and T1b (≥ 2-3 cm), and the T2 descriptor into T2a (> 3-5 cm) and T2b (> 5-7 cm) (8). Further sub-classifications depending on the tumor size can increase the impact on staging in patients with lung cancancer (1). No study of interobserver variability of the T component based on the new seventh TNM classification has been reported. We assessed the influence of interobserver variability on the sub-classification of the new T staging based on the seventh edition of the TNM classification published by the IASLC in patients with lung cancer.
A number of studies have investigated interobserver variations in tumor size estimation by manual measurement (3910). In a CT variability study of tumor size, Macpherson et al. (9) reported significant interobserver variation in defining gross tumor volume. In contrast, Wormanns et al. (10) reported a good correlation in the assessment of lesion size on CT scans between two radiologists. In our study, high interobserver agreement was observed in the manual measurement of the maximum tumor size using CT. Nevertheless, it is still required to complement the limitations of measurement differences resulting from manual measurement.
CAD can be used to consistently measure tumor size because measurements made by CAD systems are more accurate and reproducible than manual measurements in the assessment of lesion size (45). In a CT study of nodule characteristics, Iwano et al. (4) reported that there was significant interobserver variability among radiologists for manual, but not CAD, measurements of maximal diameter. In a treatment response study using CT, Marten et al. (5) concluded that automated volumetry using CAD allowed for better reproducibility of response evaluations and should be preferred over manual unidimensional measurements. In our study, however, there was a statistically significant difference in the measurement of tumor size using a CAD system compared to the pathologic tumor size. This system causes errors in three-dimensional manual measurements such that radiologists can be overwhelmed by large thin-section CT data including axial, sagittal, and coronal images. Whereas, unidimensional measurements do not cause errors because the relatively small amount of axial data can decrease interobserver variation. Fortunately, there was no statistically significant difference in lung cancer staging based on the CAD system. Based on our findings, we suggest that improvement may be required for the clinical application of automatic measurement using CAD systems.
In variability and agreement regarding software-generated volume measurement, Wang et al. (2) reported that nodule morphology, location, and size influenced volume measurement variability, particularly for juxtavascular and irregular nodules. However, Nishino et al. (3) reported that location, morphology, or adjacent atelectasis had no significant impact on inter- or intraobserver variability. In our study, we could not evaluate the effect of nodule morphology on the variability of size measurements because all nodules had irregular shapes and nodule location could not be statistically analyzed on the basis of measurement variability because of the very small sample size.
Our study had some limitations. First, the sample size was small and diverse tumor sizes were not included. Second, we measured the maximum diameters of tumors on unidimensional axial CT images. However, this is unlikely to affect measurement errors and observer agreement because the greatest diameters of the tumors were also measured on axial CT images in most previous studies (511). Third, tumor size was measured by a CAD system after we defined the nodule attenuation using a region of interest. In a future study, nodule detection and the measurement of nodule size could be completely automated by improvement of the CAD software.
In conclusion, the T component of the lung cancer staging system was sub-classified by variable size criteria with divisions at 2 cm, 3 cm, 5 cm, and 7 cm in the seventh edition of the TNM staging system published by the IASLC. Fortunately, in our present study, there were no differences in the measurements of tumor size among radiologists and in the assessment of T-staging by radiologists and a CAD system. However, we think that many more sample sizes, including multiple tumor stages, should be studied, and the improvement of CAD systems may be required in order to apply automatic measurements in clinical practice.

 XML Download