

 PDF
PDF ePub
ePub Citation
 Print
Print


Abstract
Purpose
We wanted to prospectively evaluate the correlation between the quantification of emphysema using 3D CT densitometry with the visual emphysema score, pulmonary function tests (PFT) and the dyspnea score in patients with chronic obstructive pulmonary disease (COPD).
Materials and Methods
Non-enhanced chest CT with 3D reconstruction was performed in 28 men with COPD (age 54-88 years). With histogram analysis, the total lung volume, mean lung density and proportion of low attenuation lung volume below predetermined thresholds were measured. The CT parameters were compared with the visual emphysema score, the PFT and the dyspnea score.
Results
A low attenuation lung volume below -950 HU was well correlated with the DLco and FEV1/FVC. A Low attenuation lung volume below -950 HU and -930 HU was correlated with visual the emphysema score. A low attenuation lung volume below -950 HU was correlated with the dyspnea score, although the correlations between the other CT parameters and the dyspnea score were not significant.
Figures and Tables
 | Fig. 1Workstation images and table of data from a 68-year-old man with COPD.
A. Axial image demonstrates centriacinar emphysema seen as areas of hypoattenuation.
B. Three dimensional display of the lungs reconstructed from MDCT data shows upper lobe predominance of emphysema, which is seen as less dense areas than middle to lower lung zones.
C. Table obtained from the 3D CT data set shows total lung volumes, mean lung density and standard deviations.
Note.-COPD = chronic obstructive pulmonary disease, MDCT = multi-detector row CT
|
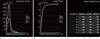 | Fig. 2Histograms and table of data from the 3D CT data set in a 68-year-old man with COPD and emphysema.
A. Absolute frequency histogram represents number of voxels of a specific density (eg. the absolute frequency of -900 HU is 35,000).
B. Cumulative frequency histogram represents a percentile of voxels below a specific density (eg. the cumulated frequency of -950 HU is 40% of total lung volume).
C. Percentile (x)% is the highest density of the lowest densities in (x)% of the total lung (eg. the value of the percentile15% in this patient is -993 HU).
Note.-COPD = chronic obstructive pulmonary disease
|
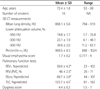
Table 1
Baseline Patient Characteristics and Results of Pulmonary Function Tests, Visual Emphysema Score, and Dyspnea Score
![]()
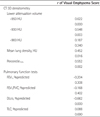
Table 2
Correlation Coefficients of 3D CT Densitometry with Results of Pulmonary Function Tests

Note.-Values given are r values on top and p values on bottom.
Percentile15% = the highest density of the lowest lung densities in 15%.
DLco = diffusion capacity of lung for carbon monoxide, FEV1 = forced expiratory volume in 1 second, FVC = forced expiratory vital capacity, TLC = total lung capacity
![]()
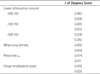
Table 3
Correlation Coefficients (r) of Visual Emphysema Score with Results of 3D CT Densitometry and Pulmonary Function Tests
Note.-Values given are r values on top and p values on bottom.
Percentile15% = the highest density of the lowest lung densities in 15%.
DLco = diffusion capacity of lung for carbon monoxide, FEV1 = forced expiratory volume in 1 second, FVC = forced expiratory vital capacity, TLC = total lung capacity
![]()
References
1. Lopez AD, Shibuya K, Rao C, Mathers CD, Hansell AL, Held LS, et al. Chronic obstructive pulmonary disease: current burden and future projections. Eur Respir J. 2006; 27:397–412.
2. Kim DS, Kim YS, Jung KS, Chang JH, Lim CM, Lee JH, et al. Prevalence of chronic obstructive pulmonary disease in Korea: a population-based spirometry survey. Am J Respir Crit Care Med. 2005; 172:842–847.
3. Symonds G, Renzetti AD Jr, Mitchell MM. The diffusing capacity in pulmonary emphysema. Am Rev Respir Dis. 1974; 109:391–394.
4. Celli BR. The importance of spirometry in COPD and asthma: effect on approach to management. Chest. 2000; 117:15S–19S.
5. van Schayck CP. Is lung function really a good parameter in evaluating the long-term effects of inhaled corticosteroids in COPD? Eur Respir J. 2000; 15:238–239.
6. Celli BR, Cote CG, Marin JM, Casanova C, Montes de Oca M, Mendez RA, et al. The body-mass index, airflow obstruction, dyspnea, and exercise capacity index in chronic obstructive pulmonary disease. N Engl J Med. 2004; 350:1005–1012.
7. Nishimura K, Izumi T, Tsukino M, Oga T. Dyspnea is a better predictor of 5-year survival than airway obstruction in patients with COPD. Chest. 2002; 121:1434–1440.
8. Klein JS, Gamsu G, Webb WR, Golden JA, Müller NL. High-resolution CT diagnosis of emphysema in symptomatic patients with normal chest radiographs and isolated low diffusing capacity. Radiology. 1992; 182:817–821.
9. Spiropoulos K, Trakada G, Kalamboka D, Kalogeropoulou C, Petsas T, Efremidis G, et al. Can high resolution computed tomography predict lung function in patients with chronic obstructive pulmonary disease? Lung. 2003; 181:169–181.
10. Gevenois PA, de Maertelaer V, De Vuyst P, Zanen J, Yernault JC. Comparison of computed density and macroscopic morphometry in pulmonary emphysema. Am J Respir Crit Care Med. 1995; 152:653–657.
11. Gevenois PA, De Vuyst P, de Maertelaer V, Zanen J, Jacobovitz D, Cosio MG, et al. Comparison of computed density and microscopic morphometry in pulmonary emphysema. Am J Respir Crit Care Med. 1996; 154:187–192.
12. Gevenois PA, De Vuyst P, Sy M, Scillia P, Chaminade L, de Maertelaer V, et al. Pulmonary emphysema: quantitative CT during expiration. Radiology. 1996; 199:825–829.
13. Coxson HO, Rogers RM, Whittall KP, D'yachkova Y, Paré PD, Sciurba FC, et al. A quantification of the lung surface area in emphysema using computed tomography. Am J Respir Crit Care Med. 1999; 159:851–856.
14. Kalender WA, Fichte H, Bautz W, Skalej M. Semiautomatic evaluation procedures for quantitative CT of the lung. J Comput Assist Tomogr. 1991; 15:248–255.
15. Newell JD Jr, Hogg JC, Snider GL. Report of a workshop: quantitative computed tomography scanning in longitudinal studies of emphysema. Eur Respir J. 2004; 23:769–775.
16. American Thoracic Society. Standardization of Spirometry, 1994 Update. Am J Respir Crit Care Med. 1995; 152:1107–1136.
17. Borg GA. Psychophysical bases of perceived exertion. Med Sci Sports Exerc. 1982; 14:377–381.
18. Hansel TT, Barnes PJ. An atlas of chronic obstructive pulmonary disease COPD. Boca Raton: Parthenon Pub. Group;2004. p. 3–4.
19. National Institutes of Health. National Heart Lung and Blood Institute. World Health Organization. Global Initiative for Chronic Obstructive Lung Disease (GOLD): Global strategy for the diagnosis, management, and prevention of chronic obstructive pulmonary disease NHLBI/WHO Workshop Report [Internet]. Bethesda, MD: National Heart Lung and Blood Institute, National Institutes of Health;2001, 2003, 2004, 2005. cited 2011 Jun 8. Available from http://www.goldcopd.org/guidelines-global-strategy-for-diagnosis-management.html.
20. Gelb AF, Gold WM, Wright RR, Bruch HR, Nadel JA. Physiologic diagnosis of subclinical emphysema. Am Rev Respir Dis. 1973; 107:50–63.
21. Petty TL, Silvers GW, Stanford RE. Mild emphysema is associated with reduced elastic recoil and increased lung size but not with air-flow limitation. Am Rev Respir Dis. 1987; 136:867–871.
22. Müller NL, Staples CA, Miller RR, Abboud RT. "Density mask". An objective method to quantitate emphysema using computed tomography. Chest. 1988; 94:782–787.
23. Kinsella M, Müller NL, Abboud RT, Morrison NJ, DyBuncio A. Quantitation of emphysema by computed tomography using a "density mask" program and correlation with pulmonary function tests. Chest. 1990; 97:315–321.
24. Park KJ, Bergin CJ, Clausen JL. Quantitation of emphysema with three-dimensional CT densitometry: comparison with two-dimensional analysis, visual emphysema scores, and pulmonary function test results. Radiology. 1999; 211:541–547.
25. Madani A, Zanen J, de Maertelaer V, Gevenois PA. Pulmonary emphysema: objective quantification at multi-detector row CT--comparison with macroscopic and microscopic morphometry. Radiology. 2006; 238:1036–1043.
26. Lee HJ, Lee YK, Seo JB, Kim NK, Oh YM, Lee SD. A study of the relationship between the pulmonary function test and the threshold value for the emphysema index at volumetric inspiration and expiration CT in cases of chronic obstructive lung disease. J Korean Radiol Soc. 2008; 59:99–106.
27. Sakai F, Gamsu G, Im JG, Ray CS. Pulmonary function abnormalities in patients with CT-determined emphysema. J Comput Assist Tomogr. 1987; 11:963–968.
28. Sanders C, Nath PH, Bailey WC. Detection of emphysema with computed tomography. Correlation with pulmonary function tests and chest radiography. Invest Radiol. 1988; 23:262–266.
29. Hersh CP, Washko GR, Jacobson FL, Gill R, Estepar RS, Reilly JJ, et al. Interobserver variability in the determination of upper lobe-predominant emphysema. Chest. 2007; 131:424–431.
30. Bankier AA, De Maertelaer V, Keyzer C, Gevenois PA. Pulmonary emphysema: subjective visual grading versus objective quantification with macroscopic morphometry and thin-section CT densitometry. Radiology. 1999; 211:851–858.
31. Bergin C, Müller N, Nichols DM, Lillington G, Hogg JC, Mullen B, et al. The diagnosis of emphysema. A computed tomographic-pathologic correlation. Am Rev Respir Dis. 1986; 133:541–546.
32. Lee YK, Oh YM, Lee JH, Kim EK, Lee JH, Kim N, et al. Quantitative assessment of emphysema, air trapping, and airway thickening on computed tomography. Lung. 2008; 186:157–165.
33. Agust AG, Gari PG, Sauleda J, Busquets X. Weight loss in chronic obstructive pulmonary disease. Mechanisms and implications. Pulm Pharmacol Ther. 2002; 15:425–432.
34. Gough J. Post mortem differences in "asthma" and in chronic bronchitis. Acta Allergol. 1961; 16:391–399.
35. Nakano Y, Muro S, Sakai H, Hirai T, Chin K, Tsukino M, et al. Computed tomographic measurements of airway dimensions and emphysema in smokers. Correlation with lung function. Am J Respir Crit Care Med. 2000; 162:1102–1108.
36. Orlandi I, Moroni C, Camiciottoli G, Bartolucci M, Pistolesi M, Villari N, et al. Chronic obstructive pulmonary disease: thin-section CT measurement of airway wall thickness and lung attenuation. Radiology. 2005; 234:604–610.
 XML Download