

 PDF
PDF ePub
ePub Citation
 Print
Print


Chronic liver diseases such as chronic hepatitis and liver cirrhosis are important causes of morbidity, mortality and increased health care costs for patients with chronic viral hepatitis. Therefore, the early detection of liver fibrosis and cirrhosis has important clinical implications for determining the antiviral treatment options and a patient's prognosis. Liver biopsy is the current reference standard for making the diagnosis of chronic liver disease; however, this is an invasive procedure, and 40% and 0.5% of the patients who undergo liver biopsy experience associated pain and major complications, respectively (12).
The morphologic criteria used to diagnose early and advanced cirrhosis by conventional MRI have been described in several reports, and most of these reports were written by the same investigative group. These criteria have a sensitivity of 68-93% and a specificity of 77.4-98%, depending on the criterion used (34). However, there is limited data on the quantitative analysis of advanced liver fibrosis and cirrhosis. Moreover, although some quantitative analyses of chronic liver disease or focal liver lesions based on MRI and using various contrast materials have been reported, there are few studies about quantitative evaluation for the detection of chronic liver disease using hepatocyte-specific contrast media.
Gadolinium-ethoxybenzyl-diethylenetriamine pentaacetic acid (Gd-EOB-DTPA) (Primovist; Bayer Schering Parma AG, Berlin, Germany) has been recently approved as a hepatocyte-specific MR contrast agent. Gd-EOB-DTPA allows for both dynamic imaging and liverspecific static MRI of hepatocytes, along with the accurate delineation, classification and characterization of liver tumors (56). Approximately half of the injected Gd-EOB-DTPA is taken-up by hepatocytes and this reaches a plateau after approximately 20 min and it last for approximately 2 hour. A few preclinical studies have reported that the MRI obtained using a hepatocyte-specific contrast agent such as Gd-EOB-DTPA allows monitoring of the excretory function of hepatocytes on the hepatocyte-phase image with a 20-min delay and this represents the liver function (57). The purpose of our study was to evaluate the capability of Gd-EOB-DTPAenhanced MRI to diagnose chronic liver disease by comparing the signal intensity changes (SICs) of the hepatic parenchyma of patients with chronic liver disease with that of patients with a normal liver, and particularly by analyzing the cut-off values of the SIC on the hepatocyte-phase images for making the diagnosis of chronic liver disease.
Materials and Methods
Patients
During a 23-month period (June 2008 to May 2010), 50 adult patients (36 men and 14 women, mean age: 53.9 years, range: 28-77 years) with chronic liver disease and who underwent Gd-EOB-DTPA-enhanced MRI were enrolled in this retrospective study (i.e., the patient group). Of these 50 patients, 41 (31 men and 10 women, mean age: 55.2 years) had a known diagnosis of liver cirrhosis and nine (five men and four women, mean age: 47.9 years) had chronic hepatitis. The underlying causes of the chronic liver disease were associated with hepatitis B (41 patients), hepatitis C (three patients), alcohol abuse (three patients) and idiopathic causes (three patients). All of these histological diagnoses were confirmed by surgery (n=9) or biopsy (n=41). The mean interval between MRI and the histological diagnosis was 17.5 days.
Another 30 adult patients (15 men and 15 women, mean age: 49.9 years, range: 27-73 years) with a normal liver underwent Gd-EOB-DTPA-enhanced MRI for various clinical reasons during the study period. They were included in the control group since they had no clinical history, clinical signs, imaging findings or laboratory parameters of liver dysfunction (i.e., normal serum values for the blood coagulation parameters, liver enzymes and total bilirubin).
Gd-EOB-DTPA-enhanced MRI Technique
The MR data was obtained on a 3.0-Tesla scanner (Achieva; Philips, Netherlands). All the individuals underwent MRI of the liver using the hepatocyte-specific contrast agent gadoxetic acid (Gd-EOB-DTPA; Primovist, Bayer-Schering Pharma AG, Berlin, Germany). The Gd-EOB-DTPA was administered intravenously as a bolus dose at a rate of 2~3 mL/sec through an intravenous cubital line at a dosage of 10.0 ml irrespective of the body weight. We obtained the pre-contrast and post-contrast 2-, 3-, 10- and 20-min delay images in the transverse plane using the fat-suppressed T1-weighted gradient-echo technique with a 4-mm section thickness and a 2-mm overlap (i.e., a 2-mm interval).
Quantitative analysis
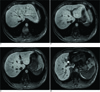
The relative signal intensity of the hepatic parenchyma measured on the post-contrast 2-, 3-, 10-, and 20-min delay images was compared quantitatively with that of the pre-contrast images as follows. Measurement of the signal intensity was performed using a circular region of interest (ROI) placed over four points of the liver parenchyma, and these included the right and left lobes of the liver. Each of the four ROIs was drawn on the same axial image at each phase with a size of 10-15 mm in diameter (Fig. 1). These ROIs were positioned to avoid signals from vessels, bile ducts, focal lesions and artifacts. We calculated the mean signal intensity of the four ROIs at each phase in each individual. The noise was measured using ROIs located just lateral to the abdominal wall. Areas with the most prominent ghost artifacts were not included. The signal intensity values were corrected to the standard deviation of the background noise and the values were expressed as the signal-to-noise ratio (SNR) according to the following formula (89):
The signal intensity change (SIC) between the pre-contrast and post-contrast images was calculated as a percentage at each phase according to the following formula:
SIpre and SIpost are the corrected signal intensity using the SNR on the pre-contrast and post-contrast images at the corresponding location, respectively (9).
Statistical analysis
All the data was analyzed after logarithmic transformation because the initial data was not normally distributed and it was difficult to interpret statistically. Therefore, it was necessary to transform the data set to resemble a normal distribution (10). Statistical analysis was performed using SPSS 12.0.1 for Windows (SPSS, Chicago, IL, USA). Comparisons of the SICs between the patient group and control group were performed using the Greenhouse-Geisser sphericity correction with repeated measures of ANOVA, and comparison of the SICs at each phase between the two groups was performed using a least squares method after natural log transformation. The cut-off values of the SIC on the 20-min delay hepatocyte-phase were determined using receiver operating characteristic (ROC) curves. The ROC curves and graphs were plotted using MedCalc 9.3.0.0 for Windows (MedCalc Software, Mariakerke, Belgium). A p-value less than 0.05 was considered statistically significant.
Results
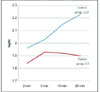
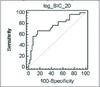
The SICs of the liver parenchyma in the patient group and control group at each phase are shown in Table 1. There was a statistically significant difference between the two groups on the 10- and 20-min delay images (p=0.003 and p<0.0001, respectively) with the most significant difference being noted on the 20-min delay hepatocyte-phase image. The mean SIC after log transformation on the 20-min delay hepatocyte-phase image was 1.90 ± 0.10 and 2.23 ± 0.13 for the chronic liver disease group and the normal liver group, respectively. The temporal profiles of the SICs after log transformation showed a difference between the two groups. The mean SICs of the control group showed a continuous increase and the mean SICs were significantly higher at 10 and 20 min after the administration of Gd-EOB-DTPA. In contrast, the mean SICs of the patient group increased up to 3 min and they were slightly decreased after 10 and 20 min (Fig. 2). The optimal cut-off value of the SIC on the 20-min delay hepatocyte-phase was 2.17 (area under the ROC: 0.759, sensitivity: 66.7%, specificity: 84.0%, positive predictive value: 71.4%, negative predictive value: 80.8%). The positive likelihood ratio was 4.17, which means that the patient group was four times more likely to have an optimal cut-off SIC of 2.17 than was the control group (Fig. 3).
Discussion
Many methods have been used for quantitatively analyzing chronic liver disease or focal liver lesions on MRI with various contrast materials (1811). The previously published studies of MR elastography demonstrated that patients with liver fibrosis had higher MR elastographic liver stiffness measurements than that of the healthy volunteers, suggesting that the MR elastographic technique might be useful for diagnosing and evaluating diffuse liver fibrosis (11). Whole-liver 3D perfusion MR imaging and MR spectroscopy are also feasible and non-invasive imaging modalities (1); however, these studies need additional equipment and they are complicated processes. For 3D perfusion MR imaging, the extensive post-processing required to obtain the perfusion parameters is a substantial barrier to the widespread clinical use of this technique. Moreover, post-processing entails multiple data transfers, with each transfer requiring its own data conversion. MR elastography requires a new MR sequence and apparatus and it involves complex steps. In contrast, by using the method described here, we can measure the signal intensity of the hepatic parenchyma at ROIs and easily calculate the SIC at a personal PACS monitor as a daily practice. Thus, our method could provide a convenient single-step technique to noninvasively estimate chronic liver disease.
Gd-EOB-DTPA is one of the liver-specific MR contrast agents with preferential uptake by hepatocytes, in which gadolinium-diethylenetriaminepentaacetic-acid (Gd-DTPA) is covalently linked to the lipophilic ethoxybenzyl (EOB) moiety ([4S]-4-[4-ethoxybenzyl] -3,6,9-tris[carboxylatomethyl] -3,6,9-triazaundecandioic acid) (12). Gd-EOB-DTPA is taken up into the hepatocytes through passive transport using the receptors on the cell surface and it is excreted into the biliary tract. Approximately half of the injected Gd-EOB-DTPA is taken-up by the hepatocytes and this reaches a plateau after approximately 20 min, and the hepatocyte-phase of Gd-EOB-DTPA-enhanced MRI visualizes the focal hepatic lesion with great contrast. But some patients show limited hepatic enhancement because their hepatic function is reduced. In the liver with impaired function, the receptors on the cell surface might not work as well as those on the normal hepatocytes. Some preclinical studies have reported that the MRI obtained with Gd-EOB-DTPA allowed monitoring of the excretory function of hepatocytes (57131415). These characteristics mean that Gd-EOB-DTPA can be used not only for hepatic imaging, but also for the measurement of hepatic function (71216). It is also known that that the signal intensity of the hepatic parenchyma increases when a certain amount of the hepatocyte-specific contrast agent is taken up by the hepatocytes. Moreover, the hepatocyte-phase image obtained approximately 20 minutes after contrast injection allows additional information on the signal intensity changes of the hepatic parenchyma in the normal liver and the liver with chronic disease (1718). In this study, we quantified the SICs of the hepatic parenchyma of the normal liver and the liver with chronic disease on both the pre-contrast and post-contrast images using the hepatocyte-specific contrast agent Gd-EOB-DTPA. As shown in this study, insufficient liver enhancement on the hepatocyte-phase image is related to liver dysfunction (5).
In this study, the SICs of the 10- and 20-min delay hepatocyte- phase images were significantly different between the patient and control groups (p=0.003 and p<0.0001, respectively) and the SICs exhibited high specificity (84.0%), but relatively low sensitivity (66.7%). This may be due to the small number of subjects, the various degree of fibrosis and the different Child-Pugh class in the patient group. This study included nine patients with chronic hepatitis and several patients with cirrhosis of Child-Pugh class A, which corresponded to the early stage of liver cirrhosis. It was possible that they had normal liver function, which could lead to an increased false negative rate. Thus, a large-scale confirmation study is needed to validate the significant correlation between estimated SICs in each group.
There were some limitations in this study. First, the study population in both groups was relatively small. Second, we did not attempt to subclassify the patient group into several subgroups according to the grade of fibrosis or the activity of inflammation because of the number of non-cirrhotic patients was relatively small and a considerable number of cirrhotic patients were of Child-Pugh A. Therefore, this study did not provide helpful information for differentiating chronic liver disease according to degree of fibrosis such as hepatitis and cirrhosis. Third, we used the same dosage of contrast agent irrespective of body weight. Fourth, the control group had no histological proof that the liver parenchyma was normal. Fifth, we did not consider there might be a sample selection bias when measuring the ROIs of the four areas in each image, and especially in the cases of advanced liver cirrhosis with heterogeneous parenchymal signal intensity.
In conclusion, this study revealed that patients with chronic liver disease showed significantly lower SICs on the hepatocyte-phase image using Gd-EOB-DTPA as compared with those SICs of the normal livers. Therefore, MRI using Gd-EOB-DTPA could provide a convenient single-step method to noninvasively diagnose chronic liver disease, although further studies on this are needed.

 XML Download