

 PDF
PDF ePub
ePub Citation
 Print
Print


Diagnostic tests for pulmonary thromboembolism (PE) include the D-dimer assay, ventilation-perfusion (V/Q) scintigraphy, lower limb ultrasonography, and CT angiography (CTA) (1). D-dimer tests have a high negative predictive value (94%) and sensitivity (97%) for PE (2). However, the reported poor specificity (29%) of Ddimer tests limits their role to exclude PE [2]. According to the original Prospective Investigation of Pulmonary Embolism Diagnosis (PIOPED) study, or PIOPED I, V/Q scintigram combined with clinical assessment established the diagnosis or exclusion of PE for only a minority of patients (3). The diagnostic value of adding lower limb compressive ultrasonography for deep venous thrombosis in patients who might have PE is limited (4).
CTA has demonstrated sensitivities of 53-100% and specificities of 83-100% (5). CTA also has many advantages- it provides fast and widely available examinations that can concurrently perform lower extremity venous imaging and provides information on intrathoracic structures, which is needed to examine other possible causes of thoracic symptoms (6). Hence, CTA is now the recommended initial imaging modality for PE diagnosis (7).
However, CTA has limitations including radiation exposure and an adverse reaction to intravenous contrast material (8). In addition, the increasing number of CTA studies performed to rule out PE increased medical costs (91011).
Most of CTA studies have been performed in countries with a high PE prevalence, such as the United States and European countries (1213). Although the rate of CTA overuse for diagnosing PE in a country with low prevalence would be lower than the rate in a country with a high prevalence, to our knowledge, no study has measured CTA overuse in low prevalence countries. Therefore, we assessed the use of CTA for the diagnostic evaluation of acute PE in a country with low PE prevalence and correlated it with clinical pretest probability and D-dimer values.
Materials and Methods
Patients and Clinical Evaluation
Institutional review board approval was obtained to perform this retrospective study, and informed patient consent was waived.
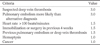
This retrospective review included all 753 patients who underwent pulmonary CTA at a tertiary hospital in a country with a low PE prevalence from October 2004 through September 2008. Sixty patients were excluded from the study because they had undergone repeated exams. Another 33 patients were also excluded: 25 whose images were nondiagnostic owing to poor contrast bolus timing, three whose images showed a motion artifact, two due to beam hardening artifacts, one due to a cement embolism, and finally two patients who had chronic PE. A serum D-dimer level was not mandatory to order the CT examination. Thus, 263 of the remaining 660 patients were excluded because D-dimer tests were not available or were performed more than seven days before or after CTA. Medical records were reviewed for all patients; clinical signs, symptoms, and comorbid conditions that are risk factors of PE according to the Wells criteria (14) were recorded (Table 1). The clinical data were not available in some cases, which resulted in the exclusion of an additional 26 patients.
The final study population included 371 patients (194 men, 177 women; mean age, 59.3 years) with both a Wells score as well as D-dimer values available, and who also underwent a subsequent analysis. A single observer who was blinded to the CTA results assigned a pretest probability score according to the Wells criteria and recorded the D-dimer results. D-dimer results were categorized as normal (0.0-0.5 µg/mL), intermediate (0.6-2.0 µg/mL), or abnormal (> 2.1 µg/mL).
Image Acquisition and Analyses
A CTA and indirect venography was performed with either a four-slice multidetector CT scanner (Lightspeed plus; GE Healthcare, Milwaukee, Wisconsin) or a 16-slice multidetector CT scanner (Sensation 16; Siemens, Forcheim, Germany). CT scans were performed in a caudocranial direction from the top of the diaphragm to the level of the aortic arch. Scans were acquired during either a single breath-hold or shallow breathing, depending on the ability of the patient to hold his or her breath during the acquisition time. Scans were obtained at 2.0-mm collimation and were reconstructed at 1.0- mm intervals using a standard algorithm.
Contrast material was administered through an 18-20 gauge catheter using an automated injector. A total volume of 120 mL of non-ionic contrast material (Ultravist 370; Schering Korea, Seoul, Korea) was injected at a rate of 3.0 mL/s. Scanning began when the contrast material was first seen in the pulmonary trunk using a bolustracking software (SmartPrep, GE Healthcare, Waukesha, Wisconsin, USA).
All contrast-enhanced CT image data were directly interfaced to a picture archiving and communications system (M-view; Marotec, Seoul, Korea) which displayed all image data on monitors (four monitors, 2,048 × 2,560 image matrices, 10-bit viewable gray scale, and 145.9-ft-lambert luminescence). On the monitors, mediastinal (window width, 350 Hounsfield units [HU]; window level, 50 HU) window images were reviewed to evaluate opacified vessels for PE.
Two chest radiologists with seven and 19 years' experience in chest radiology, respectively, and who were unaware of the D-dimer values and Wells score, independently reviewed the CT images. They interpreted the CTAs as positive or negative for PE. The criteria for a positive CTA result consisted of a partial occlusive thrombus (defined as an endoluminal filling defect surrounded by contrast medium) and a complete occlusive thrombus (15).
All patients were assigned a clot burden score derived from a simple equation based on a study by Qanadi et al. (16), multiplying the value of the thrombus location by a factor defined as the amount of thrombus. The pulmonary arterial tree was evaluated as separate segmental arteries; three to the upper lobes, two to the middle lobe and lingula, and five to the lower lobes, for a total of 10 segmental arteries. A clot in one of the segmental arteries was assigned a score of 1, and a clot in a proximal artery that gives rise to segmental arteries was assigned a score equal to the number of segmental arteries branched from it. For the amount of thrombus, a partial filling defect was assigned a weighting value of 1 and a complete filling defect was assigned a weighting factor of 2. Therefore, the clot burden score equaled a maximum of 40 (20 for each lung).
After performing CTA to diagnose PE, sufficient opacification of the venous system remained to evaluate the veins of the legs, pelvis, and abdomen for deep vein thrombosis (DVT).
Statistical Analyses
Statistical analyses were performed using commercially available software (SPSS 15.0; SPSS, Chicago, IL, USA). We performed a correlation between PE positivity rates of CTA and PE clot burden scores with D-dimer values and the pretest probability using the Pearson correlation coefficient.
Results
PE was diagnosed in 189 (28.7%) of 660 patients. Of the 660 patients, 193 patients had DVT, while 467 did not. Of the final study population (371 patients) with a Wells score and D-dimer values, 122 (32.8%) had a CTA that was positive for PE and 249 (67.2%) had a CTA that was negative for PE (Table 2). We performed an indirect venography showing that 103 patients were positive for DVT and that 268 patients were negative.
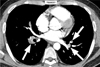
Of the 371 patients, 45 had a normal D-dimer value 95 had an intermediate value, and 231 had an abnormal value (Table 2). Among the 371 patients, only one patient (2%) with a normal D-dimer value and 10 patients (11%) with an intermediate D-dimer value had a PE. In the abnormal D-dimer value group, PE was diagnosed in 111 patients (48%) (Fig. 1) (Table 2).
Also, among the 371 patients tested for clinical pretest probability (low, intermediate, high), 112 were low, 235 were intermediate, and 24 had a high clinical pretest probability (Table 2). For patients with low, intermediate, and high clinical pretest probability scores, 30 (27%), 78 (33%), and 14 (58%) patients, respectively, had positive results for PE on CTA (Table 2).
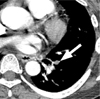
The only patient with a normal D-dimer value and an intermediate clinical pretest probability score had a PE (Fig. 2) (Table 2). None of the patients with both normal D-dimer values and a low clinical probability, had a PE (Table 2). PE positivity rates of CTA were correlated with clinical pretest probability (r = 0.164, p = 0.002) and D-dimer values (r = 0.361, p < 0.001) (Table 2). The mean PE clot burden score was 3.69 (range, 0-27). PE clot burden scores were correlated with D-dimer values (r = 0.296, p < 0.001) (Figs. 1, 2) (Tables 3, 4). However, the PE clot burden score was not correlated with the clinical pretest probability.
Discussion
Acute PE is a relatively common and important cause of morbidity and mortality in the United States and Europe (121718), but the incidence and mortality rates are lower in East Asian countries (1920). The reported number of new cases per year was 4,022 and the incidence was 32 patients per 1,000,000 people per year in one East Asian country, which is still much lower than that in the United States (21).
With the advent of helical CT, CTA has evolved into the new reference standard for diagnosis of PE and CTA is the first choice at many institutions for imaging diagnosis of PE In routine clinical practice (22). Because of quite non-specific symptoms and signs of PE, CTA is indiscriminately ordered for every patient presenting with cardiothoracic signs and symptoms. This marked increase in the use of CTA seemed to be paired with a concomitant decrease in the overall positivity rate for PE in the scans obtained. A previous study had been performed in a country with a high PE prevalence and revealed that a PE positivity rate for CTA is 10%, which represents an overuse of CTA (22). Although our study revealed a higher PE positivity rate of 28.7%, we still concluded that CTA is overused, even in country with a low PE prevalence.
CTA can improve cost-effectiveness in the diagnostic work-up of suspected PE on the basis of the cost per life saved (10). However, helical CT alone is not cost-effective, but is when combined with D-dimer values and lower limb ultrasonography (9). Wells et al. (23) demonstrated that caring for patients with possible PE on the basis of pretest probability and D-dimer result is safe and decreases the need for diagnostic imaging. In our study, none of the patients with both normal D-dimer values and a low clinical probability had a PE. The only one patient with a normal D-dimer value and an intermediate clinical pretest probability score had a PE. Therefore, CTA would be performed carefully with consideration of clinical pretest probability and the result of a D-dimer assay.
In the present study, a moderate correlation was seen between PE clot burden scores and D-dimer values, in accordance with the study by Hochuli et al. (24) demonstrating that high D-dimer levels are associated with an increased prevalence of CT radiographic findings that indicate extended clinically severe PE.
There were several limitations in this study. First, many patients lacked a D-dimer value and were excluded from the analyses. This introduced a selection bias to our study. Second, the clinical probability score was calculated retrospectively by a single person rather than by the physician evaluating the patient according to Wells criteria. The Wells score includes subjective judgment of whether an alternative diagnosis is equally or less probable than PE, whereas the Geneva score is entirely based on objective variables (1425). However, the two clinical probability scores have fair and similar predictive accuracies (2627). The recently introduced simplified Wells rule appears to be safe and clinically useful, although prospective validation remains necessary (2829).
In conclusion, although PE positivity rates diagnosed by CTA in a country with low PE prevalence were higher than the rates in a country with high PE prevalence, the approximately 30% yield still represents an overuse of CTA. None of the patients with both normal D-dimer values and a low clinical probability had PE in this study. Therefore, CTA should be performed after the pretest probability has been assigned and only if the result of a D-dimer assay is abnormal.


 XML Download