

 PDF
PDF ePub
ePub Citation
 Print
Print


The pandemic (H1N1) 2009 virus, a new strain of influenza virus that had never infected people before, first presented in Mexico in April 2009. Since then, this new influenza virus has spread rapidly throughout the world and a total of 74 countries had reported laboratory confirmed infections in June 2009, at which point the World Health Organization (WHO) declared it a pandemic (1). According to the WHO's report, many more than 622,482 had been infected, and over 18,114 in 214 countries had died because of this virus (23). In South Korea, it is estimated that there has been more than 107,939 laboratory confirmed cases and 2.22 out of every 1,000 people infected. This rate of infection ranked 8th in the world at the time of the pandemic (4).
There have been some reports about the frequency of radiologic studies and the abnormalities observed with this new virus infection. In the study of the largest series of patients (1,088 with probable or confirmed cases), Louie et al. (5) noticed that 77% of patients underwent chest radiographs and 66% (547/833) had infiltrates. In the study by Aviram et al. (6), which included the largest number of laboratory-confirmed patients to date, 54% underwent chest radiographs and 40% had abnormal findings. Agarwal et al. (7) reported that 30% had chest radiographs and 42% of these were abnormal. There are differences among the results and the study group was not large enough to represent the status of their country. We can also observe a pattern and distribution of radiologic abnormalities based on previous studies. In chest radiographs, bilateral ground-glass opacity (GGO), or consolidation was the most common finding of the studies of Aviram et al. (6) and Agarwal et al. (7) Also, in high resolution CT (HRCT) of 20 adult patients infected with H1N1 influenza virus, Marchiori et al. (8) reported bilateral GGO or mixed bilateral GGO and consolidation were common. There was also a study of the radiographic findings of children, however, the results were not compared with those of the adult patients (9). Meanwhile, a study about virus confirmation testing (10), real time reverse transcription-polymerase chain reaction (RT-PCR), indicated that no correlation was evident between viral loads and clinical severity of disease. There are no studies about the relationship between viral titer and radiologic abnormalities.
Based on this background, we wanted to know in reference to the pandemic (H1N1) 2009 virus infection: 1) how many patients were severely ill enough to undergo the radiologic studies and the frequency of radiographic abnormalities, 2) the patterns and distributions of radiographic and CT findings, 3) the differences in the frequency of abnormalities, pattern, and distribution between children and adult patients, and 4) whether viral load was associated with the radiographic abnormalities.
Materials and Methods
This retrospective study was approved by the institutional review board and informed consent requirement was waived. Patient confidentiality was guaranteed by using only anonymous data and radiologic images.
Patients
In November 2009, the pandemic (H1N1) 2009 outbreak peaked in Korea and also in our institute, with the most RT-PCR tests for the virus performed in that one month. A total of 9,427 people visited the emergency room or outpatient clinics and had nasopharyngeal swab tests for RT-PCR based on the clinicians' decision or patients' request. Among the 9,427 patients (male, 4,792; female, 4,681; mean age 19.24 ± 17.47, age range 0-87), 3,849 (41%) were positive for the pandemic (H1N1) 2009 virus, 46 (0.5%) were positive for seasonal flu, and the remaining patients were negative for both. Among 3,849 patients (male, 2,045; female, 1,804), who were positive for the pandemic (H1N1) 2009 virus, 2,410 (63%) were below the age of 15 years (children group) and 1,439 (37%) were over the age of 15 (adult group). We reviewed the medical records of 3,849 patients and examined whether they underwent chest radiographs or chest CT scans from 1 week before to 1 week after the day they underwent the virologic test. We excluded patients who were positive for seasonal flu because they were not the focus of our study. Of the 3,849 patients who had laboratory-confirmed infection, 338 (9%) underwent chest radiographs and only 13 (0.3%) had chest CT scans.
Imaging Technique
Chest radiographs were obtained by upright posteroanterior- and lateral-projection (FCR 5501 and VELOCITY-U, Fuji, Tokyo, Japan) unless patients were bed-ridden or younger than two years, in which case, supine anteroposterior-projection radiographs were obtained.
Of the 13 patients who underwent chest CT, 7 had thin-section CT scans without contrast enhancement and 6 underwent contrast-enhanced CT with intravenous contrast medium. The CT scans were obtained with a 16-channel multi-detector CT (MDCT) scanner (Siemens, Erlangen, Germany) or a 64-channel MDCT scanner (Brilliance; Philips Medical Systems, Cleveland, OH, USA). In contrast-enhanced CT, the protocol included end-inspiratory acquisition, 120 kV, 230 mAs, and a 5-mm reformation. In thin-section CT, the protocol included 120 kV, 200 mAs, and a 1-mm or 1.25-mm reformation. The CT images were reviewed under both lung (window width, 1,500 HU; level, -700 HU) and mediastinal (window width, 350 HU; level, 40 HU) window settings.
Imaging Analysis
Two radiologists independently reviewed the radiographs of 338 patients and CTs of 13 patients and reached a final decision by consensus. All images were reviewed on a picture archiving and communication system (PACS) workstation (INFINITT, Seoul, Korea).
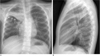
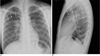
Each radiograph was first classified as either normal or abnormal. The abnormal radiographs were compared with the previous radiographs if available. In these cases, we characterized radiographs as abnormal only if there were differences between the previous and the current images. Abnormal findings were described on the basis of the pattern of abnormality of lung parenchyma, as well as anatomic distribution and associative findings. First, we described the pattern of abnormality as follows; the airspace pneumonia pattern used when a fairly homogeneous opacity obscured underlying vessels and airways (Fig. 1); the bronchopneumonia pattern used when poorly defined patchy opacities measuring 5-10 mm in diameter were seen (Fig. 2); and the interstitial pneumonia pattern used when the major finding was innumerable, interlacing line shadows that suggested a mesh. Second, we categorized distribution as: (a) unilateral or bilateral, (b) central if the lesion was mainly in the medial 2/3 on the frontal radiograph, peripheral if in the lateral 1/3, or random, (c) localization of one lobe, or more than one lobe, (d) zonal involvement as upper, middle, or lower lobe of each lung in the frontal and/or lateral radiographs according to anatomic localization. Lastly, we reviewed whether there were atelectasis, lymph node enlargement, pleural effusion, pneumothorax, large nodule, cavity, or other associative findings.
When describing CT findings, the terms of GGO (hazy increased opacity of lung, without obscuration of bronchial and vascular margins), consolidation (a fairly homogeneous opacity obscured underlying vessels and airways) and centrilobular nodule (well- or ill-defined focal round opacity on the centrilobular region) were used, and we also evaluated the anatomic distribution and associative findings.
Viral Titer and Chest Radiograph
We investigated the relationship between the viral load and the presence or absence of abnormalities on chest radiographs. One doctor in laboratory medicine investigated the Ct value of 338 patients. We compared the mean Ct value between patients with normal and abnormal chest radiographs in a total of 338 patients and separately in children and adult group.
Statistical Analysis
Continuous data such as age or Ct value were presented as the mean ± standard deviation and range. The Kolmogorov-Smirnov and Shapiro-Wilk tests were performed to determine whether the data showed normal distribution. The comparison of age and Ct value between groups was performed using the independent-sample t-test for normally distributed variables and the Mann-Whitney U test for variables not normally distributed. To compare the frequency of each categorical variable between two groups, the Pearson χ2 test was used. We considered a two-tailed p-value of less than 0.05 to be statistically significant. Statistical analyses were performed with the SPSS software package (SPSS version 12.0 for Microsoft Window; SPSS Inc., Chicago, IL, USA).
Results
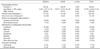
Among the 9,427 people analyzed by RT-PCR test, 3,849 (41%) were positive for the pandemic (H1N1) 2009 virus. Of the 3,849 patients confirmed to have the virus, 338 (9%) underwent chest radiographs (Table 1). Two hundred and twelve (9%) out of 2,410 children, and 126 (9%) out of 1,439 adults underwent chest radiographs and there was no significant difference between the two groups (p = 0.966). Among the 338 patients who underwent chest radiographs, 51 (15%) showed abnormal findings. Forty-one (19%) of the 212 children and 10 (8%) of the 126 adults had abnormal radiographs and the frequency of abnormality on chest radiograph was significantly higher in children than in adults (p = 0.005) (Table 1).
Of the patterns of abnormality encountered in the chest radiographs, the airspace pneumonia pattern was most common in both groups (Fig. 1). Forty-two (82%) patients, including 34 (83%) children and 8 (80%) adults had the airspace pneumonia pattern and the frequency was not significantly different between the two groups (p = 0.828). Seven (17%) children and 2 adults (20%) showed bronchopneumonia pattern (Fig. 2). No patient in either group showed the interstitial pneumonia pattern (Table 1).
The result of distribution indicated unilateral involvement (82%) was more common than bilateral involvement (18%). In addition, central involvement (85%) was more common than peripheral or random involvement in children, but random involvement (60%) was most common in adults. Thirty-four (67%) patients showed involvement of one lobe, which was twice that of the 17 (33%) patients who showed involvement in two or more lobes. Of the 6 lobes examined, the left lower lobe (35%) was the most commonly involved lobe when examining distribution (Table 1).
Six (15%) children and 1 (10%) adult had atelectasis, while 6 (15%) children and 3 (30%) adults showed pleural effusion. One child showed both atelectasis and pleural effusion. No patient from either group had lymph node enlargement or pneumothorax on chest radiograph.
Among the 3,849 patients who had a positive virologic test, 13 (0.3%) underwent chest CT. Of the patients who had chest radiographs, 11 (8.7%) adults and 2 (0.9%) children underwent chest CT (p < 0.001). Of the patients who underwent chest CT, 5 adults had normal findings in their initial chest radiographs.
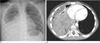
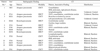
Table 2 describes the CT findings of 13 patients. Twelve (92%) showed abnormal CT findings. Three adults (Patients 5, 8 and 13) showed bronchiectasis in their initial radiographs, and one (Patient 10) had been followed up due to interstitial pneumonia. One child (Patient 1) showed air space opacity in the right middle and lower lobes as well as right pleural effusion. Moreover, a follow-up chest radiograph showed that the child had aggravated pleural effusion and so, he underwent contrast-enhanced CT 6 days later (Fig. 3).
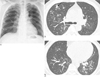
Common patterns of CT included GGO (8/12 = 67%) and centrilobular nodules (7/12 = 58%). Five patients (5/12 = 42%) showed both GGO and centrilobular nodules, and 2 of them also had consolidation (Fig. 4). Bilateral (8/12 = 67%) and random (9/12 = 75%) involvement was more common than unilateral (4/12 = 33%) and central (3/12 = 25%) or peripheral (0/12 = 0%) involvement. Five (42%) showed involvement in all lobes. One showed pneumothorax, another showed cavities and large nodules, and 2 patients showed lymphadenopathy on chest CT.
The Ct values of all 338 patients were investigated (Table 3). The mean Ct value was calculated and the Ct values of the two groups (normal and abnormal chest radiograph) were compared. The mean Ct value of the group of the normal chest radiograph was significantly lower than that of the other group. However, we could not find a significant difference between normal and abnormal chest radiographs in either the children or adult groups.
Discussion
Perez-Padilla et al. (11) reported that this new virus has caused severe illness in young and middle-aged previously healthy people. Approximately 90% of deaths have occurred in patients under 65 years of age. Therefore, this virus has caused serious concern among doctors and the general public. However, it has been noted that this virus is less lethal than the previous pandemic strains. The overall mortality has not yet been reported, but based on the WHO's report on November 27th, 2009, the number is approximately 7,826/622,482 (0.01%). Mortality is actually much lower than that of seasonal influenza (0.1%) (212).
In three studies of the early outbreak period (approximately from April to August) in Mexico, Australia and Israel, the rates of patients who were positive for this virus among people who underwent RT-PCR tests were 11% (6,945/63,470), 33% (43/130, only of children), and 38.5% (1,082/2,809), respectively (131415). In our study, we found that the percentage of virus-positive tests was 41% (47% of children, 33% of adults), which is almost the same as those reported in previous studies. In November 2009, the fears over this new virus were near a boiling point in Korea. So, many people who otherwise would have taken care of themselves at home when experiencing mild symptoms of viral infection, visited the hospital instead.
The clinical manifestation of the most confirmed cases of this influenza is not different from that of typical seasonal influenza, which has been characterized by mild influenza-like illness such as fever, chills, headache, upper respiratory infection symptoms, myalgias, arthralgias, and fatigue (16). In clinical practice, doctors undertake radiologic studies only if there is clinical evidence of influenza viral pneumonia, and not if it appears to be a simple influenza-like illness. Agarwal et al. (7) reported 30% of probable or laboratory-confirmed patients underwent chest radiographs and that was the lowest percentage from several articles published since last year (569). In our study, which involved the largest population, only 9% underwent imaging studies. This may be because our study group was composed of relatively recent patients, when medical doctors came to realize that the fatality of this new virus was not much higher than they thought. In addition, the real clinical symptoms of laboratory-confirmed patients detected by clinicians may not have been serious enough for chest radiologic images.
The rate of abnormality on chest radiographs was lower than reported rates in recent studies. In one of the largest studies to date (6), 40% had abnormal radiographs, which is much higher than our result that showed only 15% had abnormal findings. In addition, in the children group alone, the rate of abnormality (19%) was much lower than that of a previous study of children under age 20 (55%) (9). The previous study which reported an abnormality rate of 40% included patients who were hospitalized or died, so, that could result in a higher abnormal rate than the result of patients who just showed positive results for virus infection in our study. Even though we did not cover the clinical severity or outcome, we can say that the result of the lower rate of abnormality is not different from WHO's report about the mortality of this virus, which was lower rather than that of seasonal influenza virus and went against the degree of public concern (212). Based on our study of the largest study group to date, we now realize that this virus did not really cause as severe an infection as expected.
One of the most important findings in our study is that the rate of abnormality is significantly higher in children. To date, there has not been a study comparing the clinical or radiologic features between children and adults. A recent article reported that because of the cross-protective antibodies, this virus more favorably attacked children and young adults (12). Our results, showing a significantly higher rate of abnormality on chest radiograph in children (19%) than in adults (8%), may be supported by that hypothesis. We think this result will have an impact on preparing a medical plan for this year's pandemic.
On chest radiographs, our result showed that airspace pneumonia was the most common in both groups, and this finding corresponded with the study by Aviram et al. (6), in which GGO was the most common finding, because our study did not use the term GGO on chest radiograph. In the children group alone, airspace pneumonia was also the most common finding, unlike in the study of Lee et al. (9), which reported a prominent peribronchovascular marking as the most common finding in a mildly affected group of children aged younger than 20 years. Lee et al. (9) hypothesized that children tend to receive medical attention earlier and do not have a robust immunity, so a relatively small frequency of the abnormalities was seen. As mentioned earlier, because our study was of more recent patients, mild symptoms might not have resulted in the use of chest radiographs. So, an 'earlier mild' finding like a peribronchovascular marking would not be seen on an initial radiograph. In addition, we found that unilateral involvement was a more frequent finding than bilateral, unlike the findings from three previous studies (679). Meanwhile, Kim et al. (17) noted that the pattern of influenza viral pneumonia was initially poorly defined patchy areas of consolidation measuring 1-2 cm in diameter and this pattern is consistent with the bronchopneumonia pattern in our study. The results of several studies on this new viral influenza strain, including our results, indicated that airspace pneumonia or GGO were more common findings than bronchopneumonia, which is somewhat different from the initial findings of the seasonal influenza virus.
At CT, diffuse or patchy areas of GGO mixed with consolidation are frequently seen with seasonal influenza viral pneumonia (17). In our study of this new viral infection, bilateral GGO and centrilobular nodules were most common. In two recent studies of 20 and 7 patients, bilateral GGO and consolidation were most frequently observed and a centrilobular pattern was not evident (818).
In the RT-PCR-based viral confirming test, the cycle threshold (Ct) value is defined as the number of cycles required for the fluorescent signal and is inversely proportional with viral titers (19). It is used to estimate viral titer and it is not used to assess whether the sample is positive or negative for a virus. Although a recent study of Duchamp et al. reported that there was no relationship between Ct value and clinical presentations (10), we would like to detemine if a higher viral titer is related to chest radiographic abnormalities. However, our study showed opposite results to our expectations. The Ct value of the group that had abnormal findings was higher than that of the normal group, and also in each children and adult group, there was no significant difference between normal and abnormal groups (Table 3).
Our study has some limitations. First, our study had a retrospective design. Practically, we could not anticipate the outbreak and the period was too short to prospectively investigate many patients. We believe that reviewing radiologic findings retrospectively can help manage patients for future pandemics. Second, we did not examine the clinical presentation or outcome of patients and could not clarify the relationship between clinical severity and the extent of involvement of the chest seen on radiographs or CT. However, although we focused only on radiologic findings and frequency of abnormality, we can say that our results of the laboratory confirmed population, which is the largest study group to date, reflect the status of the peak outbreak in Korea. Third, patients with virus may also have bacterial infections because we included patients who underwent chest radiographs until 1 week after virus test. It is well-known that superimposed bacterial infection is common in patients infected with the influenza virus and it is major cause of severe clinical progress (2021). Practically, physicians try to reveal the evidence of coinfection or superinfection but they can rarely prove the pathogen. So, we always have secondary infection in mind in patients infected with influenza virus. Even if some patients who showed abnormalities might have unproven superimposed infection, our results showed lower rates of abnormality in chest radiographs, and this result is very meaningful.
In conclusion, among the 3,849 patients infected with the pandemic (H1N1) 2009 virus, only 338 (9%) underwent chest radiographs. Based on these results, we can say that very few patients underwent further radiologic evaluation, which was contrary to our expectation that the concern about this new virus would result in more radiologic studies. Most patients who underwent chest radiographs (85%) showed normal results. Fifty-one (15%) showed abnormal findings on their chest radiographs and children showed abnormalities more frequently than adults. Unilateral airspace pneumonia was the most common pattern in patients, particularly in children with pandemic (H1N1) 2009 influenza virus infection, and those patterns were not different from other usual pneumonia. Lastly, abnormality in chest radiographs was not associated with a higher viral load.

 XML Download