

 PDF
PDF ePub
ePub Citation
 Print
Print


Hepatic angiomyolipoma (AML) is a rare mesenchymal tumor that is primarily composed of mature adipose tissue, smooth muscle cells, and blood vessels in variable proportions (1). According to the tissue components, the tumors can be subcategorized into mixed, lipomatous (≥70% fat), myomatous (≤10% fat), and angiomatous types (2), with the mixed type being the most common. Although treatment for hepatic AMLs remains controversial, conservative management with close follow-up is commonly recommended in patients with asymptomatic or small-sized hepatic AMLs (34). Therefore, an exact preoperative diagnosis of hepatic AMLs is of clinical importance because it may obviate unnecessary surgery.
The imaging findings of hepatic AMLs are diverse due to the various proportions of their three histologic components. The characteristic imaging features of AML are hypervascularity on arterial phase of dynamic imaging, the presence of variable amount of fat, prominent tumoral vessels, early draining vein, and the absence of a capsule (5678). Although the presence of macro- or microscopic fat is highly suggestive of AML, a hepatic AML should be differentiated from other fat-containing lesions such as hepatocellular carcinoma (HCC), hepatic adenoma, lipoma, adrenal rest tumor of the liver, pseudolipoma of Glisson capsule, and hepatic teratoma (9). Among them, differentiation of a hepatic AML from hepatocellular tumors such as HCC and adenoma is of clinical significance due to its overt or potential malignancy. However, due to the rarity of encountering a hepatic AML in daily clinical practice, especially in an endemic area of hepatitis virus infection, most radiologists have a tendency to prematurely call any focal hypervascular hepatic lesions in the liver as HCC and thus, misdiagnose hepatic AMLs. As a result, this misdiagnosis can lead to inappropriate surgical therapy (10).
Theoretically, because hepatic AMLs have an abundant blood pool, hepatic AMLs may show uptake of superparamagnetic iron oxide (SPIO), resulting in a decrease of SI within the lesion on post-SPIO T2-weighted images (T2WI) or T2*WI, as also seen in hepatic hemangiomas (111213). Recently, Jeon et al. (14) reported hepatic AMLs showing an early draining vein and prominent tumoral vessels on triple-phase CT, which are useful CT features to differentiate hepatic AMLs from HCCs. In addition, because hepatic AMLs do not have a hepatocellular origin but rather a mesenchymal origin, hepatic AMLs might be seen as a signal defect in tne hepatobiliary phase when hepatocyte-specific contrast agents are used (15). However, to the best of our knowledge, there have been no prior studies investigating the imaging findings of the hepatic AMLs using SPIO-enhanced MRI or Gadolinium (Gd)-enhanced dynamic MRI. Therefore, the purpose of this study is to analyze imaging findings of histologically proven hepatic AMLs on dual contrast MRI using both SPIO and Gd contrast agents.
Materials and Methods
Patients
From June 2005 to October 2009, eight hepatic AMLs in eight patients were histopathologically proven at our institution. Among the eight patients, three were excluded because they had not undergone SPIO-enhanced MRI. Therefore, five hepatic AMLs in five patients (M:F=1:4; age range, 23-64 years; mean age, 46 years) were included in the study. The diagnosis of hepatic AML was pathologically determined by surgical resection in four patients and percutaneous needle biopsy in one. The type of surgery was a right hemihepatectomy in two patients, left hemihepatectomy in one, and a tumorectomy in one. All patients underwent a multi-detector row CT scan and a dual-contrast liver MRI using SPIO and Gd agents. This retrospective study was approved by our institutional review board, and the requirement for patient written informed consent was waived.
MRI Acquisition
All patients underwent dual contrast MRI using SPIO (ferucarbotran; Resovist®, Bayer Schering Pharma, Berlin, Germany) and Gd agents (Primovist®, gadoxetic acid disodium, Gd-EOB-DTPA, Bayer Schering Pharma, Berlin, Germany [n=3]; MultiHance®, gadobenate dimeglumine, Gd-BOPTA, Bracco, Milano, Italy [n=2]) on a 3.0 T unit (Signa Excite; GE Medical Systems, Milwaukee, WI, USA) with an 8-channel torso phasedarray coil centered on the liver. The field of view was adjusted for patient body size and ranged from 320 to 350 mm.
Dual contrast liver MRI consisted of baseline MR images, SPIO-enhanced images, and Gd-enhanced dynamic images. For baseline MR images, respiratory-triggered and fat-suppressed T2W fast spin-echo (FSE), and breath-hold spoiled dual-echo T1W gradient recalled echo (GRE) images were obtained. Ten minutes after bolus intravenous administration of SPIO, T2W FSE, T2*W GRE, and dual-echo T1W GRE images were acquired. Ferucarbotran was administered at a dose of 1.4 mL for patients weighing 60 kg or more and 0.9 mL for those that weighed less than 60 kg, immediately following a 15-mL saline flush. After the acquisition of SPIO-enhanced images, the Gd agent was injected. For Gd-BOPTA, a rapid bolus injection was administered by hand at a dose of 0.1 mmol/kg. For Gd-EOB-DTPA, an intravenous bolus administration was performed using a power injector (Stellent Dual, Siemens Medical Solutions) at a dose of 10 mL and an injection rate of 1.5 mL/s. Gd injection was followed immediately by a 20 mL saline flush. Next, a dynamic contrast-enhanced MRI (DCE-MRI) including arterial (AP), portal (PP), and equilibrium phases (EP) were acquired 30, 60, and 180 seconds after Gd administration, respectively. For dynamic MR imaging, a chemically selective fat-suppressed spoiled 3D GRE sequence (liver acquisition with volume acceleration, LAVA) was used. In patients that underwent Gd-EOB-DTPA, hepatobiliary phase images were also scanned 20 minutes after Gd injection.
A respiratory-triggered and fat-suppressed T2W FSE sequence was performed using a relaxation time/echo time (TR/TE) of 3,000 to 7,500/97.1, echo-train length of 32, matrix of 512 × 384, chemical shift fat suppression, array spatial sensitivity encoding technique, and an acceleration factor of 2. A breath-hold spoiled T1W dual-echo GRE (in-phase and opposed phase) sequence was performed with a TR/TE of 140/2.4 (for in-phase) and 140/5.8 (for opposed phase), flip angle (FA) of 70°, and matrix, 384 × 256. A breath-hold, T2*W GRE imaging after SPIO administration was obtained using a TR/TE of 130/10, FA of 30°, and a matrix of 384 × 288. For all 2D sequences, a 7-mm slice thickness with a 20% intersection gap was used, which resulted in a 8.4 mm spacing between slices. Acquisition parameters of multiphasic dynamic MR imaging using the LAVA sequence showed a TR/TE of 5.0/2.3, FA of 10°, matrix of 320 × 256, field of view of 320 to 380, array spatial sensitivity encoding technique, acceleration factor of 2, 1 signal acquired, the 36 to 40 partitions interpolated 72 to 80, and an effective slice thickness of 5 mm with a reconstruction interval of 2.5 mm.
Multi-Detector Row CT (MDCT) Acquisition
CT was performed using one of two MDCT scanners: a 16-detector row unit (Sensation 16; Siemens, Erlangen, Germany [n=2]) or a 64-detector row CT unit (Brilliance 64; Philips Medical Systems [n=3]). The respective scanning parameters used for the 16-, and 64-detector row CT scanners were as follows: detector configurations of 16 × 1.5 mm and 64 × 0.625 mm, pitch of 1 and 0.75, rotation time of 0.75 second, kVp of 120, effective mAs of 200, section thickness of 3 mm, and reconstruction intervals of 2 mm. Unenhanced CT images were first obtained in a craniocaudal direction. The dynamic images consisted of three phases: AP, PP, and three minute EP). After acquiring unenhanced liver images, a contrast agent (iopromide [Ultravist 370; Schering, Berlin, Germany]) was administered at a dose of 1.5 cc/kg for 30 seconds, followed by a saline flush at the same contrast injection rate for 10 seconds with a power injector (Multilevel CT; Medrad, Pittsburgh, Pennsylvania, USA). Hepatic AP images were obtained 17 seconds after the enhancement of the descending aorta to 100 HU, as measured by a bolus-tracking technique. Interscan delay for PP after AP acquisition was 30-35 seconds. EP images were obtained 180 seconds after completion of the administration of the contrast medium. The interval between the MDCT examination and MRI ranged from 25 to 180 days (Mean interval, 108 days).
Image Analysis
All CT and MR images of these five patients were retrospectively reviewed by two radiologists (M.U.K with 3 years experience and S.H.K with 11 years experience) in consensus. Tumor size was defined as the largest tumor diameter on transverse CT or MRI scans. Tumor locations were assigned to liver segments in accordance with the Couinaud classification system.
A qualitative analysis was performed by measuring CT attenuation and MRI signal intensity (SI) of the lesion, the presence of fat, hemorrhage, early draining vein, tortuous tumoral vessels, a capsule, and enhancement patterns. CT attenuation of the lesion was analyzed on precontrast, AP, PP, and EP images. MR signal intensity (SI) of the lesion on precontrast T2W FSE, dual-echo T1W GRE, SPIO-enhanced T2W FSE and T2*W GRE images, post-SPIO and pre-Gd 3D FS T1W images, as well as post-Gd AP, PP, EP and hepatobiliary phase images were analyzed. The homogeneity of the lesion was also recorded. SI on MRI and attenuation of the lesion on CT were compared with those of background liver and spleen parenchyma, and categorized as low, iso, slight high, and bright high. The lesion was considered bright high SI when the lesion was brighter than the spleen parenchyma. We also evaluated the presence of the intratumoral fat and intratumoral hemorrhage on CT and MR. The presence of fat was considered when the tumor showed low attenuation compared with normal liver parenchyma on CT with a range of -10 to -100 HU or showed signal drop on an opposed-phase T1W GRE image (16). Determination of intratumoral hemorrhage was based on the reviewers' visual inspection on precontrast CT or pre-Gd T1W images by consensus. The presence of an early draining vein was considered to be positive when a conspicuous dilated or non-dilated vessel originating from the tumor with draining to the hepatic vein, portal vein, or inferior vena cava was seen on the arterial or portal phase. If an early draining vein was depicted, the name of specific vein was recorded (eg. right hepatic vein and middle hepatic vein). When tortuous tumoral vessels were seen, their location (central versus peripheral to the tumor) and type (feeding artery versus draining vein) were also determined. The tumor capsule was defined as a thin enhancing rind on equilibrium phase images. For both CT and MRI, the enhancement pattern of the lesion on dynamic phase images was determined as persistent enhancement throughout the phases or early wash-in and wash-out pattern.
For a quantitative analysis regarding the degree of signal drop, mean SIs of the lesion on both pre-SPIO T2W and post-SPIO T2W images were calculated by measuring and average values of the three regions of interest (ROI) of the lesion on each sequence. Next, the relative signal decrease (RSD) was calculated using the following equation: RSD = [(SI on pre-SPIO T2WI - SI on post-SPIO T2WI)/ SI on pre-SPIO T2WI]*100.
We defined RSD as the ratio of the decrement from the mean ROI value of the lesion on post-SPIO T2W images to the mean ROI value of the lesion on pre-SPIO T2W images.
Results
The viral marker (ex, hepatitis B virus surface antigen, hepatitis C virus antibody) was negative in all patients. Liver function test (ex, serum aspartate aminotransferase, serum alanine aminotransferase, bilirubin) and α FP were within the normal range in all patients. All tumors were solitary lesions and the mean tumor size was 10.4 ± 6.31 cm (range, 3.1 - 20.0 cm) for the longest diameter. Three tumors were located in the right hepatic lobe (segment V/VI, V-VIII, VIII), whereas two were in the left lobe (segment II-IV, III/IV).
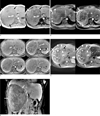
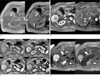
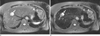
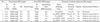
Imaging features on MRI and CT were summarized on Tables 2, 3, 4. On precontrast T1W MR images, all lesions showed low SI. On precontrast T2W images, three lesions showed bright high SI, while the other two showed slight high SI. In three of the five lesions, a signal drop was noted on opposed-phase T1W images, suggesting the presence of fat. Intratumoral hemorrhage was depicted in two lesions on precontrast dual-echo T1W GRE images (Fig. 1). On post-SPIO T2W or T2*W images, signal loss was noted in two lesions which did not have fat within the lesion. This suggested SPIO uptake by the two lesions. The RSD of the two lesions was 21% and 38%, respectively (Figs. 2, 3) and they showed bright high SI on precontrast T2W images. In all five lesions, early draining veins were clearly depicted on arterial phase images and they were all hepatic veins (Figs. 1, 2). Depicted veins are dependent on tumor location. All lesions except for one had tortuous intratumoral vessels at the periphery of the tumor (n=4) and/or central area (n=3) of the tumor (Figs. 1, 2). Tortuous vessels consisted mainly of engorged feeding arteries, but sometimes of draining venous structures. No tumor showed a capsule on equilibrium phase images. All lesions showed hypervascularity on AP images (Figs. 1, 2, 3), except for one lesion which demonstrated persistent enhancement (Fig. 2). All lesions showed an early wash-in and wash-out enhancement pattern on dynamic MR images (Fig. 1). All lesions in three patients who received Gd-EOB-DTPA as a Gd contrast agent, demonstrated homogeneously low SI on hepatobiliary phase images, indicating non-hepatocellular origin tumor (Fig. 1).
On CT, all lesions showed low attenuation on a precontrast scan. Of the five lesions, we could identify the presence of fat in three lesions and hemorrhage in two on precontrast CT images. The series of results including the presence of an early draining vein, prominent tumoral vessels, a capsule, and enhancement pattern of all lesions, were all concordant between triple-phase CT and DCE-MRI.
Discussion
Although characteristic imaging features of hepatic AMLs such as early enhancement, absence of capsule, prominent central vasculatures, and the presence of intratumoral fat have been reported (5678), an exact radiologic diagnosis for hepatic AMLs can sometimes be difficult because hepatic AMLs share imaging features with other fat-containing tumors. Indeed, hepatic AML has usually been misdiagnosed as HCC in more than 50% of cases due to a significant overlap of the imaging findings (171819). Diagnostic difficulty can be increased when hepatic AMLs are lacking a fat component. Unlike renal AMLs, approximately half of the hepatic AMLs lack considerable fat content and usually occur as a solitary hypervascular tumor in the liver (20). Several authors tried to investigate differential imaging features of hepatic AMLs from other mimicking tumors (51420). According to Jeon et al., the presence of an early draining vein connecting with intratumoral vessels, prominent and ectatic nature of tumoral vasculatures, as well as absent tumor capsule, can be useful CT features differentiating fat-deficient AMLs from HCCs (14). However, there have been no reports regarding the differentiation of AMLs from HCCs for MRI features. In our study, we also proved that such useful differential CT findings of AMLs can be depicted on Gd-based DCEMRI. Among them, the presence of an early draining vein is a finding with 100% sensitivity, although the depicted veins are dependent on tumor location. If the tumor is located at the right hepatic lobe, the right and or middle hepatic vein is depicted early on AP images, whereas left and/or middle hepatic veins are visualized early if the tumor is located at the left lobe. Four of the five patients had prominent and tortuous tumoral vessels at the periphery and/or center of the tumor, and they consisted mainly of feeding arterial branches.
In our study, three of the five lesions had intratumoral fat on opposed-phase T1W GRE MR images, whereas the two remaining lesions showed SPIO uptake on post-SPIO T2W or T2*W images. Interestingly, these two characteristic MRI features - the presence of fat within the tumor and SPIO uptake manifesting as signal drop on post-SPIO MR images - were reciprocally demonstrated. Furthermore, two lesions which showed signal loss on post-SPIO images depicted bright high SI on precontrast T2W images. Although imaging findings of hepatic AML on post-SPIO MR images have not been reported yet, we can guess the reason behind the signal loss within hepatic AMLs which didn't have considerable fat after SPIO administration. In hepatic hemangiomas where SPIO particles are not phagocytosed by Kupffer cells, but are diluted in the blood pool, signal loss occurs on post-SPIO T2W images due to slow equilibrium of SPIO particles between the body circulation and the vascular lakes of the hemangiomas (212223). In the same context, because hepatic AMLs that lack fat may have a large proportional content of blood vessels and an abundant blood pool, they would uptake more SPIO particles due to the blood-pool effect, resulting in signal loss on post-SPIO MR images. Such abundant blood pools in hepatic AMLs is responsible for both bright SI on precontrast T2W images and signal drop on post-SPIO MR images. The degree of signal drop can be quantitatively measured as RSD. And from the RSD values, the relative proportion of blood vessels in the tumor can be derived. Although some HCCs may have functioning Kupffer cells resulting in the uptake of SPIO particles due to the phagocytic effect by Kupffer cell, SI on precontrast T2W images will not be so bright as in hepatic AMLs or hemangiomas. Therefore, for fat-deficient hepatic AMLs, a combination of bright SI on precontrast T2W images and signal drop on post-SPIO MR images might be useful MR features to differentiate hepatic AMLs from HCCs when tumors show early washin and early wash-out enhancement patterns on dynamic CT or MRI.
Although it is well-known that the presence of fat helps radiologists to differentiate hepatic AMLs from other hepatic neoplasms, both the sensitivity and specificity for the findings are not high. Indeed, fat-deficient hepatic AMLs have been reported with increasing frequency in recent years (1424), and a variety of fat-containing tumors may mimic hepatic AMLs. Our study also proved this observation. In our study, 40% (2/5) of hepatic AMLs did not have fat based on MRI or from pathologic examination. However, because a direct comparison of MRI findings between hepatic AMLs or other fat containing tumors such as HCCs or adenomas is beyond the scope of our study, a further study using a large study population with various disease entities is strongly warranted.
Gd-EOB-DTPA is a more recently developed hepatocyte-specific MR contrast agent with combined perfusion and hepatocyte-selective properties (2526). The agent has been shown to be highly hepatocyte-specific, with an uptake of approximately 50% of the contrast agent by the organic anion-transporting polypeptide 1 (2728). In many clinical trials, the agent increased the detection of focal liver lesions (29) and provided differential diagnostic information comparable to nonspecific extracellular Gd agents (3031) In the present study, the absence of enhancement was observed in all three AMLs on 20-minute delayed hepatobiliary phase obtained after Gd-EOB-DTPA injection.
There are several limitations in our study. First, the number of patients was small due to the rarity of the condition. Even though our study is the first report analyzing imaging findings on dual contrast MRI using SPIO and Gd contrast agents, further studies using a larger study population is required to generalize our study results. Second, CT protocols are not unified due to the retrospective nature of this study. However, in all patients, MDCT was used with similar in-plane and zaxis resolutions. Therefore, the image quality might be similar throughout the cases. Third, in our study, an exact radiologic-pathologic correlation was not attempted for post-SPIO or post-Gd imaging findings of hepatic AMLs. Fourth, in most countries, ferucarbotran is no longer available as an SPIO-based contrast agent. Therefore, generalization and clinical application of our study results regarding post-SPIO imaging features of hepatic AMLs might be difficult. Furthermore, in two patients who received Gd-BOPTA as a Gd contrast agent for dynamic MRI, we did not obtain delayed hepatobiliary phase images for practical reasons. Because the uptake of BOPTA by hepatocytes requires a longer uptake time (approximately 1 or 2 hours) than Gd-EOB-DTPA, the acquisition of the hepatobiliary phase with Gd-BOPTA might not be practical in a busy clinical practice. Finally, we did not include and analyze other fat-containing hypervascular tumors such as HCCs or adenomas in our study.
In conclusion, the presence of an early draining vein and tortuous tumoral vessels are characteristic DCEMRI features of hepatic AMLs. In addition, all AMLs reciprocally show either of the two MRI findings on SPIO-enhanced MRI: The presence of fat and signal loss by SPIO uptake on post-SPIO images. In fat-lacking hepatic AMLs, a combination of characteristic imaging features on Gd-enhanced MRI and SPIO-enhanced MRI might be useful to diagnose and differentiate AMLs from other hypervascular hepatic tumors.


 XML Download