Journal List > J Korean Soc Radiol > v.63(5) > 1086855

Hong, Yu, Park, Kwon, Chung, Kim, and Kim: Islet Cell Tumors of the Pancreas: A Variety of MultiphaseDynamic Imaging Findings with Pathologic Correlations Focusing on Nonfunctioning Tumors and Insulinomas

Abstract

Islet cell tumors (ICTs) are rare pancreatic neoplasms of neuroendocrine origin, posing a diagnostic challenge to radiologists. We illustrated a spectrum of features of pancreatic ICTs that could be found on multiphase dynamic CT or MRI, and elucidated the histopathologic characteristics by determining the contrast enhancement pattern of the lesions. Various enhancement patterns were dependant on the internal composition of the tumor, that is, the proportion of vascular densities for early enhancement and non-hypervascular interstitial tissue for late enhancement regardless of the size or functional behavior. This knowledge of the imaging-pathologic spectrum of ICTs could be helpful for the proper differential diagnosis from other pancreatic tumors.

An islet cell tumor (ICT) of the pancreas is an endocrine tumor that is clinically classified as functioning or nonfunctioning based on its ability to produce hormones. From a pathologist's viewpoint, however, ICTs are indistinguishable from each other (12). The prompt identification and early treatment of ICTs is of importance because it has been shown to improve the prognosis and life expectancy more than other pancreatic malignancies (3).
The most common and classic findings of functioning ICTs on dynamic computed tomography (CT) are hyperattenuating small lesions (50% of them are less than 1.3 cm) in the arterial phase, which later become inconspicuous in the venous phase (3). Up to 70% of nonfunctioning ICTs also have similar characteristics consistent with arterial enhancements (23). Yet, they are usually larger and more necrotic than functioning ICTs or other pancreatic tumors with or without cystic or calcified components (13). So, nonfunctioning ICTs are not easily distinguishable from other solid or cystic pancreatic tumors, which have different prognoses and need different therapeutic approaches (23). In this article, we presented six pancreatic ICTs (two insuliomas and four nonfunctioning tumors), and illustrated a spectrum of enhancement patterns of the lesions in relation with their histopathologic characteristics.

Imaging Protocol

All multiphase dynamic CT examinations were performed with a conventional helical CT scanner (HiSpeed Advantage; General Electric Medical Systems, Milwaukee, WI, USA) or a multichannel unit (Somatom Sensation 16; Siemens, Erlangen, Germany). After the intravenous administration of 120-150 mL of nonionic contrast agent, iopamidol (Pamiray, Dongkook Pharmaceutical, Seoul, Korea) with an automatic injector at a rate of 3 mL/s, all patients underwent dynamic CT after pre-contrast imaging. In the multichannel unit, aortic enhancement was performed at the start of arterial phase imaging for 15 seconds at 100 Hounsfield units using the SmartPrep technique. Next, portal phase imaging was conducted 30 seconds after the start of arterial phase imaging. The delayed or equilibrium phase was conducted three minutes after the infusion of contrast media. All scans were acquired in the cephalocaudal direction with 3-5 mm thick image reconstruction.
MRI was performed in a 1.5 T system (Magnetom Vision; Siemens, Erlangen, Germany) using a protocol that includes fast spin-echo T2-weighted imaging (TR/TE = 4,060/138 ms, 8 mm section thickness, 1.4 intersection gap, 29 echo train length) followed by preand post-contrast dynamic (arterial, portal and 5-minute delayed phase) imaging using the 2D T1-weighted spoiled gradient echo sequences (TR/TE = 140/2.7 ms, flip angle 90°, 8 mm section thickness). The delay time for arterial and portal imaging was determined by a test bolus examination. Next, gadopentatate dimeglumine (0.1 mmol/kg) was administered with an automatic injector at a rate of 2 mL/s for dynamic imaging. Each imaging procedure was performed during a breath-holding period of 19 to 21seconds.

Correlation of Histopathology with the Imaging Findings

Early-Enhancing Type

Pancreatic ICTs are usually demonstrated as small early enhancing lesions, so they are often difficult to distinguish from normal pancreatic parenchyma. With the advent of the recent multi-slice and multiphase imaging, there has been drastic improvement in the diagnostic accuracy of small ICTs. It was reported in one study that 71 to 82% of insulinomas could be visualized on dual phase imaging by thin slice multidetector CT (3). The main diagnostic clue comes from the hypervascular nature of ICTs. At least 83% of ICTs appear more hyperdense or partially hyperdense than the adjacent pancreatic parenchyma, whether they are functional or not (3). The exact timing of peak enhancement, however, sometimes appeared to lag, and the degree of contrast enhancement on delayed phases tended to vary.

Early Arterial Phase Enhancement

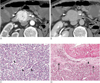
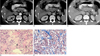
Regardless of tumor size, most pancreatic ICTs show strong early enhancement at the same time as abdominal aortic enhancement. This takes place before peak enhancement of the background pancreatic parenchyma related to the higher vascular densities in the lesion (Figs. 1, 2) (4). It is asserted that the optimal phase of detection for small hypervascular enhancing ICTs is the early arterial phase (5). A recent CT perfusion study has suggested that such a higher blood flow correlated with a high intratumoral microvascular density would be a histoprognostic factor for lower malignant potential compared with other pancreatic ICTs with smaller blood flow (6).

Lagged Peak Enhancement

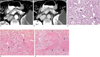
In some cases, tumoral peak enhancement did not occur along with aortic enhancement, and peak enhancement was shown on the parenchymal or portal phase images (Fig. 3) (7). The cause of such lagged peak enhancement has not been well described. The recent perfusion CT study has illustrated a case of a pancreatic endocrine tumor with scanty vasculature and low intratumoral blood flow despite distinguishable contrast enhancement of the lesion (6). Therefore, a lag in the peak contrast enhancement of the tumor after peak arterial enhancement would not be related with high vascular density in pancreatic ICTs, and would ultimately reflect enhancement of the extravascular stroma of the tumor (Fig. 3).
As the inherently shorter time window for arterial enhancement resulted from a small amount of contrast material during the dynamic MRI, we should note that there is the possibility of improper image acquisition causing the missing peak tumoral enhancement.

Sustained Enhancement on Delayed Phase Images

Despite the many early-enhancing ICTs that became isodense or isosignal intensity during the delayed phase of dynamic CT or MRI, they cannot be distinguished from the remaining pancreatic parenchyma; this is especially true for small lesions (3). Regardless of the vascular densities of the tumor, pancreatic ICTs would have variable degrees of interstitial space composed of hyaline or amyloid materials intervening in the tumor cells (8).
In the liver, prolonged enhancement occurs in a mass with a large extent of interstitial space (9). Compared with the normal washout of contrast materials from the tumors without connective tissue stroma (Fig. 1), the presence of connective tissue stroma could explain prolonged contrast enhancement in pancreatic ICTs (Figs. 2, 3).

Hypovascular or Late-Enhancing Type

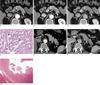
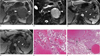
In a minority of pancreatic ICTs, contrast enhancement is not definitely demonstrated in the arterial or portal phase images of dynamic imaging. Enhancement of such tumors is gradual or considerably delayed. In previous reports, abundant amyloid deposits or prominent desmoplastic reactions with relatively smaller vascular volume, were observed in early hypovascular and rather delayed enhancing insulinomas (8). When a large proportion of the tumoral component is replaced by hypovascular connective tissue stroma, there would be minimal enhancement on the early phases of dynamic imaging. However, gradual retention of contrast material in the extracellular interstitial tissue can explain delayed enhancement distinguished from background pancreatic parenchyma with a deficient interstitial volume (Fig. 4). In conjunction with rare invasive features of infiltrative ICTs which spread to adjacent organs and/or distant metastases (1), it is not always easy to differentiate such tumors from common pancreatic cancers of ductal cell origin (Fig. 5).

Cystic or Hemorrhagic Type

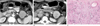
Nonfunctioning ICTs are typically heterogeneous tumors that are larger than functioning ICTs (3). Regardless of functioning status, larger tumors are more likely to have cystic degeneration and central areas of necrosis. Cystic change in pancreatic ICTs has been found occasionally with only a 2-3% incidence among pancreatic ICTs (10). Pathologically, this is explained by the presence of cystic cavities filled with clear fluid or hemorrhage. Moreover, the wall of the cavity is lined with islet cells without sound evidence of necrosis or infarction in most cases (Figs. 3, 6). Despite the secondary features, contrast enhancement of the solid component depends on the tumoral vasculature and fibrotic stroma in the remaining parenchyma (Fig. 3). In the cases of young women, differentiating a cystic or hemorrhagic ICT from a solid pseudopapillary tumor (SPT) is not always easy. However, the more heterogeneous and less hypervascular nature of SPT could be helpful in differentiating them from ICTs on dynamic imaging studies.

Conclusion

In addition to aiding the detection of small lesions, multiphase dynamic CT or MRI can characterize pancreatic ICTs. Pancreatic ICTs have been known as representatives of hypervascular tumors. However, regardless of their size or functional behavior, imaging findings on pancreatic ICTs vary depending on the internal composition. While early hypervascular ICTs show abundant intratumoral vasculature, sustained or delayed enhancement is influenced by the amount of interstitial connective tissue stroma that consists of variable degrees of maturity or degenerative changes. Cystic change takes place during the process of intratumoral hemorrhagic congestion and/or cystic degeneration, which is also one of the representative features of pancreatic ICTs. The aforementioned pathological knowledge on the various enhancement patterns of pancreatic ICTs could help radiologists better understand these tumors and perform a differential diagnosis.

Figures and Tables

Fig. 1

A 70-year-old man with a nonfunctioning islet cell tumor that was found incidentally.

A. A transverse contrast-enhanced CT scan obtained during the arterial phase shows a 3.8 cm, revealed a relatively homogeneous, strongly enhancing mass in the head portion of pancreas (arrowheads).
B. A delayed phase image at the same level as A, showed a markedly decreased attenuation density in the lesion (arrowheads), which is similar to or slightly lower than the intraluminal densities of adjacent vasculatures.
C. A photomicrograph (original magnification × 200, hematoxylin-eosin stain) showed tumor cells with abundant intervening vascular sinusoids (arrowheads).
D. A small vascular structure (arrowhead) in the irregular fibrotic capsule (arrows) was demonstrated. The lesion consists mostly of abundant tumor cells, intervening sinusoids, and scanty fibrotic interstitial space on the photomicrograph (original magnification × 100, hematoxylin-eosin stain).
jksr-63-463-g001
Fig. 2

A 64-year-old woman with functioning insulinoma.

A. Transverse contrast-enhanced CT scan obtained during the arterial phase showed a 1.5 cm homogeneously and strongly enhancing, lobulated mass in the body-tail portion of pancreas (arrowheads).
B. A delayed phase image at the same level as A, showed a sustained contrast enhancement in the lesion (arrowheads).
C. A photomicrograph (original magnification × 200, hematoxylin-eosin stain) showed tumor cells with abundant, variably-sized and intervening vascular sinusoids (arrowheads) in the lesion.
D. Numerous intratumoral thick-walled arterial vasculatures (arrows) were prominently demonstrated on the photomicrograph (original magnification × 200, hematoxylin-eosin stain). Many arterial tumor feeding vessels were also noted in the fibrotic capsule (not shown).
E. Tumoral parenchyma was also found to contain abundant irregular thick fibrous components with sclerotic hyalinized stroma (arrowheads) on the photomicrograph (original magnification × 100, hematoxylin-eosin stain).
jksr-63-463-g002
Fig. 3

A 48-year-old man with multiple, small, well enhancing insulinomas with lagged peak enhancement.

A. On the transverse CT scan of the arterial phase, a 0.7 cm small nodular lesion on the body portion showed slight enhancement (arrowhead).
B. The pancreatic body lesion was more prominently found with strong enhancement (arrowhead) on the portal phase images of dynamic CT.
C. Prominent contrast enhancement was still present (arrowhead) during the equilibrium phase of the post-contrast CT.
D. A photomicrograph (original magnification ×200, hematoxylin-eosin stain) of the solid lesion shows tumor cells with abundant intervening interstitial spaces of loose fibrotic connective tissue. Several small capillary vessels (arrowheads) were scattered in the connective tissue stroma without prominent sinusoidal vascular spaces.
E. An early phase image of a post-contrast CT scan showed a 1.3 cm cystic lesion surrounded by a thin enhancing wall (arrowhead) in the tail of the pancreas.
F. The pancreatic tail lesion still showed a non-enhancing cystic component surrounded by an enhancing wall (arrowhead) on the equilibrium phase imaging (Reprinted with permission from Lippincott Williams & Wilkins).
G. A photomicrograph (original magnification × 20, hematoxylin-eosin stain) of the cystic lesion showed a cystic space lined by tumorous islet cells.
jksr-63-463-g003
Fig. 4

A 46-year-old man with an incidentally found nonfunctioning islet cell tumor showed gradual and delayed contrast enhancement during a dynamic CT examination.

A. A post-contrast CT scan obtained during the arterial dominant phase shows a 5 cm well-defined, marginally-enhancing and lobulated mass (arrowheads) in the tail of the pancreas. On the pre-contrast images, the mass demonstrated isoattenuation with the adjacent pancreatic tissue (not shown).
B. On three-minute- delayed-phase CT, markedly higher attenuation density of the mass (arrowheads) permitted the lesion to be well distinguished from the remaining pancreatic parenchyma.
C. The mass is mostly composed of amorphous sclerotic stroma with scanty tumor cells (arrow) on photomicrograph (original magnification × 200, hematoxylin-eosin stain). On Congo-red staining, the mass was hyalinized amyloid stroma (80%), showing birefringence (not shown).
jksr-63-463-g004
Fig. 5

A 59-year-old man with abdominal pain and jaundice showed a malignant islet cell tumor mimicking a ductal cell adenocarcinoma in the tail of pancreas.

A. On the transverse arterial phase dynamic CT scan, the poorly defined hypovascular lesion (arrowheads) in the tail of pancreas was found to be associated with a retracted contour of pancreatic parenchyma and direct invasion of the splenic vein. Hepatic metastasis showed a relatively high attenuation density due to the low attenuation of background hepatic parenchyma with diffuse fatty infiltration (arrow).
B. Portal phase dynamic CT showed slight enhancement of the pancreatic lesion (arrowheads) with direct invasion of the splenic vein. Ring-like peripheral enhancement of the hepatic lesion (arrow) was also noted.
C. Three-minute-delayed post-contrast CT showed a greater attenuation density of the primary pancreatic lesion with marginal spiculations, suggesting invasive tumor growth (arrowheads).
D, E. A photomicrograph (original magnification × 200; D, hematoxylin-eosin stain; E, trichrome staining) of a sonography-guided liver biopsy specimen shows metastastic pancreatic endocrine tumor cells with abundant intervening thick collagenous bands (arrows).
jksr-63-463-g005
Fig. 6

A 53-year-old man with a nonfunctioning islet cell tumor in the tail of the pancreas showed marked intratumoral hemorrhage mimicking a complicated cystic neoplasm.

A. A T1-weighted transverse MRI illustrated intermediate signal intensity of the lesion surrounded by a hypointense fibrotic wall (arrowheads). Hypointense multiseptations were also defined within the lesion.
B. A fat-suppressed T2-weighted MRI demonstrated a relatively homogeneous and hyperintense internal component with hypointense septa and an outer wall (arrowheads).
C, D. An arterial phase (C) and equilibrium phase (D) dynamic MRI showed the contrast enhancement of intralesional septa (arrowheads).
E. A photomicrograph (original magnification × 200, hematoxylin-eosin stain) showed scanty cellular islands separated by blood-filled stroma, suggesting the presence of conspicuous intratumoral hemorrhage.
F. Markedly-dilated thick- and thin-walled vascular structures were filled with blood clots (arrows), suggesting severe intratumoral congestion on the photomicrograph (original magnification × 100, hematoxylin-eosins).
jksr-63-463-g006

References

1. Eriguchi N, Aoyagi S, Hara M, Fukuda S, Tanaka E, Hashimoto M. Nonfunctioning islet cell carcinoma of the pancreas: an evaluation of seven patients who underwent resection followed by long-term survival. Surg Today. 1999; 29:233–237.
2. Procacci C, Carbognin G, Accordini S, Biasiutti C, Bicego E, Romano L, et al. Nonfunctioning endocrine tumors of the pancreas: possibilities of spiral CT characterization. Eur Radiol. 2001; 11:1175–1183.
3. Sheth S, Hruban RK, Fishman EK. Helical CT of islet cell tumors of the pancreas: typical and atypical manifestations. AJR Am J Roentgenol. 2002; 179:725–730.
4. Rodallec M, Vilgrain V, Couvelard A, Rufat P, O'Toole D, Barrau V, et al. Endocrine pancreatic tumours and helical CT: contrast enhancement is correlated with microvascular density, histoprognostic factors and survival. Pancreatology. 2006; 6:77–85.
5. McAuley G, Delaney H, Colville J, Lyburn L, Worsley D, Govender P, et al. Multimodality preoperative imaging of pancreatic insulinomas. Clin Radiol. 2005; 60:1039–1050.
6. d'Assignies G, Couvelard A, Bahrami S, Vullierme MP, Hammel P, Hentic O, et al. Pancreatic endocrine tumors: tumor blood flow assessed with perfusion CT reflects angiogenesis and correlates with prognostic factors. Radiology. 2009; 250:407–416.
7. Ichikawa T, Peterson MS, Federle MP, Baron RL, Haradome H, Kawamori Y, et al. Islet cell tumor of the pancreas: biphasic CT versus MR imaging in tumor detection. Radiology. 2000; 216:163–171.
8. Iglesias A, Arias M, Casal M, Páramo C, Fiaño C, Brasa J. Unusual presentation of a pancreatic insulinoma in helical CT and dynamic contrast-enhanced MR imaging: case report. Eur Radiol. 2001; 11:926–930.
9. Itai Y, Ohtomo K, Kokubo T, Yamauchi T, Minami M, Yashiro N, et al. CT of hepatic masses: significance of prolonged and delayed enhancement. AJR Am J Roentgenol. 1986; 146:729–733.
10. Park MS, Kim KH, Lim JS, Lee JH, Kim JH, Kim SY, et al. Unusual cystic neoplasms in the pancreas: radiologic-pathologic correlation. J Comput Assist Tomogr. 2005; 29:610–616.
TOOLS
Similar articles