

 PDF
PDF ePub
ePub Citation
 Print
Print


In the general population, the incidence of pulmonary embolism (PE) is two to three patients for every 1,000 who present with nonspecific clinical signs and symptoms (1). In patients with a malignant tumor, the incidence of PE is increased by 4-6 times compared to the general population who present with nonspecific clinical signs and symptoms. The risk of thrombus formation increases even more in patients who are receiving chemotherapy and have an increased risk of mortality (2). Therefore, the diagnosis of PE is essential and the diagnostic accuracy must be enhanced using the appropriate diagnostic equipment. Imaging modalities for PE include perfusion-ventilation scan, pulmonary angiography, spiral CT, and MR angiography. CT is less invasive than conventional pulmonary angiography and has the advantage of visualizing the emboli within the pulmonary vessels, and it as a result, is accepted as the standard diagnostic tool for PE in many medical institutions (3). If a specific pattern of pulmonary embolus formation including size and location exists, this scan could provide additional diagnostic information in those patients on chemotherapy presenting with signs and symptoms of pulmonary embolism. Knowing the size and location of thrombus formation could help in instances when there is a diagnostic dilemma between the volume averaging artifact and a true pulmonary arterial filling defect. The benefits of increased accuracy include a timely diagnosis and management, and thus a decrease in mortality (4). Prior studies have studied the location and size of pulmonary thrombus formation in the general population, but to the best our knowledge, there are no reports in the medical literature which have studied the location and size of PE formation in patients that are undergoing chemotherapy. Therefore, the purpose of this study is to evaluate and compare the prevalent location and size of thrombus formation in patients exposed to chemotherapy to non-cancer patients utilizing CT angiography.
Materials and Methods
Patients
This study was conducted in 101 patients who underwent CT pulmonary angiography or chest CT scan and who had a positive diagnosis for PE between July 2005 and February 2008. The patient population consisted of 51 men and 50 women, ranging in age from 26 to 94 years with a mean age of 59 years. Forty nine patients (48.5%) from this group presented with symptoms suspicious for PE and the remaining 52 patients (51.5%) were scanned for other reasons such as cancer surveillance. Twenty three patients (22.7%) had a prior history of chemotherapy or were currently receiving it and had a histologically confirmed diagnosis of malignancy. Among the chemotherapy group, 12 patients had lung cancer, 3 had stomach cancer, 2 had colorectal cancer, 1 had a gastric gastrointestinal stromal tumor, 2 had a thymic carcinoma, and 3 had breast cancer. Among them, 12 patients had metastases to the liver, lung and pleura. The remaining 78 patients had no prior history of cancer or exposure to chemotherapy. Within the chemotherapy group, 6 patients (23.1%) were evaluated by CT for clinical symptoms suspicious of PE, while the remaining 17 patients (76.9%) were scanned for other reasons such as cancer surveillance and the diagnosis of PE was incidentally detected.
Review of the Medical Records
A retrospective review of the medical charts was performed in order to evaluate the cycle and time frame of chemotherapy treatment in relation to the development of PE, patient demographics, whether the CT scan was performed to evaluate for the presence of PE, or for other reasons such as cancer surveillance. Additionally, other risk factors leading to the development of a pulmonary embolus were assessed including long-term immobilization, recent history of deep vein thrombosis (up to 1 year), presence of congestive heart failure, recent history of a fracture, history of coagulopathy, pregnancy, obesity, or a prior history of oral contraceptive use or anticoagulation therapy.
Scanning Technique
CT pulmonary angiography was performed using 64 multidetector row CT (MDCT) (Brilliance 64, Philips, Cleveland, Ohio) and 16 MDCT (LightSpeed 16, GE, Milwaukee, Wisconsin along with a power injector and 100 mL of noninonic contrast material administered in the antecubital vein at a rate of 4 mL/sec. CT scanning delay time was determined using the bolus-tracking technique in the lumen of the pulmonary trunk. The threshold value was selected as 120 HU. Parameters for the CT pulmonary angiography using 64 MDCT included a slice thickness of 1 mm, 120 kVp, 220 mA, 18.75 mm/rotation speed of table, pitch of 0.938, and 350 FOV. Parameters for the CT pulmonary angiography using 16 MDCT included a slice thickness of 1.25 mm, 120 kVp, 635 mA, 18.75 mm/rotation speed of table, a pitch of 0.938, and 350 FOV. The reconstructed images were obtained at a slice thickness of 1 mm.
Chest CT was performed using 64 MDCT (Brilliance 64, Philips, Cleveland, Ohio) and 16 MDCT (LightSpeed 16, GE, Milwaukee, Wisconsin) along with a power injector and 100 mL of noninonic contrast material administered in the antecubital vein at a rate of 4 mL/sec. Scanning was started 25 sec after the beginning of contrast administration. Parameters for the chest CT using 64 MDCT included a slice thickness of 1 mm, 120 kVp, 250 mA, 18.75 mm/rotation speed of table, a pitch of 0.673, and 340 FOV. Parameters for the chest CT using 16 MDCT were slice thickness 1.25 mm, 120 kVp, 200 mA, 18.75 mm/rotation speed of table, a pitch of 0.938, and 340 FOV. The reconstructed images were obtained at a slice thickness of 2.5 mm.
Twenty-six patients were scanned by CT pulmonary angiography using 64 MDCT, whereas 23 patients were scanned by CT pulmonary angiography using 16 MDCT, another 34 patients by chest CT using 64 MDCT, and finally, 18 patients by CT pulmonary angiography using 16 MDCT.
Image Review
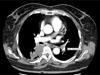
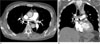
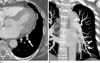
On CT scans, two parameters (location and volume) of the PE were analyzed. The locations of the emboli included the main pulmonary artery, lobar pulmonary artery, segmental pulmonary artery, or subsegmental pulmonary artery, based on the location of the largest pulmonary arterial branch involved with PE. The size of the embolus was determined by obtaining the volume of the largest embolus using the three-dimensional reconstruction software VoxelPlus (VoxelPlus. 2. ver. 2.5.6.5009; Mevisys, Daejeon, Korea). The area of the embolus was measured in each slice (slice thickness of 0.1 m) by manually drawing a line along the margin of the embolus. The areas of each slice were summed up to calculate the volume (Fig. 1). The images were then reviewed by 2 independent radiologists and consensus was reached for any discrepancies.
Statistical Analysis
The location and size of the emboli were compared between the following paired groups: Patients exposed to chemotherapy versus those without cancer; patients exposed to chemotherapy who were evaluated for symptoms of PE versus patients exposed to chemotherapy whose PE was incidentally found; those with specific risk factors of PE including long-term immobilization, a recent 1-year history of deep vein thrombosis, congestive heart failure, a recent history of fracture, blood coagulation disorder, pregnancy, obesity and the history of the use of oral contraceptives including estrogen or anticoagulation therapy versus those without a specific risk factor; female versus male patients. The differences in location of the embolus were analyzed using the Chi-square test, whereas the differences in size were determined with a t-test. A value of p < 0.05 was considered statistically significant.
A multiple linear regression was performed to determine whether exposure to chemotherapy had a significant effect on the location and size of PE formation compared to other variables such as other specific risk factors for the development of PE.
Results
Location
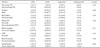
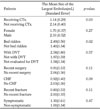
In the chemotherapy group, the locations of the largest pulmonary embolus were in the main pulmonary artery in 5 cases (21.7%), lobar pulmonary artery in 7 cases (30.4%), segmental artery in 9 cases (39.1%), and subsegmental artery in 2 cases (8.7%). In the non-cancer group, the locations of the largest embolus were in the main pulmonary artery in 8 cases (10.3%), lobar pulmonary vessels in 42 cases (53.8%), segmental vessels in 26 cases (33.3%), and subsegmental vessels in 2 cases (2.6%). The difference between both groups was not statistically significant (p = 0.12) (Table 1).
Sex and other risk factors of PE, including a long-term immobilization, deep vein thrombosis, a recent 1-month history of surgery, congestive heart failure, myocardial infarction, and a recent 1-month history of fracture did not significantly affect the location of PE (Table 1).
Size
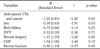
The average size of the largest PE was smaller (mean volume = 1.14 mL [standard error = 0.294]) in the chemotherapy group versus the non-cancer group (mean volume = 2.14 mL [standard error = 0.404]). The difference was statistically significant (p = 0.04) (Table 2).
Sex and other risk factors of PE, including long-term immobilization, deep vein thrombosis, a recent 1-month history of surgery, congestive heart failure, myocardial infarction, and a recent 1-month history of fracture did not significantly affect the size of PE (Table 2).
A multiple linear regression demonstrated that the overall size of the PE was smaller in the chemotherapy group compared to the non-cancer group when similar risk factors for the formation of PE were present (p = 0.05) (Table 3).
Discussion
Chemotherapy has traditionally been associated as a risk factor for the development of PE, which is a cause of high mortality rate in this group. In a large autopsy series, a fatal PE was diagnosed before death in only 32% of patients (5). It has also been reported that the proportion of cases in which PE is incidentally diagnosed represented approximately 1% to 4-5% in hospitalized patients, and this further increased to 70-83% in those with a malignant tumor (6). When treated conventionally, there is only an 8% recurrence rate and a 2.5% fatality rate in patients according to the data from the Prospective Investigation of Pulmonary Embolism Diagnosis (PIOPED) (3). Having knowledge of the characteristic CT findings such as its prevalent location, size, and the period where it usually occurs, could provide useful information in those instances where there is a difficulty in detecting a pulmonary arterial filling defect or differentiating between a thrombus and partial volume averaging artifact. In a study with 30 patients, peripheral pulmonary arteries down to fifth-order branches were accurately depicted with reconstructed 1.25-mm sections by using multi-detector row spiral CT (7). A low threshold suspicion or a screening CT scan can also be performed at the most prevalent period of thrombus formation in patients undergoing chemotherapy, and thus, increase the detection of PE. To date, many studies have been performed in order to examine the CT findings of PE in a normal patient population. However, to our knowledge, there are no reports in the medical literature that have studied pulmonary embolism detection with CT in patients undergoing chemotherapy.
In more than 70% of the normal population, the largest PE was in the pulmonary arteries whose diameter is greater than the segmental pulmonary arteries. Some studies have reported that the most common location of the largest PE was found to be in the lobar pulmonary vessel (28.5%) (4). Our study also demonstrated similar results; a lobar pulmonary artery was present in 53.8% of patients who did not receive chemotherapy. In patients who had exposure or were receiving chemotherapy, however, the segmental pulmonary vessels were the most prevalent location (39.1%). This difference was however not statistically significant (p = 0.12).
To our knowledge, the size of the largest PE has not been reported in previous studies. In the current study, the size of the largest PE was calculated to have a mean volume of 2.14 mL (standard error = 0.404) in patients without cancer and 1.14 mL (standard error = 0.029) in patients undergoing chemotherapy. These results indicate that chemotherapy had a statistically significant effect on the size of the pulmonary embolus (p = 0.04). We assumed that the reason the PE was smaller was that for anti-neoplastic chemotherapy patients the majority of PE were detected in surveillance CT before the symptom developed. Other risk factors including long-term immobilization, deep vein thrombosis, a recent 1-month history of surgery, congestive heart failure, and a recent 1-month history of fracture, were found to not significantly affect the size of PE. The incidence of PE was highest in the third cycle (30.4%) and fourth week following anti-cancer chemotherapy (17.4%).
In more than 50% cases, PE developed earlier than the third cycle and fourth week following anti-neoplastic chemotherapy. However, anti-neoplastic chemotherapy protocols are extremely heterogeneous in our patients. A further study of patients with the same pathology, stage, and anti-neoplastic chemotherapy protocol would enable the determination of the significant prevalent period of developing PE.
Our study had some limitations; first, the study population is small and the number of patients on chemotherapy compared to the control group was uneven. Furthermore, within the study group, there was variability in the chemotherapy regimen as well as the type of cancer studied. The multiple linear regression demonstrated that the size of the PE was smaller in patients undergoing chemotherapy when taking into account other specific risk factors of PE (p = 0.05). There was also variability in the CT scan protocol performed, as some were detected incidentally for other reasons such as cancer surveillance and required different parameters compared to the standard CT angiography performed for the suspicion of PE. This could in turn affect the detection rate and accuracy of measuring the size of the embolus.
In summary, for patients undergoing chemotherapy treatment, there may be a role for screening with thin slice CT pulmonary angiography at the most prevalent periods. Furthermore, chemotherapy appears to decrease the size of thrombus formation, which may affect its location. These may provide useful information for the evaluation of PE, which can lead to a timely diagnosis, management, and reduction in mortality rate.
 XML Download