

 PDF
PDF ePub
ePub Citation
 Print
Print


A variety of liver specific MRI contrast agents have been developed over the last 10 years for the improvement of lesion detection and characterization. Among them, gadolinium ethoxybenzyl diethylenetriaminepentaacetic acid (Gd-EOB-DTPA); is a combined extracellular and hepatobilliary agent that can be administered as a bolus injection with a higher biliary excretion fraction (1). Gd-EOB-DTPA-enhanced MRI increases the detection of focal liver lesions and provides more highly differentiated diagnostic information that is comparable to dynamic liver CT (234). In several liver MRI contrast studies, Gd-EOB-DTPA provided more accurate diagnostic information than other contrast agents (5678). The hepatobiliary phase is essential for lesion detection and characterization; however, this phase adds over 20 min to the process. This time consuming step has been known as the weak point of Gd-EOB-DTPA enhanced MR imaging (910).
T2-weighted images (T2WI) of liver MRI have been essential for both the detection and characterization of focal liver lesions (11). In a liver MRI with Gd-EOB-DTPA enhancement, the recommended routine protocol is performing the T2WI before the dynamic T1WI. Previous studies (1213), showed that gadolinium-enhanced T2WI had a tendency to improve the conspicuity of focal liver lesions over unenhanced T2WI. This was probably because of the paramagnetic T1-shortening effect that is characteristic of gadolinium (1213). Using Gd-EOB-DTPA enhanced MRI, some authors proposed that T2WI might be acquired immediately after contrast injection (14). However, no clinical data was available on whether T2WI after Gd-EOB-DTPA enhancement would affect the overall image quality and lesion conspicuity. The purpose of this study was to compare the image quality, lesion conspicuity, artifacts, and lesion contrast between pre-contrast and post-contrast T2WI in Gd-EOB-DTPA-enhanced MRI.
Materials and Methods
This retrospective study was approved by the institutional human ethics boards at our institution and was Health Insurance Portability and Accountability Act (HIPAA) compliant. Informed consent for review of the patients' records and images was not required.
Subjects
Patients who underwent routine liver MRI with Gd-EOB-DTPA that included pre-contrast and post-contrast T2WI were included in this study. Imaging was performed from February to March of 2008 and included a total of 50 patients (30 men and 20 women). No patient was excluded on the basis of image quality or breath-holding ability. The mean patient age was 57.8 years (range, 31-85).
A total of 41 lesions from the 50 patients were analyzed. In the case of multiple lesions, the largest lesion was regarded as the representative lesion for a given patient. A lesion less than 1 cm in size was excluded because it would be difficult to evaluate the SNR & CNR. Nine patients were free of any lesions. Proof of lesion was based on a combination of the review of the pathological results, laboratory findings, and image findings. Pathological proof was based on liver biopsy results in eight cases and examination of surgical specimens in two cases. In cases of no pathological proof, we used the imaging findings and clinical laboratory data for diagnosis. Twelve of the focal liver lesions were hepatocellular carcinoma (HCC), whereas 10 cases were metastases (intrahepatic metastases of cholangiocarcinoma: 3; stomach: 3; colorectal: 2; ovary: 1; gastrointestinal stromal tumor: 1). Furthermore, 14 cases were cysts, and five cases were hemangiomas.
Of the 12 patients with HCC, six were diagnosed by percutaneous liver biopsy, and one was diagnosed by the examination of the surgical specimen. The remaining five were presumed to be HCC on the basis of serological markers including AFP and typical imaging findings. We identified a focal lesion as HCC if it showed low signal intensity on T1WI, high signal intensity on T2WI, early arterial enhancement, and delayed washout on the dynamic study of T1WI and low signal intensity on the 20 min hepatobiliary phase. Metastases were diagnosed by percutaneous liver biopsy in two patients. One was diagnosed by surgical specimen, whereas another seven were diagnosed on the basis of imaging findings that progressed in a follow-up series. No cases of non-solid lesions such as hemangiomas or cysts were pathologically confirmed. All lesions were diagnosed on the basis of characteristic imaging findings. Cysts were diagnosed if they had a thin, smooth wall with no enhancement on contrast-enhanced MRI or CT. Anechoic lesions with posterior enhancement on ultrasonography (US) were also regarded as cysts compared to other imaging modalities such as CT or MR. Hemangiomas were diagnosed by their characteristic imaging features, which include progressive nodular enhancement by contrast-enhanced MRI or CT, as well as uniform hyperechogenicity by US.
MRI Technique
All MR imaging was conducted using a 3.0 T super-conducting imager (Magnetom Trio a Tim; Siemens, Enlargen, Germany), and a combination of a body matrix coil and a spinal matrix coil (TIM coil) for signal reception. The baseline MR images included a fat-suppressed respiratory-triggered T2-weighted turbo spin-echo sequence (T2TSE, TR/TE 4000-6500/76, echo train length 10, 140°flip angle, matrix 202 × 320, 3 mm slice thickness), a breath-hold T2*-weighted gradient recalled-echo (GRE) sequence (TR/TE of 180/12, 30°flip angle, matrix 144 × 256, and two acquisitions), HASTE sequence (TR/TE 400/146, 150°flip angle, matrix 166 × 256, and a 3 mm slice thickness) and a breath-hold T1-weighted fast low-angle shot (FLASH) sequence (TR/TE of 172/2.5, 65°flip angle, matrix 208 × 256, signal average one, two acquisitions, and a 5 mm slice thickness).
Dynamic imaging (volumetric interpolated breath-hold examination, VIBE: Siemens, Erlangem, Germany) was performed after IV injection of the contrast, 0.1 ml/kg of gadoxetic acid based contrast medium (gadoxetic acid disodium [Gd-EOB-DTPA] [Primovist, Bayer Schering Pharma]), using the following parameters: T1-weighted VIBE fat suppressed axial (TR/TE: 3.37/1.23), obtained during the early arterial (20 seconds), late arterial (40 seconds), portal venous (65 seconds), equilibrium (3 minutes), and hepatobiliary (20 minutes) phases. Contrast media was injected using an automated injector (Spectris MR; Medrad Europe, Maastricht, Netherlands) at a rate of 2cc/sec and flushed with 25 cc of saline solution after the contrast injection. Between the equilibrium phase (3 minutes) and the hepatobiliary phase (20 minutes), we repeated the T2TSE, T2*, and HASTE images as a post-T2WI.
Image Analysis
For the qualitative analysis, MR images were retrospectively analyzed by two experienced radiologists with 12 and 6 years of experience in abdominal MRI. The radiologists were blinded to patient identification, clinical history, biopsy results, and other imaging findings. Three sequences with pre-contrast and post-contrast images were evaluated for each case: T2TSE,HASTE and T2* images. The reviewers graded the overall image quality, lesion conspicuity and artifacts on a 5-point scale. The overall image quality and lesion conspicuity were scored as follows: 1, unacceptable; 2, poor (significantly blurred organ margins and/or poor vessel definition); 3, fair (moderate blurring); 4, good (minimal blurring); 5, excellent (very sharp boundaries). Artifacts were graded as follows: 1, severely degrading (80-100% of image); 2, moderate (80-60% of image); 3, mild (60-30% of image); 4, minimal (10-30% of image); 5, absent (<10% of image).
For the quantitative analysis, the signal intensities of the liver parenchyma and focal liver lesion with the standard deviation (SD) of the background noise, were obtained by a radiologist who did not participate in the qualitative analysis. The region of interest (ROI) was set in the same location for each sequence on pre-contrast and post-contrast T2WI. Liver signal intensities were measured with a circular ROI of a constant size, placed to avoid major intrahepatic vessels and prominent artifacts. Measurements were performed three times and were averaged. The SD of the background noise was measured anterior to the abdomen (phase encoding direction) in the ROI with the same size and location on pre-contrast and post-contrast T2WI. The signal intensity of the nodular lesion was measured using the largest possible circular ROI located within the lesion. Signal-to-noise ratio (SNR) was calculated by dividing the liver signal intensity by the SD of background noise. Contrast-to-noise ratio (CNR) was calculated by dividing the difference between lesion and liver signal intensities by the SD of background noise:
SNR = SI liver/SD noise
CNR = [SI lesion- SI liver]/SD noise
Statistical Analysis
Statistical analysis was performed using the SPSS statistical software (version 12.0 for Windows, SPSS, Chicago, USA). The alpha level was set at p=0.05 for all tests. The qualitative scoring of imaging pairs (pre-contrast and post-contrast images in T2TSE, HASTE, and T2* sequences) was evaluated with the sign test. The statistical significance of the data from quantitative analysis was assessed using a paired t-test. The subgroup analysis of the focal lesions was performed using Fisher's exact test.
RESULTS
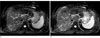
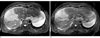
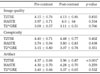
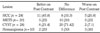
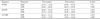
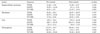
The results of qualitative analysis of the overall image quality, lesion conspicuity, and artifacts on pre- and post-contrast T2WI are shown in Table 1. No statistically significant difference was seen regarding the overall image quality and lesion conspicuity, between pre-contrast and post-contrast T2WI. The mean value of the artifacts was significantly higher on pre-contrast images in T2TSE (p<0.001), which meant that post-contrast T2TSE had more artifacts. The results of the qualitative analysis of lesion conspicuity on the comparison of post- and pre-contrast images are shown in Table 2. These results show the differences in lesion conspicuity between the two readers. On T2TSE and HASTE sequences, pre- and post-contrast images were not significantly different, however there was a trend toward improved conspicuity was observed for post-contrast images. Lesion conspicuity was poorer on post-contrast images on T2*GRE, but the difference was not statistically significant. Table 3 shows the conspicuity of focal lesions on T2TSE, which showed no statistically significant difference between pre- and post-contrast T2TSE. However, in the case of HCC, there was a trend toward improved conspicuity on T2TSE (Fig. 1). No significant difference was seen between pre- and post-contrast T2TSE for lesion conspicuity of metastases (Fig. 2).
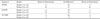
The results of the quantitative analysis for SNR and CNR are shown in Table 4. For T2TSE, the SNR for post-contrast images was significantly higher than for pre-contrast images (p=0.04). For other sequences, pre- and post-contrast images were not found to be significantly different. Table 5 illustrates the results of the CNR for focal liver lesions in pre- and post-contrast T2WI. The CNR of HCC had a tendency to increase in the post-contrast T2TSE and HASTE images. Conversely, in the case of metastases, the CNR decreased in post-contrast T2TSE images. For cysts an increase in CNR was observed in post-contrast T2TSE and HASTE images. Lastly, hemangiomas showed a decrease in the CNR in post-contrast HASTE images. However, in the all cases, no significant differences were found between the imaging comparisons.
DISCUSSION
Liver MRI with variable contrast agents is an established diagnostic modality for liver malignancies (34). Liver-specific contrast agents such as reticulo-endothelial or hepatobililary agents have shown an increase in the detection rate compared to CT (315). Gd-EOB-DTPA is a paramagnetic liver-specific contrast agent (1). In addition to having the extracellular property of Gdchelates, it has hepatobilliary properties, and uptake into hepatocytes is followed by biliary excretion in the hepatobiliary phase. In the early dynamic phase, the observed enhancement pattern is similar to other extracellular contrast agents, which is effective for characterizing lesions. In the hepatobiliary phase, because of functional hepatocyte-selective enhancement, tissue without normal hepatocytes shows poor enhancement. Subsequently, lesions without normal hepatocytes can be easily detected as having low signal intensity on hepatobiliary phase of Gd-EOB-DTPA enhaned MRI. Such characteristics are known to be caused by the contrast uptake of the anionic transporter protein of hepatocytes (116). Variable liver MRI contrast agents have been compared to Gd-EOB-DTPA in many clinical and experimental studies (Cite the studies - SD). Gadobenate dimeglumine (Gd-BOPTA) is a paramagnetic gadolinium-based contrast agent that behaves in a manner analogous to that of other gadolinium-based agents during the vascular-interstitial phase, and has liver-specific properties in a later delayed phase that are similar to Gd-EOB-DTPA. In a comparative study of two MR hepatobiliary gadolinium chelates, Gd-BOPTA and Gd-EOB-DTPA, the authors suggested the optimal imaging time of delayed scans as being 20-45 min post-injection with Gd-EOB-DTPA and 60-120 min post-injection with Gd-BOPTA (617). Other than the patient with Gd-BOPTA enhanced MRI, each patient had to take the MR exam a second time, due to the late optimal imaging time of the delayed scan.
Despite such advantages, a delayed hepatobiliary phase of over 20 minutes was essential for lesion detection in Gd-EOB-DTPA-enhanced MRI (9). Therefore, following contrast injection, patients had to spend an additional 20 minutes in the MR scanner with its considerable noise and somewhat unpleasant atmosphere, for Gd-EOB-DTPA-enhanced MRI. Twenty minutes was too short a time period to rotate the patient, so economical efficiency was decreased. To attempt to decrease the total time spent by a patient in the MR scanner, some authors advised administering the agent immediately after acquisition of unenhanced T1WI, followed by the acquisition of the T2WI (9). In the absence of clinical evidence to support that T2WI after Gd-EOB-DTPA enhancement would not affect image quality, we compared pre- and post-contrast T2WI for overall image quality, lesion conspicuity, and artifacts. We presumed that if no significant difference was observed between pre- and post-contrast T2WI, we could replace pre-contrast imaging with post-contrast imaging.
The conventional T2-weighted spin-echo sequences have been used to detect and characterize focal liver lesions, but fast spin echo (FSE) has also been substituted for conventional T2-weighted spin-echo sequences, to decrease examination time. Multiple, rapidly repeated refocusing RF pulse of the FSE sequence; however, attenuates the contrast between intrahepatic solid lesions and liver parenchyma, because of magnetization transfer saturation effects (18). The focal lesion usually has a longer T1 relaxation time compared to the surrounding liver parenchyma; hence, it has a slow rate of recovery after magnetization transfer saturation. Previous studies (13) have shown that when a lesion contains a paramagnetic component such as a gadolinium contrast agent, it recovers rapidly after magnetization saturation and loss of signal intensity can be reduced. The contrast of a solid lesion was reported to improve after gadolinium enhancement on a T2-weighted FSE image (1213); hence, Gd-EOB-DTPA is expected to also have this effect, because it is also a gadolinium chelate.
A qualitative analysis of image quality and lesion conspicuity showed no significant differences between pre- and post-contrast T2WI for all T2 sequences. Although no statistical significance was detected, lesion conspicuity showed a trend toward an improvement in post-contrast images by the T2TSE and HASTE sequence. We hypothesize that this is due to signal decay of the background liver parenchyma in T2WI from gadolinium, based on the increased T2* effects. Decreased signal intensity of the liver parenchyma may help increase the contrast between the liver and the focal lesion. Artifacts were significantly poor on post-contrast T2TSE. In other sequences, a trend towards a worsening artifact on post-contrast images was observed; however, this was not statistically significant. The reason for this result is not known, but is presumed to be due to motion artifacts. Post-contrast T2WIs were obtained at the end of the examination when images were prone to motion artifacts from patient stress, which might affect image analysis. Although post-contrast T2TSE had significantly more artifacts, they seemed to not be influential in daily practice, as shown by a review of the scores (Table 1).
The SNR of post-contrast T2TSE was significantly higher than the SNR of pre-contrast T2TSE (p=0.04). As previously noted, the signal intensity of the liver had to be decreased in post-contrast T2WI because of T2* effects, which may increase lesion conspicuity in post-contrast images. We cannot precisely explain why the SNR of post-contrast T2TSE was higher in our study. We assumed that decreasing the background noise (SD) on post-contrast T2WI may have been the cause.
A subtype analysis for the focal lesions showed no significant difference between pre- and post-contrast T2WI. We presume this to be so because of the small number of cases. Although no statistical significance was found, the trend of the CNR of HCC was to increase on post-contrast T2WI. This result was consistent with previous studies (410). In the case of metastases, no significant difference was seen in terms of lesion conspicuity. Moreover, the CNR of metastases was lower in post-contrast T2WI. Metastatic lesions are known to have larger extracellualar space, and can therefore take up more gadolium and remain enhanced on delayed images, thus improving lesion conspicuity on post-contrast images. We presume that the reason our results are not consistent with previous studies (91219), is because of our variable metastatic origins. In previous reports, most cases were hypervascular tumors. In our study, hypovascular tumors including cholangiocarcinoma were included, so the hypothesis requires further evaluation. Hemangiomas showed an increase in CNR for post-contrast T2TSE, which is consistent with previous studies (919). For a HASTE sequence; however, hemangiomas showed a decrease in the CNR for post-contrast images, presumably because of the time delay from the HASTE sequence after T2TSE.
The limitations of this study are, first, a small study population that made statistical significance occasionally difficult to achieve. Second, lesion sizes varied and small lesion sizes introduced error in the measurement of signal intensity. Third, since not all lesions were pathologically proven, we occasionally had to rely on follow-up CT, MRI, or serological studies to confirm a lesion.
In summary, no significant difference was detected between pre- and post-contrast T2WI in terms of image quality or lesion conspicuity, however a trend toward improved lesion conspicuity in post-contrast T2WI was observed. Although significantly more artifacts were seen with post-contrast T2TSE, this appeared to have minimal influence on daily clinical practice. No significant difference was noted for CNR, but the CNR of HCC on post-contrast T2WI showed a tendency to increase.
In conclusion, we expect that the post-contrast T2WI can replace the pre-contrast T2WI without introducing problems in the overall image analysis. Furthermore, this method could improve lesion conspicuity to some degree. To shorten the total scan time during Gd-EOB-DTPA enhanced MRI, we recommend replacing pre-contrast T2WI with post-contrast T2WI.
 XML Download