

 PDF
PDF ePub
ePub Citation
 Print
Print


INTRODUCTION
In 1999, ghrelin (GHRL) was identified as a peptide hormone secreted from stomach A-like cells and other tissues, and it was found that the effects of GHRL are mediated via growth hormone secretagogue receptors (GHSRs), which are located in the hypothalamus, heart, and adipose tissue [1]. GHRL was found to have an important direct role in energy homeostasis by affecting appetite and food intake [23] and indirectly by its influence on the actions of insulin, growth hormone, and probably other hormones. Thus, abnormalities of this peptide have pathological consequences that are reflected in type 2 diabetes mellitus (T2DM), adiposity, obesity, and body weight [23]. Additionally, GHRL was reported to be associated with hypertension [4]. A common clinical scenario for the above associations of GHRL is metabolic syndrome (MetS), in which the shared pathognomonic feature is insulin resistance (IR). However, GHRL has several other functions that were reviewed by Leite-Moreira and Soares in 2007 [5], including its role in cell proliferation and thus cancer risk. IR is a cardinal feature of T2DM and its associated metabolic abnormalities, the MetS, which together enhance cardiovascular morbidity, obesity, and mortality [67]. Although the exact mechanism of IR has yet to be confirmed, several risk factors have been identified, including GHRL deficiency.
The preproghrelin (GHRL) gene is located on the short arm of chromosome 3 (3q25-26) and is transcribed into messenger RNA with four exons and five introns, encoding 117 amino acids, which are processed to give the 28-amino-acid molecule GHRL [18]. The active form is produced by addition of an octanoyl group (C7H15CO) to the third amino acid residue (serine). However, alternative promoters and alternative splicing of GHRL result in five transcript variants, some of which encode different protein isoforms; some do not encode any protein, but may regulate GHRL-obestatin preproprotein expression. Meanwhile, GHSRs, which are typical G protein-coupled receptors with seven transmembrane domains [9], are products of two transcriptional variants of the GHSR gene, on the short arm of chromosome 3 (3q25). The GHSR type 1a gene (GHSR), when an intron is excised, encodes the cognate receptor of GHRL [1]. The full-length receptor (type 1a) contains 366 amino acids encoded by two exons. The other transcriptional variant, type 1b, retains the intron; however, it may not function as a GHRL receptor.
An association of low plasma GHRL levels with T2DM and IR was recently demonstrated among Saudi subjects [10]. Similar findings have been observed in other studies from different regions [111213]. Furthermore, few studies have investigated the relationship of GHRL and GHSR polymorphisms with plasma GHRL levels. Of those studies, several have reported associations of the Leu72Met (rs696217 TG) polymorphism with T2DM, IR, and other disorders [1415161718]. Thus, in this study, the aim was to examine the associations of Leu72Met and three other intronic GHRL single-nucleotide polymorphisms (SNPs) (rs27647 CT, rs2075356 CT, and rs4684677 AT) and one GHSR SNP (rs509030) with GHRL levels, T2DM, and IR among Saudi subjects. Knowledge of ethnic variations in the distribution and significance of the GHRL/GHSR SNPs will add to our knowledge about GHRL in general.
METHODS
Study subjects
This study was carried out in the Eastern Region of the Kingdom of Saudi Arabia, King Abdulaziz Hospital and primary health centers of the National Guard Health Affairs in Al-Ahsa Governorate. The 208 study subjects were aged between 18 and 75 years, and 107 subjects (61 males and 46 females) were known to have T2DM. The T2DM diagnosis was based on the 1998 World Health Organization diagnostic and classification criteria [19]. The patients were being followed up as outpatients. The other study subjects were 101 (57 males and 44 females) non-diabetic and apparently healthy individuals. Acute and chronic severe illnesses, pregnancy, and lactation were exclusion criteria.
Study design and sample collection
This was an observational cross-sectional study that received ethical approval from the research committees of two different institutions: the Arabian Gulf University and King Abdullah International Research Center, Riyadh, Kingdom of Saudi Arabia. After the aim of the study was explained, all patients and control subjects signed an informed consent form. Blood samples were drawn from all donors in the morning, after 10 to 12 hours of overnight fasting, into three tubes: (1) a gel/dry plain tube for the lipid profile; (2) a whole blood in ethylenediaminetetraacetic acid tube for hemoglobin A1c (HbA1c) and GHRL analysis, with the buffy coat retained for DNA extraction; and (3) a fluoride tube from which plasma was used to determine fasting glucose and insulin levels. Serum, plasma, and buffy coat samples were stored at −40℃ pending analysis.
Blood chemistry
Blood glucose analysis
Fasting blood glucose levels were estimated using an auto-analyzer, the Architect c8000 (Abbott Laboratories Inc., Abbott Park, IL, USA). HbA1c was estimated by measuring glycated hemoglobin using a G8 analyzer (TOSOH, Tessenderlo, Belgium).
Plasma insulin
Plasma insulin was quantitatively assayed using a chemiluminescence procedure with an auto-analyzer, the Architect i2000 (Abbott Laboratories Inc.). IR was calculated using the homeostasis model assessment 2 (HOMA-IR) [20].
Blood GHRL measurement
The active form of plasma GHRL was measured by a radioimmunoassay (Millipore Research, St Charles, MO, USA). Briefly, on day 1, 100 µL of standards or plasma samples or controls and guinea pig GHRL antiserum were added to polystyrene tubes and incubated at 4℃ for 20 to 24 hours. On day 2, 100 µL of 125I-GHRL tracer was added and incubated at 4℃ for a further 20 to 24 hours. On day 3, 1 mL of cold precipitating reagent was added to each tube and incubated for 20 minutes at 4℃. After centrifugation at 2,000 to 3,000 rpm for 20 minutes at 4℃, radioactivity in the pellet was counted using a γ counter. The plasma GHRL levels (pmol/L) were then determined by the interpolation of the reference curve drawn using standard concentrations of GHRL. This method can achieve a sensitivity of 7.8 pg/mL using 100 µL plasma samples. This assay recognized only the active form of human GHRL [21] and showed no significant cross-reactivity with, or interference from, other factors related to GHRL (des-octanoyl GHRL <0.1%) or motilin-related peptide [4].
Analysis of polymorphisms in the GHRL and GHSR genes
DNA extraction
Total genomic DNA was extracted from the leukocyte-rich buffy coat layer, using the Illustra protocol, limited DNA Mini Kit, according to the manufacturer's specifications (GE Healthcare UK Limited, Amersham Place, UK).
Selection of the GHRL and GHSR SNPs
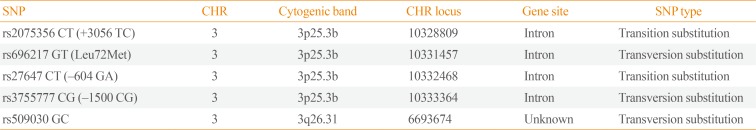
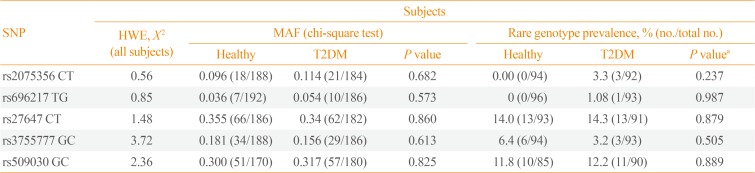
The GHRL SNPs rs696217 TG (Leu72Met), rs27647 CT, rs2075356 CT (+3056), and rs3755777 GC (−1500) and the GHSR SNP rs509030 GC (Table 1) were selected by searching through the ABI HapMap (Applied Biosystems Inc., Foster City, CA, USA) data available via the SNP browser. The primer sequences for each SNP can be found at: http://www.ncbi.nlm.nih.gov/SNP/snp_ref.cgi?. All SNPs were in Hardy-Weinberg equilibrium (Table 2).
Real-time polymerase chain reaction analysis
GHRL/GHSR genotyping was done by real-time polymerase chain reaction (PCR), using the Applied Biosystems StepOne PCR System (Applied Biosystems Inc.). The assay is based on the detection of fluorescent signals generated proportionally during each PCR cycle. The genotyping was carried out in two steps: cycling (PCR amplification), followed by the endpoint detection of fluorescent signals. Allelic discrimination was achieved by selective annealing using TaqMan MGB probes (Applied Biosystems Inc.). Results were interpreted as homozygotes or heterozygotes [22].
Statistical analysis
The SigmaStat software version 3.5 (Systat Software Inc., San Jose, CA USA) was used for analysis. Comparisons were executed using the t test and one-way analysis of variance when the data were normally distributed; otherwise, the Mann-Whitney rank sum test and Kruskal-Wallis one-way analysis of variance on ranks were used. Rates and proportions were compared using the chi-square test. P values <0.05 were considered to indicate statistical significance.
Hardy-Weinberg equilibrium values were calculated using an online calculator, OEGE (Online Encyclopedia for Genetic Epidemiology studies, http://www.oege.org/software/hwe-mr-calc.shtml), for the examined SNPs (the cut-off point for the probability of a population being in Hardy-Weinberg equilibrium was a chi-square value ≥3.841). The linkage equilibrium calculations and the identification of the haplotypes were done using the Haploview 4.2 program (Broad Institute, Cambridge, MA, USA).
RESULTS
The frequency of GHRL and GHSR polymorphisms in T2DM patients and non-diabetic subjects
Alleles and genotypes
As shown in Table 2, the minor allele frequency (MAF) of the examined GHRL (rs696217, rs2075356, rs27647, and rs-3755777) and GHSR (rs509030) intronic SNPs were not significantly different between subjects with and without T2DM (P=0.682, P=0.573, P=0.860, P=0.613, and P=0.825, respectively). Similarly, the distributions of the genotypes of the five examined SNPs were comparable between the study groups (P=0.237, P=0.987, P=0.879, P=0.505, and P=0.889, respectively).
Haplotypes
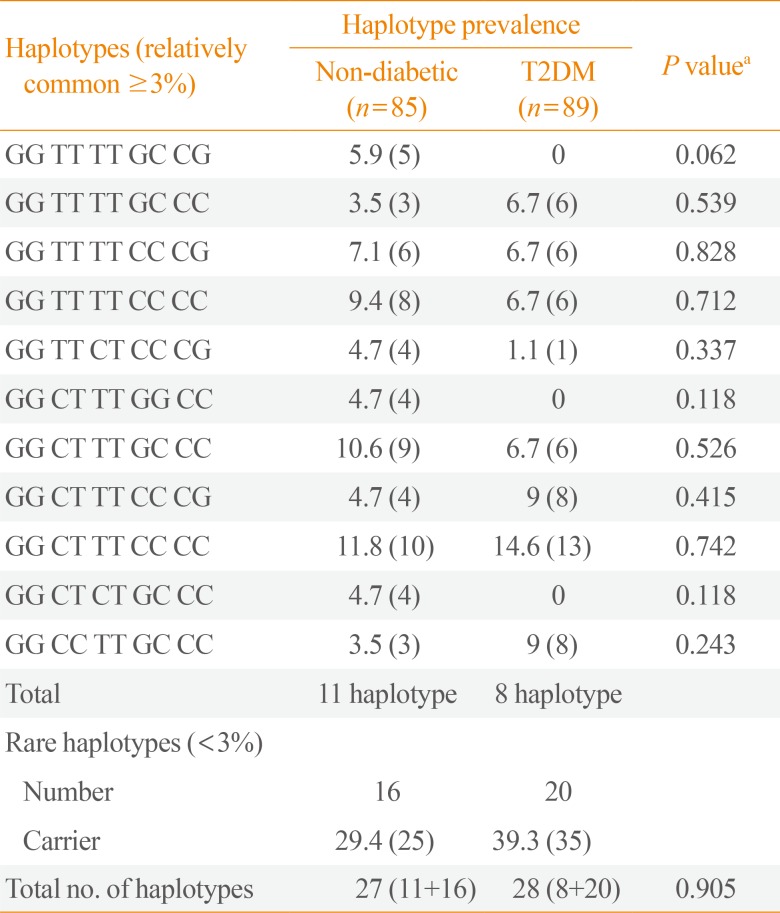
A total of 38 haplotypes were identified; 17 were found in both study groups, 10 were found only in the non-diabetic group, and 11 were found only in T2DM subjects. However, the proportions of the unique haplotypes were too small (each <3%) to be included in the comparisons. In contrast, the prevalence rates of the relatively more common haplotypes (≥3% in at least one study group) were compared between the two study groups and were found to be quite similar (Table 3).
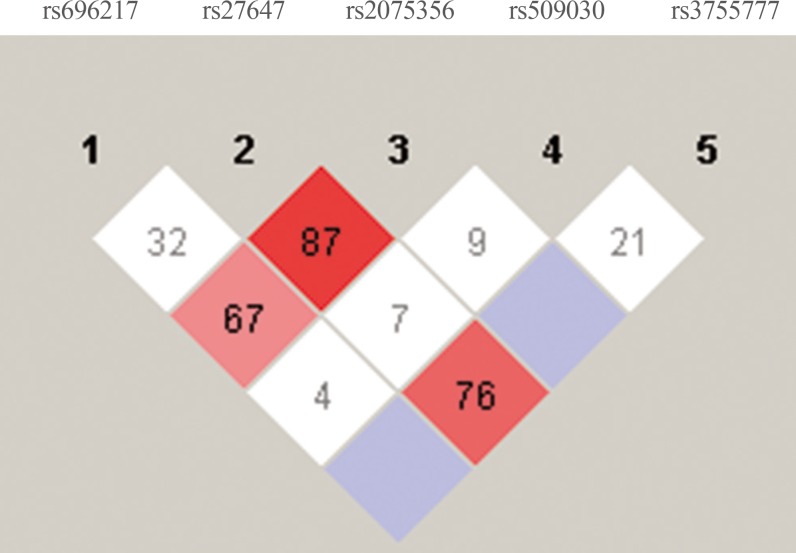
Linkage disequilibrium between the study SNPs
As shown in Fig. 1, there was a strong linkage between rs27647 and rs2075356 (D′=87), and between rs27647 and rs3755777 (D′=76). There was also a linkage between rs696217 and rs2075356 (D′=67). Indeed, the smallest D′ values were those of rs509030 with the other SNPs, since this SNP is found in a different locus on chromosome 3 (3q25).
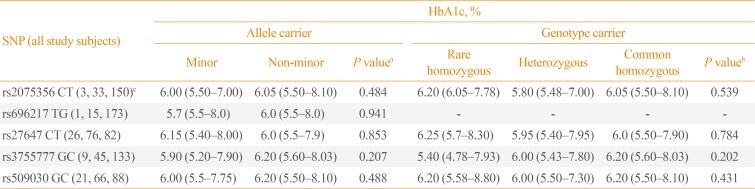
Associations of the GHRL and GHSR SNPs with HbA1c
For testing the associations of the GHRL and GHSR SNPs with HbA1c levels (as a countable marker of long-term blood glucose levels), all study subjects, regardless of whether they had T2DM, were analyzed together (Table 4). Among all study subjects, the HbA1c level was not significantly different between the carriers and non-carriers of the minor alleles of any of the five examined GHRL (rs2075356, rs696217, rs27647, and rs3755777) and GHSR (rs509030) SNPs (P=0.484, P=0.941, P=0.853, P=0.207, and P=0.488, respectively). Moreover, the genotypes (rare [minor] and common homozygous, and heterozygous) of the carriers of these SNPs had comparable HbA1c levels (P=0.539, P=not valid, P=0.784, P=0.202, and P=0.430, respectively).
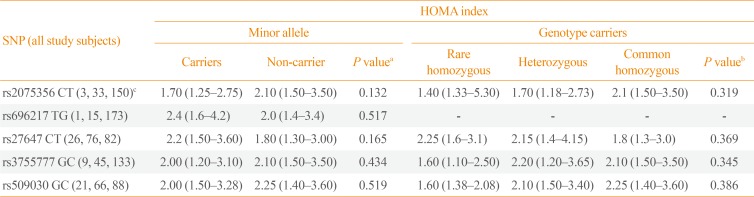
Associations of the GHRL and GHSR SNPs with IR (HOMA index)
In all study subjects, the HOMA index, as a countable marker of IR, was not significantly different between the carriers and non-carriers of minor alleles of the GHRL (rs2075356, rs696217, rs27647, and rs3755777) and GHSR (rs509030) SNPs (P=0.132, P=0.517, P=0.165, P=0.434, and P=0.519, respectively). Furthermore, the HOMA index was comparable between the carriers of the rare (minor) and common homozygous, and heterozygous genotypes of the same SNPs (P=0.319, P=not valid, P=0.369, P=0.345, and P=0.386, respectively) (Table 5).
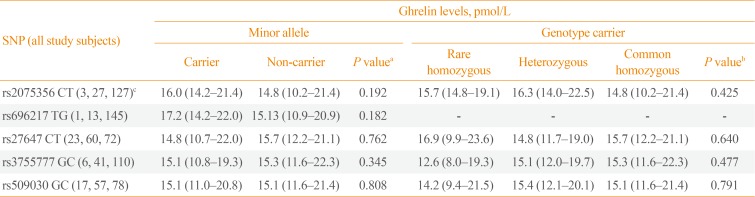
Associations of the GHRL and GHSR SNPs with plasma GHRL levels
In all study subjects, the plasma GHRL peptide levels (pmol/L) were not significantly different between the carriers and non-carriers of the minor alleles of the GHRL (rs2075356, rs696217, rs27647, and rs3755777) and GHSR (rs509030) SNPs (P=0.192, P=0.182, P=0.762, P=0.345, and P=0.808, respectively). Similarly, plasma GHRL levels were comparable between the GHRL and GHSR genotypes' carriers (rare and common homozygous, and heterozygous) of the tested SNPs (P=0.425, P=not valid, P=0.640, P=0.477, and P=0.971, respectively) (Table 6).
DISCUSSION
The exact mechanism of IR has not been precisely identified; however, clinical and laboratory correlates of IR have been reported [62324]. In a recent study, we demonstrated that IR and related markers were associated with low GHRL levels [10], as shown in other studies [4111213]. In this study, we found no associations between Leu72Met or other intronic GHRL/GHSR polymorphisms with T2DM, IR, or GHRL levels among Saudi subjects.
We examined four SNPs (rs696217 [Leu72Met], rs2075356, rs27647, and rs3755777) in the GHRL gene and one in the GHSR gene (rs509030). All these polymorphisms are intronic in location, although the location of the rs509030 SNP is not precisely known. The selected SNPs were analyzed in samples that were previously used to document the associations of plasma GHRL levels with T2DM and IR. One of the aims of this study was to investigate whether the reported influence of GHRL in this population was affected by intronic SNPs of the GHRL gene, namely Leu72Met, and whether these SNPs were predictive of plasma GHRL levels. In several studies in different populations, the Leu72Met polymorphism was shown to be associated with T2DM, IR, and/or plasma GHRL levels [1415161718]. In this study, none of the five SNPs was associated with these disorders or plasma GHRL.
Our findings are not unexpected, as there is no consensus that the examined SNPs are associated with T2DM or IR. The best example is Leu72Met, which has been thoroughly investigated before. The Leu72Met polymorphism was shown to be associated with T2DM [1415], IR [1617], and plasma GHRL levels [1618], and it was also found to be associated with diabetes-related disorders, such as MetS [1525], obesity [26], hypertension [14], and nephropathy [27]. Moreover, this SNP has been associated with diabetes-unrelated disorders, such as cancer [28], and bulimia nervosa purging type (BN-P) [29]. In contrast, several other studies showed that the Leu72Met polymorphism was not associated with T2DM [18303132], IR [14], or GHRL levels [433]. This SNP (Leu72Met) that has been widely tested across various nations had a MAF of only 0.04 in our study, which is more comparable to that found in Chinese (0.03) and notably different from the value found in Caucasians (0.25) and Japanese (0.20), as shown in the ABI HapMap data.
Another commonly examined GHRL SNP (rs27647) was not associated with T2DM, IR, or plasma GHRL levels in this study. However, in other studies, it was found to be associated with plasma GHRL levels [16], IR [1634], hypertension [1435], and cancer [36]. In contrast, another study showed no association between this SNP and IR [14]. The lack of any previously reported associations of this SNP (rs27647) with T2DM was either because it was not tested for T2DM or because it was tested, but did not show a significant association, and thus was not reported. The rs27647 MAF among our study population (0.35) was similar to that of Caucasians (0.34, HapMap), and extremely different from that observed in African (0.140) and Japanese (0.11) subjects.
The remaining two GHRL SNPs, rs2075356 and rs3755777, have been less commonly examined than the previous two; in this study, neither was found to be associated with T2DM, IR, or GHRL plasma levels. However, these two SNPs have been found to be associated with obesity [26]. Further, the rs2075356 polymorphism was also found to be associated with T2DM [14], BN-P [29], and cancer [37], while the rs3755777 polymorphism was not found to be associated with T2DM [38]. In this study, the MAFs of rs2075356 (0.10) and rs3755777 (0.17) were closer to the values observed among Caucasians (0.10 and 0.24, respectively), and notably different from the values observed among African-Americans (0.01 and 0.46, respectively) and Japanese (0.30 and 0.42, respectively).
In contrast, GHSR polymorphisms have been investigated less often. In this study, we tested the rs509030 GC polymorphism. This SNP has rarely been tested, and we found only one peer-reviewed published article on this SNP in PubMed [39]. In our study, the rs509030 GC polymorphism had the least amount of linkage with the other SNPs (Fig. 1), which might indicate that it is not located on chromosome 3. Furthermore, it was not associated with T2DM or IR, and it did not predict plasma GHRL levels. However, the rs509030 GC polymorphism was found to be associated with MetS and dyslipidemia [39]. Although the MAF of this SNP was 0.31, which is relatively high compared to the other tested SNPs in this study (Table 2), there were no MAF data available for this SNP online.
Of the 38 identified GHRL/GHSR haplotypes, the prevalence of 11 common haplotypes, as well as the remaining haplotypes, were comparable between the T2DM and non-T2DM subjects. A large number of haplotypes indicates the genetic diversity of the preproghrelin gene, although this diversity does not affect the structure or function of GHRL (comparable between study subjects) or the protein expression (plasma GHRL levels) of this gene. However, more polymorphisms need to be investigated and/or identified in order to explain the significant differences observed in GHRL levels between T2DM subjects with and without IR and non-diabetic subjects. Furthermore, none of the alleles/genotypes of the tested SNPs were associated with the most important measurable parameter of T2DM, HbA1c (Table 4), or with that of IR, the HOMA index (Table 5).
Finally, it remains necessary to find an explanation for the inconsistent associations between the GHRL/GHSR polymorphisms, especially the Leu72Met polymorphism, and T2DM and IR. A recent meta-analysis study of the Leu72Met polymorphism and T2DM used six case-control studies (a total of 3,417 cases and 3,081 controls), and demonstrated that no association was present between the Leu72Met polymorphism and T2DM in the overall population or in Asians. However, in subgroup analyses stratified by ethnicity, they found that the risk for T2DM was decreased in subjects with Met72+ genotypes in Caucasians [40]. Indeed, the differences between the studies' subjects, whether genetic (ethnicity), due to environmental factors, or even the way the study subjects were selected, could in part explain the controversies in the literature.
In conclusion, this study documented an important negative finding: the lack of an association of T2DM in Saudis with Leu72Met, the most investigated GHRL SNP, which was previously found to be associated with T2DM and IR in some populations but not the others. It also affirmed the role of ethnicity in the interpretation of SNP association studies, and investigated a rarely analyzed GHSR SNP, rs509030 GC; however, this SNP and other GHRL intronic SNPs (rs2075356, rs27647, and rs3755777) were likewise not associated with T2DM, IR, or plasma GHRL, while their haplotypes indicated great genetic variability. The limitations of this study include the small sample size and the limited number of tested SNPs. Thus, a further analysis of more GHRL-related SNPs with a larger sample size is needed to explain the difference in the plasma GHRL peptide levels seen in our study subjects.
 XML Download