Journal List > Endocrinol Metab > v.32(2) > 1086347

Kim, Dunville, Li, Cheng, Conley, Couture, and Campbell: Intermuscular Adipose Tissue Content and Intramyocellular Lipid Fatty Acid Saturation Are Associated with Glucose Homeostasis in Middle-Aged and Older Adults

Abstract

Background

Insulin resistance is associated with the higher content of intermuscular adipose tissue (IMAT) and the saturation of intramyocellular lipid (IMCL), but a paucity of data exist in humans. This study examined associations among IMAT content, IMCL saturation, and fasting glucose concentration in middle-aged and older adults with overweight or obesity.

Methods

Seventy-five subjects (26 males, 49 females) were recruited and thigh muscle and IMAT were assessed using magnetic resonance imaging. Vastus lateralis tissue was acquired from a subset of nine subjects and IMCL content and saturation were assessed using nonlinear dual complex microscopy.

Results

The characteristics of the 75 subjects were as follows: age 59±11 years, body mass index 30±5 kg/m2, fasting glucose concentration 5.2±0.5 mmol/L, fasting insulin concentration 12.2±7.3 µU/mL, fasting homeostatic model assessment of insulin resistance (HOMA-IR) 2.9±2.0 (mean±SD). IMAT to muscle tissue (MT) volume ratio was positively associated with the saturated fatty acid to unsaturated fatty acid ratio in IMCL. IMAT:MT was positively associated with fasting glucose concentration and HOMA-IR. IMCL saturation was positively associated with fasting glucose concentration while muscle cell area, IMCL area, and % IMCL in muscle cell were not associated with fasting glucose concentration.

Conclusion

These results indicate that higher intermuscular fat content and IMCL saturation may impact fasting glucose concentration in middle-aged and older adults with overweight or obesity. The centralization of adipose tissue in the appendicular region of the body may promote insulin resistance.

INTRODUCTION

Among adults, advancing age is generally associated with increased body mass and fat mass, along with reduced muscle mass and quality [1]. According to data from the National Health and Nutrition Examination Survey 2011 to 2012, the prevalence of overweight and obesity gradually increases with aging and the prevalence of overweight and obesity in United States adults who are 60 years old and older is approximately 71.6% [2]. Higher amounts of whole body and abdominal body fat in older adults contribute to an increased risk of insulin resistance and type 2 diabetes mellitus (T2DM) [3]. Research also supports that the accumulation of intermuscular adipose tissue (IMAT), an ectopic fat depot, and intramyocellular lipid (IMCL) negatively impacts insulin action and circulating glucose control [45]. Previous research demonstrated that obese subjects presented higher accumulation of lipid and higher saturated to unsaturated fatty acid (UFA) ratio in muscle cells and both may affect insulin mediated glucose uptake [6]. Insulin resistance is also predicted by the fatty acid composition of skeletal muscle membranes, with insulin resistance associated with higher saturated fatty acid (SFA) content in skeletal muscle membranes [78]. The degree of fatty acid saturation is considered as a contributing factor of insulin resistance by inhibiting insulin signaling pathway [9]. Collectively, this provocative observation implicating the fatty acid composition of skeletal muscle membranes in insulin resistance broadly suggests that the fatty acid profile of other muscle-related fat depots, including IMCL, may also impact glucose control.
Novel imaging techniques were recently applied to characterize muscle cells and tissues [1011] and in particular, Coherent Anti-Stokes Raman scattering (CARS) microscopy can visualize lipid droplets within muscle cells [1213] without applying additional labeling [1415]. Also, CARS microscopy and spontaneous Raman spectroscopy are inherently complementary to each other and a compound Raman microscope was used to investigate the level of fatty acid saturation in 3T3-L1 adipocytes [16]. For the current research, we have applied this technique to examine the level of fatty acid saturation of IMCL in human muscle cells.
The aim of this study was to examine associations among IMAT, IMCL saturation, and fasting serum glucose concentration in middle-aged and older adults with overweight or obesity. We hypothesized that (1) IMAT volume would be positively associated with IMCL saturation and (2) both higher IMAT volume and IMCL saturation would be positively associated with fasting serum glucose concentration.

METHODS

Subjects and experimental design

The current study used baseline data from 75 subjects who participated in one of three separate clinical studies (Supplemental Table S1). Healthy males and females were recruited from the greater Lafayette, IN, USA area and common inclusion criteria among the three studies were as follows: age 35 to 80 years; body mass index (BMI) between 25 to 38 kg/m2; weight stable within the past 3 to 6 months; not following a special exercise program within the past 3 to 6 months; non-smoking; no acute illness; and not clinically diagnosed with diabetes mellitus. Among the 75 subjects, skeletal muscle tissue (MT) was collected from 36 subjects and used for analyses pertaining to objectives of the original studies. Aliquots of muscle were available from nine subjects to measure IMCL content and saturation for the current study. The Purdue University Institutional Review Board approved the study protocols and all subjects provided written, informed consent and received monetary compensation for their participation. Clinical trial profiles of the three parent studies can be found under NCT01396915, NCT01692860, and NCT02187965.

Anthropometric measurement

Subjects' height (±0.1 cm) and weight (±0.1 kg) were measured using a wall-mounted stadiometer and a digital balance scale, respectively. These measurements were used to calculate BMI (kg/m2).

Blood collection and serum glucose and insulin analyses

Subjects arrived at the Purdue clinical research center following a 10-hour overnight period of fasting and bloods were collected into serum separator tubes from an antecubital vein. The tubes were held at room temperature for 30 minutes and centrifuged at 4,000 ×g at 4℃ for 15 minutes. Serum tubes were sent to MidAmerica Clinical Laboratories (Indianapolis, IN, USA) and glucose concentration was measured using a photometric assay (Chemistry Immuno Analyzer AU5700, Olympus, Center Valley, PA, USA). Serum insulin concentration was measured in duplicate by an electrochemiluminescence immunoassay method on the Elecsys 2010 analyzer (Roche Diagnostic Systems, Indianapolis, IN, USA). The homeostatic model assessment of insulin resistance (HOMA-IR) was calculated as previously described [17].

Magnetic resonance imaging and image analyses

Overnight fasted subjects arrived at a magnetic resonance imaging (MRI) facility (InnerVision West, West Lafayette, IN, USA) and were scanned using a 3.0T Signa HDx whole body MRI machine (General Electric, Waukesha, WI, USA). Prior to scanning, subjects were instructed to lie in the supine position on a MRI-safe bed for 1 hour to minimize effects of body position on the scanning outcomes [18]. Following the period of rest, subjects were shifted to the MRI machine bed while remaining in the supine position and images of the dominant leg were captured by the MRI device. Previous MRI-based research indicates that the reliable estimates of the volume of muscle are possible with eight image slides [19] and the volumes of calf IMAT and muscle from nine image slides [20]. In the current study, 27 image slices were obtained and they were analyzed using Medical Image Processing, Analysis, and Visualization (MIPAV) MRI analysis software version 7.0 (Center for Information Technology, National Institutes of Health, Bethesda, MD, USA) beginning with the first slice after the appearance of the rectus femoris, proceeding with every third slice, and ending with the appearance of the gluteus maximus. Total tissue (TT), MT, subcutaneous adipose tissue (SAT), and IMAT regions were identified and respective volumes and areas were calculated. MIPAV software is equipped with calculus-based computing abilities and generated volumes from outlined tissue areas. Each slice chosen for analysis represented three slices in total: itself, the slice previous, and the slice following; IMAT volume and MT volume were summated and multiplied by three to compensate for the extrapolation. MIPAV software only provides areas of TT and SAT, therefore areas of TT and SAT were multiplied by 8 to account for volumetric conversion [19] and were summated and multiplied by 3 to calculate TT volume and SAT volume. Adipose tissue (AT) volume was the sum of IMAT and SAT volumes. IMAT volume was standardized to the MT volume and this ratio (IMAT volume:MT volume) was our primary proxy for IMAT accumulation.

Skeletal muscle collection

Skeletal MT was acquired from the middle of the vastus lateralis via a percutaneous pump needle technique as described previously [21]. Collected MTs were encapsulated, frozen in liquid nitrogen, and saved in −80℃ until analysis.

Cellular imaging preparation

Collected skeletal MTs were analyzed using a microscope to determine muscle fiber orientation, with fiber striation orthogonal to the line of sight for optimal orientation. A cryoslicer cassette containing the muscle sample was filled with optimum cutting temperature (OCT, Tissue Tek, Sakura, Torrance, CA, USA) compound and was submersed in isopentane at −80℃ to solidify. Each frozen OCT-imbedded muscle sample was prepared via cryostat (CM1850, Leica Microsystems, Wetzlar, Germany) set at −20℃, removed from the cassette mold and mounted erect on a cutting platform. A sample slice was observed under microscope to ensure cross-sectional orientation and un-ruptured muscle cells. Fifteen, 30 µm-thick, cross-sectional slices were attained and mounted onto microscope slides (Superfrost, Fisher Scientific, Thermo Fisher Scientific, Waltham, MA, USA) for imaging.

Coherent anti-stokes Raman scattering microscopy and spontaneous Raman spectroscopy

Skeletal MTs were imaged via dual-complex, non-linear optic microscopy (FV300, Olympus). CARS microscopy visualized myocytes and IMCL by tuning the laser beating frequency to 2,850 cm-1, to be in resonance with the CH2 symmetric stretch vibration [1213]. One CARS image of one muscle cell was obtained for each of the nine subjects biopsied and images were acquired by Fluoview (Olympus). From the image, individual IMCL droplets could be magnified and cursor-selected, directing laser at a target lipid droplet for spontaneous Raman spectroscopy analysis. Raman spectra were taken using only pump laser at 707 nm as the excitation source, whereas the stokes beam was blocked. The peak at 1,654 cm-1 (C=C stretching vibration peak) was used to indicate the number of C=C bonds in lipids and the peak at 1,445 cm-1 (CH2 deformation peak) was used to indicate the number of CH2 group in lipids. The ratio of SFA to UFA was indicated by height ratio of the peak at 1,445 cm-1 to the peak at 1,654 cm-1 [16]. This process was repeated for five separate lipid droplets per muscle sample.
MIPAV software was used for analyzing CARS images; a single muscle cell was outlined, its area was calculated, and muscle cell was subtracted from IMCL allowing isolation and calculation of IMCL area. IMCL distribution was calculated by dividing IMCL area by muscle cell area and multiplied by 100 resulting in a percent composition of IMCL for each muscle sample.
OriginPro 8.6 software (OriginLab Corp., Northampton, MA, USA) was utilized to process spontaneous Raman spectra. First, background interference was subtracted from 60 separate Raman spectra in order to standardize UFA and SFA peak heights, which were subsequently measured. To assess the saturation profile of IMCL, SFA peak height was divided by UFA peak height (SFA:UFA). The coefficient of variations for inter-measurement and intra-measurement were 8.2%±1.3% and 8.3%±2.2% (mean±standard deviation [SD]), respectively.

Statistical analyses

An independent samples t test was used to compare differences in general characteristics including age, BMI, fasting serum glucose and insulin concentrations, thigh muscle and fat composition, and MT composition between male and female subjects. A multiple linear regression model was used to assess the association between (1) IMAT and IMCL saturation, (2) IMAT and fasting serum glucose and insulin concentrations and HOMA-IR, and (3) IMCL saturation and fasting serum glucose concentration. All estimates were adjusted for age and sex. The association between IMAT and fasting serum glucose and insulin concentrations were assessed using data from 75 and 65 subjects, respectively. Insulin data were not available for 10 subjects from one clinical study. Five out of nine skeletal MTs were also collected from this study, so associations between IMCL saturation and fasting serum insulin concentration and HOMA-IR were not assessed. All analyses were performed using SAS 9.2 (SAS Institute Inc., Cary, NC, USA). Data are presented as mean±SD and statistical significance was accepted at P<0.05.

RESULTS

The characteristics of the 75 subjects (26 male and 49 female) were as follows: age 59±11 years, BMI 30±5 kg/m2, fasting serum glucose concentration 5.2±0.5 mmol/L, fasting serum insulin concentration 12.2±7.3 µU/mL, fasting HOMA-IR 2.9±2.0 (mean±SD). There were no differences in age, BMI, fasting serum insulin concentration, and HOMA-IR between the male and female subjects, but the males presented higher fasting serum glucose concentration than females (5.6±0.4 mmol/L vs. 5.1 ± 0.5 mmol/L, P<0.05).
The characteristics of the nine subjects (six male and three female) who had biopsies were as follows: age 69±4 years, BMI 27±4 kg/m2, and fasting serum glucose concentration 5.6±0.6 mmol/L. There were no differences in age and BMI between the male and female subjects, but the males presented higher fasting serum glucose concentration than females (5.8±0.5 mmol/L vs. 5.1±0.3 mmol/L, P<0.05).

Thigh muscle and fat composition

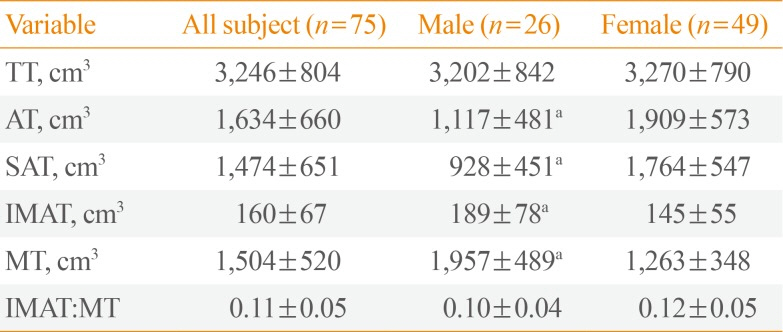
There was no difference in TT volume between the males and females (Table 1), but the males had higher volume of IMAT and MT and lower volume of SAT and AT than the females. The IMAT:MT ratio was not different between the males and females.

Vastus lateralis lipid and fatty acid saturation

Among the subset of nine subjects who had biopsies, muscle cell area was greater in the males compared to the females but no differences were observed in IMCL area, % IMCL in muscle cell, and SFA to UFA ratio (SFA:UFA) between the males and females (Table 2).

Associations between thigh IMAT accumulation and vastus lateralis IMCL saturation

There was a positive association between IMAT:MT and SFA:UFA (β-coefficient, 1.54; 95% confidence interval, 0.01 to 3.07; P=0.049).

Associations between thigh IMAT accumulation and fasting serum glucose and insulin concentrations and HOMA-IR

Fasting serum glucose concentration and HOMA-IR were positively associated with IMAT:MT, but fasting serum insulin concentration was not associated with IMAT:MT (Table 3).

Associations between vastus lateralis lipid and fatty acid saturation and fasting serum glucose concentration

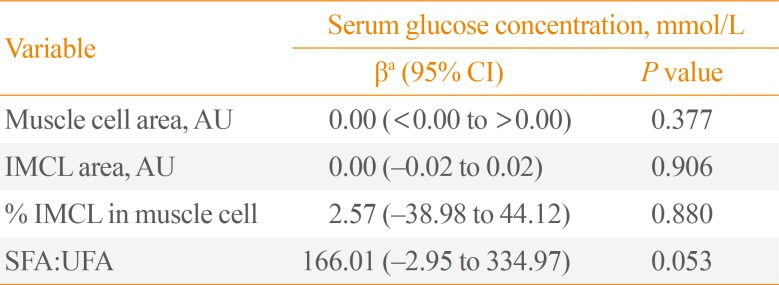
Among the subset of nine subjects who had biopsies, fasting serum glucose concentration was positively associated with SFA:UFA (P=0.053), but not associated with muscle cell area, IMCL area, and % IMCL in muscle cell (Table 4).

DISCUSSION

Unfavorable body composition changes including decreased muscle mass and increased fat mass, particularly in ectopic organs including skeletal muscle are associated with impaired glucose metabolism and insulin resistance [222324]. IMAT, a small fat compartment that surrounds muscle fiber bundles, may induce local inflammation by producing proinflammatory cytokines, impair blood flow, and increase the concentrations of fatty acids in muscle, resulting in impaired glucose control and insulin resistance [525]. Our findings in middle-aged and older adults with overweight or obesity that intermuscular fat accumulation (represented by higher IMAT:MT) is related to higher fasting serum glucose concentration and HOMA-IR are consistent with research in middle-aged men and women [2627], men and women with obesity and T2DM [5], and healthy elderly men [28] showing that higher IMAT content may contribute to worsening glucose homeostasis and insulin resistance. In particular, IMAT:MT was suggested as an indicator of muscle quality [20] and research established an inverse relationship between calf IMAT:MT and muscle performance and physical function in older adults with obesity and diabetes mellitus [20]. Collectively, higher IMAT content may worsen glucose homeostasis and contribute to reduced muscle performance and physical function in middle-aged and older adults with overweight or obesity.
Observations at the cellular level in skeletal muscle suggest that excess IMCL accumulation [47] and an increased SFA content in IMCL [6] relate to insulin resistance. This occurs, in part due to the production of lipotoxic intermediates, including ceramides and diacylglycerols, that inhibit the insulin signaling pathway [42930]. Research in cells [31] and animals [32] support that increased SFA contents in IMCL is associated with increased ceramide and diacylglycerol production. Two cross-sectional human studies also assessed FA composition of IMCL using gas-liquid chromatography in 30 adults with normal-weight status or obesity and 59 adults with obesity, respectively [633] and observed positive correlations between higher SFA contents in IMCL with higher fasting glucose concentration and insulin resistance. Consistent with previous findings, we observed a positive relationship between IMCL saturation and fasting serum glucose concentration and this was assessed by a novel and useful imaging method which does not require sample preparation of ectopic fat deposition and cellular organelles compared to other methods [14].
It is well known that insulin resistance is promoted by the accumulation of visceral AT more so than SAT [34], thus many studies have focused on the abdomen and abdominal viscera [353637]. However, there is evidence that the thigh fat compartment is also associated with insulin resistance. In adults with obesity and T2DM, insulin resistance was associated with higher IMAT accumulation in the thigh but not with SAT accumulation [5]. We also observed that IMCL saturation was positively associated with IMAT:MT but not associated with SAT:MT (data not shown), which indicates that fat compartments of the thigh may have distinct impacts on IMCL saturation. More research is warranted to investigate the underlying mechanism regarding the IMAT versus SAT accumulations on IMCL saturation.
The differences in quantity and distribution of thigh fat and muscle between males and females is well known and our observations also show that the females have higher SAT and AT in the thigh than males while the males have higher MT and muscle cell area. IMAT in the thigh was higher in the males than females, consistent with other research [26]. Sex differences in the degree of unsaturation within IMCL in healthy young subjects may be due to differences in lipoprotein metabolism, the stimulatory effects of estrogen and the inhibitory effects of androgens [38]. Despite these differences, no differences in IMAT:MT and SFA to UFA ratio were observed between males and females in this study. The lack of sex-specific differences in these ratios in these middle-aged and older adults might relate to reduced concentrations of androgens and estrogens in the males and females, respectively, hormones that influence body fat deposition [39]. The apparent lack of differences in these ratios between sexes provides a scientific rationale to combine data from the males and females for the examination of the associations of IMAT content and IMCL saturation on wholebody glucose homeostasis.
The current study uniquely assessed associations between muscle composition both at the tissue and cellular levels using independent measurements, MRI and a compound Raman microscope, respectively and whole-body glucose homeostasis. Particularly, these IMCL results are the first to be published from human skeletal muscle samples using a compound Raman microscope method. Although compound Raman microscope method was applied to multiple cell cultures and animal studies related to lipid biology [40], its usage with human muscle is novel. Additional research is needed to validate the use of this spectroscopy approach against gas-liquid chromatography, which is a well accepted technique quantifying fatty acids in IMCL from human skeletal muscle. It is important to note that the associations between IMAT content and IMCL saturation with fasting serum glucose concentration must not be interpreted as a cause and effect relationship due to the cross-sectional nature of this study. Also, we recognize that the ability to assess the impact of vastus lateralis IMCL content and saturation on glucose concentration is limited by the small sample size. Lastly, we are limited to observe the associations between muscle composition and fasting serum glucose concentration instead of using more precise assessment of glucose intolerance and insulin resistance or inflammatory markers, which may increase with higher content of IMAT [25].
In conclusion, our findings support that fat content in thigh skeletal muscle is associated with fasting glucose and HOMA-IR in middle-aged and older adults with overweight or obesity. Association between higher IMAT content and IMCL saturation in this study indicate that the centralization of AT in the appendicular region of the body may promote insulin resistance. Lastly, this study supports the possible utility of using a compound Raman microscope to investigate the IMCL saturation from human muscle samples.

ACKNOWLEDGMENTS

This study was funded through American Egg Board-Egg Nutrition Center; National Dairy Council, NIH UL1TR001108; Purdue Ingestive Behavior Research Center.

Notes

CONFLICTS OF INTEREST: Wayne W. Campbell served on the National Dairy Council Whey Protein Advisory Panel at the time this study was accomplished.

References

1. Trombetti A, Reid KF, Hars M, Herrmann FR, Pasha E, Phillips EM, et al. Age-associated declines in muscle mass, strength, power, and physical performance: impact on fear of falling and quality of life. Osteoporos Int. 2016; 27:463–471. PMID: 26194491.
crossref
2. Ogden CL, Carroll MD, Kit BK, Flegal KM. Prevalence of childhood and adult obesity in the United States, 2011-2012. JAMA. 2014; 311:806–814. PMID: 24570244.
crossref
3. Bjorntorp P. Abdominal obesity and the development of noninsulin-dependent diabetes mellitus. Diabetes Metab Rev. 1988; 4:615–622. PMID: 3065014.
4. Coen PM, Goodpaster BH. Role of intramyocelluar lipids in human health. Trends Endocrinol Metab. 2012; 23:391–398. PMID: 22721584.
crossref
5. Goodpaster BH, Thaete FL, Kelley DE. Thigh adipose tissue distribution is associated with insulin resistance in obesity and in type 2 diabetes mellitus. Am J Clin Nutr. 2000; 71:885–892. PMID: 10731493.
crossref
6. Manco M, Mingrone G, Greco AV, Capristo E, Gniuli D, De Gaetano A, et al. Insulin resistance directly correlates with increased saturated fatty acids in skeletal muscle triglycerides. Metabolism. 2000; 49:220–224. PMID: 10690948.
crossref
7. Pan DA, Lillioja S, Milner MR, Kriketos AD, Baur LA, Bogardus C, et al. Skeletal muscle membrane lipid composition is related to adiposity and insulin action. J Clin Invest. 1995; 96:2802–2808. PMID: 8675650.
crossref
8. Vessby B, Tengblad S, Lithell H. Insulin sensitivity is related to the fatty acid composition of serum lipids and skeletal muscle phospholipids in 70-year-old men. Diabetologia. 1994; 37:1044–1050. PMID: 7851683.
crossref
9. Li Y, Xu S, Zhang X, Yi Z, Cichello S. Skeletal intramyocellular lipid metabolism and insulin resistance. Biophys Rep. 2015; 1:90–98. PMID: 26942223.
crossref
10. Pfeffer CP, Olsen BR, Ganikhanov F, Legare F. Imaging skeletal muscle using second harmonic generation and coherent anti-stokes Raman scattering microscopy. Biomed Opt Express. 2011; 2:1366–1376. PMID: 21559148.
crossref
11. Brackmann C, Esguerra M, Olausson D, Delbro D, Krettek A, Gatenholm P, et al. Coherent anti-stokes Raman scattering microscopy of human smooth muscle cells in bioengineered tissue scaffolds. J Biomed Opt. 2011; 16:021115. PMID: 21361678.
crossref
12. Day JP, Rago G, Domke KF, Velikov KP, Bonn M. Label-free imaging of lipophilic bioactive molecules during lipid digestion by multiplex coherent anti-stokes Raman scattering microspectroscopy. J Am Chem Soc. 2010; 132:8433–8439. PMID: 20507119.
crossref
13. Hellerer T, Axang C, Brackmann C, Hillertz P, Pilon M, Enejder A. Monitoring of lipid storage in Caenorhabditis elegans using coherent anti-stokes Raman scattering (CARS) microscopy. Proc Natl Acad Sci U S A. 2007; 104:14658–14663. PMID: 17804796.
crossref
14. Billecke N, Rago G, Bosma M, Eijkel G, Gemmink A, Leproux P, et al. Chemical imaging of lipid droplets in muscle tissues using hyperspectral coherent Raman microscopy. Histochem Cell Biol. 2014; 141:263–273. PMID: 24186059.
crossref
15. Evans CL, Xie XS. Coherent anti-stokes Raman scattering microscopy: chemical imaging for biology and medicine. Annu Rev Anal Chem (Palo Alto Calif). 2008; 1:883–909. PMID: 20636101.
crossref
16. Slipchenko MN, Le TT, Chen H, Cheng JX. High-speed vibrational imaging and spectral analysis of lipid bodies by compound Raman microscopy. J Phys Chem B. 2009; 113:7681–7686. PMID: 19422201.
crossref
17. Matthews DR, Hosker JP, Rudenski AS, Naylor BA, Treacher DF, Turner RC. Homeostasis model assessment: insulin resistance and beta-cell function from fasting plasma glucose and insulin concentrations in man. Diabetologia. 1985; 28:412–419. PMID: 3899825.
18. Berg HE, Tedner B, Tesch PA. Changes in lower limb muscle cross-sectional area and tissue fluid volume after transition from standing to supine. Acta Physiol Scand. 1993; 148:379–385. PMID: 8213193.
crossref
19. Lund H, Christensen L, Savnik A, Boesen J, Danneskiold-Samsoe B, Bliddal H. Volume estimation of extensor muscles of the lower leg based on MR imaging. Eur Radiol. 2002; 12:2982–2987. PMID: 12439580.
crossref
20. Tuttle LJ, Sinacore DR, Mueller MJ. Intermuscular adipose tissue is muscle specific and associated with poor functional performance. J Aging Res. 2012; 2012:172957. PMID: 22666591.
crossref
21. Thalacker-Mercer AE, Fleet JC, Craig BA, Campbell WW. The skeletal muscle transcript profile reflects accommodative responses to inadequate protein intake in younger and older males. J Nutr Biochem. 2010; 21:1076–1082. PMID: 20149619.
crossref
22. Johannsen DL, Conley KE, Bajpeyi S, Punyanitya M, Gallagher D, Zhang Z, et al. Ectopic lipid accumulation and reduced glucose tolerance in elderly adults are accompanied by altered skeletal muscle mitochondrial activity. J Clin Endocrinol Metab. 2012; 97:242–250. PMID: 22049170.
crossref
23. Karakelides H, Irving BA, Short KR, O'Brien P, Nair KS. Age, obesity, and sex effects on insulin sensitivity and skeletal muscle mitochondrial function. Diabetes. 2010; 59:89–97. PMID: 19833885.
crossref
24. Kuk JL, Saunders TJ, Davidson LE, Ross R. Age-related changes in total and regional fat distribution. Ageing Res Rev. 2009; 8:339–348. PMID: 19576300.
crossref
25. Addison O, Marcus RL, Lastayo PC, Ryan AS. Intermuscular fat: a review of the consequences and causes. Int J Endocrinol. 2014; 2014:309570. PMID: 24527032.
crossref
26. Boettcher M, Machann J, Stefan N, Thamer C, Haring HU, Claussen CD, et al. Intermuscular adipose tissue (IMAT): association with other adipose tissue compartments and insulin sensitivity. J Magn Reson Imaging. 2009; 29:1340–1345. PMID: 19422021.
crossref
27. Yim JE, Heshka S, Albu J, Heymsfield S, Kuznia P, Harris T, et al. Intermuscular adipose tissue rivals visceral adipose tissue in independent associations with cardiovascular risk. Int J Obes (Lond). 2007; 31:1400–1405. PMID: 17452994.
crossref
28. Zoico E, Rossi A, Di Francesco V, Sepe A, Olioso D, Pizzini F, et al. Adipose tissue infiltration in skeletal muscle of healthy elderly men: relationships with body composition, insulin resistance, and inflammation at the systemic and tissue level. J Gerontol A Biol Sci Med Sci. 2010; 65:295–299. PMID: 19864639.
crossref
29. Straczkowski M, Kowalska I, Baranowski M, Nikolajuk A, Otziomek E, Zabielski P, et al. Increased skeletal muscle ceramide level in men at risk of developing type 2 diabetes. Diabetologia. 2007; 50:2366–2373. PMID: 17724577.
crossref
30. Itani SI, Ruderman NB, Schmieder F, Boden G. Lipid-induced insulin resistance in human muscle is associated with changes in diacylglycerol, protein kinase C, and IkappaB-alpha. Diabetes. 2002; 51:2005–2011. PMID: 12086926.
31. Pickersgill L, Litherland GJ, Greenberg AS, Walker M, Yeaman SJ. Key role for ceramides in mediating insulin resistance in human muscle cells. J Biol Chem. 2007; 282:12583–12589. PMID: 17337731.
crossref
32. Lee JS, Pinnamaneni SK, Eo SJ, Cho IH, Pyo JH, Kim CK, et al. Saturated, but not n-6 polyunsaturated, fatty acids induce insulin resistance: role of intramuscular accumulation of lipid metabolites. J Appl Physiol (1985). 2006; 100:1467–1474. PMID: 16357064.
crossref
33. Haugaard SB, Madsbad S, Mu H, Vaag A. Desaturation of excess intramyocellular triacylglycerol in obesity: implications for glycemic control. Int J Obes (Lond). 2010; 34:500–510. PMID: 20029372.
crossref
34. Ibrahim MM. Subcutaneous and visceral adipose tissue: structural and functional differences. Obes Rev. 2010; 11:11–18. PMID: 19656312.
crossref
35. Preis SR, Massaro JM, Robins SJ, Hoffmann U, Vasan RS, Irlbeck T, et al. Abdominal subcutaneous and visceral adipose tissue and insulin resistance in the Framingham heart study. Obesity (Silver Spring). 2010; 18:2191–2198. PMID: 20339361.
crossref
36. Hayashi T, Boyko EJ, McNeely MJ, Leonetti DL, Kahn SE, Fujimoto WY. Visceral adiposity, not abdominal subcutaneous fat area, is associated with an increase in future insulin resistance in Japanese Americans. Diabetes. 2008; 57:1269–1275. PMID: 18299316.
crossref
37. Wagenknecht LE, Langefeld CD, Scherzinger AL, Norris JM, Haffner SM, Saad MF, et al. Insulin sensitivity, insulin secretion, and abdominal fat: the Insulin Resistance Atherosclerosis Study (IRAS) Family Study. Diabetes. 2003; 52:2490–2496. PMID: 14514631.
38. Velan SS, Said N, Narasimhan K, Papan C, Bahu A, Vargo JA, et al. Gender differences in musculoskeletal lipid metabolism as assessed by localized two-dimensional correlation spectroscopy. Magn Reson Insights. 2008; 2008:1–6. PMID: 25371653.
crossref
39. Horstman AM, Dillon EL, Urban RJ, Sheffield-Moore M. The role of androgens and estrogens on healthy aging and longevity. J Gerontol A Biol Sci Med Sci. 2012; 67:1140–1152. PMID: 22451474.
crossref
40. Le TT, Yue S, Cheng JX. Shedding new light on lipid biology with coherent anti-stokes Raman scattering microscopy. J Lipid Res. 2010; 51:3091–3102. PMID: 20713649.
crossref

SUPPLEMENTARY MATERIAL

Supplemental Table S1

Inclusion Criteria of Each Study
enm-32-257-s001.pdf
Table 1

Thigh Fat and Muscle Compositions

enm-32-257-i001
Variable All subject (n = 75) Male (n = 26) Female (n = 49)
TT, cm3 3,246±804 3,202±842 3,270±790
AT, cm3 1,634±660 1,117±481a 1,909±573
SAT, cm3 1,474±651 928±451a 1,764±547
IMAT, cm3 160±67 189±78a 145±55
MT, cm3 1,504±520 1,957±489a 1,263±348
IMAT:MT 0.11±0.05 0.10±0.04 0.12±0.05

Values are expressed as mean±SD.

TT, total tissue; AT, adipose tissue; SAT, subcutaneous adipose tissue; IMAT, intermuscular adipose tissue; MT, muscle tissue.

aDifferences between males and females (P<0.05).

Table 2

Vastus Lateralis Lipid and Fatty Acid Saturation

enm-32-257-i002
Variable All subject (n=9) Male (n=6) Female (n=3)
Muscle cell area, AU 1.7×10⁻⁵±0.4×10⁻⁵ 1.9×10⁻⁵±0.2×10⁻⁵a 1.3×10⁻⁵±0.3×10⁻⁵
IMCL area, AU 438.3±402.4 408.6±337.0 497.7±596.6
% IMCL in muscle cell 0.25±0.23 0.22±0.19 0.32±0.33
SFA:UFA 0.73±0.04 0.74±0.04 0.69±0.03

Values are expressed as mean±SD.

AU, arbitrary unit; IMCL, intramyocellular lipid; SFA, saturated fatty acid; UFA, unsaturated fatty acid.

aDifferences between males and females (P<0.05).

Table 3

Association between Thigh Fat Composition and Serum Glucose and Insulin Concentrations and HOMA-IR

enm-32-257-i003
Variable Serum glucose concentration, mmol/L Serum insulin concentration, µU/mL HOMA-IR
βa (95% CI) P value βa (95% CI) P value βa (95% CI) P value
IMAT:MT 49.7 (7.3 to 92.1) 0.022 41.2 (–2.1 to 84.5) 0.062 11.3 (0.2 to 22.4) 0.047

All estimates are adjusted for age and sex.

HOMA-IR, homeostatic model assessment of insulin resistance; CI, confidence interval; IMAT, intermuscular adipose tissue; MT, muscle tissue.

aEstimates of adjusted regression coefficient between fasting serum glucose and insulin concentrations and HOMA-IR with thigh muscle and fat composition (n=75).

Table 4

Association between Vastus Lateralis Lipid and Fatty Acid Saturation and Serum Glucose Concentration

enm-32-257-i004
Variable Serum glucose concentration, mmol/L
βa (95% CI) P value
Muscle cell area, AU 0.00 (<0.00 to >0.00) 0.377
IMCL area, AU 0.00 (−0.02 to 0.02) 0.906
% IMCL in muscle cell 2.57 (−38.98 to 44.12) 0.880
SFA:UFA 166.01 (−2.95 to 334.97) 0.053

All estimates are adjusted for age and sex.

CI, confidence interval; AU, arbitrary unit; IMCL, intramyocellular lipid; SFA, saturated fatty acid; UFA, unsaturated fatty acid.

aEstimates of adjusted regression coefficient between fasting serum glucose concentration with vastus lateralis lipid and fatty acid saturation (n=9).

TOOLS
Similar articles