Journal List > Endocrinol Metab > v.32(2) > 1086344

Al Qarni, Joatar, Das, Awad, Eltayeb, Al-Zubair, Ali, Al Masaud, Shire, Gumaa, and Giha: Association of Plasma Ghrelin Levels with Insulin Resistance in Type 2 Diabetes Mellitus among Saudi Subjects

Abstract

Background

Although the exact mechanism of insulin resistance (IR) has not yet been established, IR is the hallmark characteristic of type 2 diabetes mellitus (T2DM). The aim of this study was to examine the relationship between plasma ghrelin levels and IR in Saudi subjects with T2DM.

Methods

Patients with T2DM (n=107, cases) and non-diabetic apparently healthy subjects (n=101, controls) from Saudi Arabia were included in this study. The biochemical profiles and plasma insulin levels of all subjects were analyzed, and IR was estimated using the homeostatic model assessment of insulin resistance (HOMA-IR) index. Active ghrelin levels in plasma were measured using the radioimmunoassay technique.

Results

Only 46.7% (50 of 107) of the T2DM subjects had IR, including 26% (28 of 107) with severe IR (HOMA-IR ≥5), while 5.9% (six of 101) of the controls had moderate IR (3 ≤HOMA-IR <5). HOMA-IR values were not associated with age, disease duration, or gender. Importantly, T2DM itself and the co-occurrence of IR with T2DM were significantly associated with low plasma ghrelin levels. However, ghrelin levels were inversely correlated with the HOMA-IR index, body weight, and fasting plasma insulin levels, mainly in the control subjects, which was indicative of the breakdown of metabolic homeostasis in T2DM.

Conclusion

The prevalence of IR was relatively low, and IR may be inversely associated with plasma ghrelin levels among Saudi patients with T2DM.

INTRODUCTION

The pathogenesis of type 2 diabetes mellitus (T2DM) is known to involve abnormalities in insulin action (insulin resistance [IR]) and insulin secretion (β-cell dysfunction) [1], as well as the overproduction of glucose by the liver. In contrast to β-cell dysfunction, IR is marked by elevated blood glucose in the presence of normal or elevated insulin levels. In T2DM, IR occurs earlier during the disease course, most likely in the pre-diabetes stage before the full-blown disease develops [2], whereas the failure of pancreatic β-cells develops later, with a consequent decline in insulin secretion [3]. An important manifestation of IR is metabolic syndrome, which is characterized by obesity and enhanced cardiovascular morbidity and mortality [45].
The exact mechanism of IR is not certain, but several hypotheses have been proposed. Defects in insulin receptors, signal transduction, and the glucose transport effector system are likely to contribute to IR [6]. Further down the pathway, mitochondrial defects, largely attributed to the accumulation of reactive oxygen species, have been suggested as an important factor in IR [7]. Additionally, a weight of evidence suggests that elevated intramuscular triglyceride content almost certainly contributes to the development of IR in muscles [8]. Similarly, an association between elevated plasma free fatty acid concentrations and IR has been documented [9]. Additionally, the associations of IR with the secretion of leptin, adiponectin, and other cytokines and chemokines by adipocytes have been thoroughly investigated and confirmed [101112]. Moreover, some gut hormones, such as ghrelin, glucagon-like peptide 1, peptide YY, and cholecystokinin, have also been found to regulate satiety and energy intake and to affect energy expenditure and lipid metabolism; thus, implicating them in IR [13]. In particular, the association of ghrelin with IR is an interesting outcome deserving further investigation in a range of populations.
Ghrelin is a peptide hormone with growth hormone-releasing activity secreted from stomach A-like cells [14]. It is a novel endogenous ligand for growth hormone secretagogue receptor (GHS-R) [14]. GHS-R type 1a gene encodes the cognate receptor of ghrelin; its full-length sequence contains 366 amino acids encoded by two exons on chromosome 3q25 [14]. Ghrelin has been reported to have a positive influence on glucose metabolism and insulin sensitivity [151617]. Ghrelin exerts profound orexigenic and adipogenic effects that increase food intake and body weight, thus playing a pleiotropic role in the modulation of energy balance [1819]. Total plasma ghrelin has been found to be low in obese individuals and high in lean individuals [17]. Ghrelin receptors have been identified in the hypothalamus, heart, and adipose tissue.
In patients with T2DM, IR is quantitatively estimated using different formulas incorporating a range of variables [20]. The hyperinsulinemic euglycemic clamp is considered the gold standard for investigating and quantifying IR [21]. However, additional methods have recently been developed, including the homeostatic model assessment of insulin resistance (HOMA-IR) and the quantitative insulin sensitivity check index (QUICKI) [22]. Other studies have suggested that fasting serum insulin levels probably mirror image the clamp in estimation of IR [23].
In this study, we aimed to estimate the prevalence and risk factors of IR in T2DM among Saudi patients with diabetes, which has not been done before, and to investigate the possible relationship of ghrelin with IR in patients with T2DM.

METHODS

Study subjects

Subjects with T2DM and healthy non-diabetic controls were recruited randomly from diabetes clinics at King Abdulaziz Hospital and from primary health centers of the National Guard Health Affairs in Al-Ahsa Governorate, in the Eastern Region of the Kingdom of Saudi Arabia (Table 1). The study subjects were Saudis aged between 18 and 75 years. A total of 107 subjects with T2DM (61 males and 46 females) were recruited and followed up as outpatients. The major inclusion criterion was being a Saudi subject with T2DM. Patients were mostly treated with the oral hypoglycemic agents metformin and glicazide, individually, together, or with insulin. Four patients were on insulin only, two patients were controlled by diet alone, and four subjects were newly diagnosed. In total, 37.4% (40 of 107) of the diabetic subjects were using insulin. We also recruited 101 non-diabetic healthy subjects (57 males and 44 females). Acute and severe chronic illnesses, pregnancy, and lactation were used as exclusion criteria. No subject had been treated surgically for obesity.

Study design and sample collection

This observational study was approved by the research committees of two different institutions (the Arabian Gulf University in Bahrain and the King Abdullah International Research Center in Saudi Arabia). All subjects signed an informed consent form after the aim of the study was explained. Blood samples were drawn from all subjects in the morning, after 10 to 12 hours of fasting. The blood was collected in three tubes: a gel/dry plain tube for the lipid profile and C-peptide levels, whole blood in an ethylenediaminetetraacetic acid tube for hemoglobin A1c (HbA1c) and ghrelin analysis, and plasma in a fluoride tube for fasting glucose and insulin determination. Samples were stored at −40℃ during the period of the study and beyond.

Blood chemistry

Blood glucose analysis

The fasting blood glucose (FBG) level estimation was performed using an auto-analyzer (Architect c8000, Abbott Laboratories Inc., Abbott Park, IL, USA) that employed the glucose-hexokinase method. HbA1c was estimated by measuring glycated hemoglobin using a G8 analyzer (Tosoh Bioscience, Tessenderlo, Belgium), which used high-performance liquid chromatography.

Plasma insulin

Plasma insulin was quantitatively assayed using chemiluminescence with an auto-analyzer (Architect i2000, Abbott Laboratories Inc.). The ideal method for the practical estimation of IR, among the several proposed methods, remains to be established, as each procedure has its advantages and disadvantages. In this study, IR was calculated using the HOMA-IR method [24], in which HOMA-IR=[fasting glucose (mmol/L)×fasting insulin (mIU/L)]/22.5. A HOMA-IR index between 3 and 5 was defined as moderate IR, while a HOMA-IR index >5 was considered to indicate severe IR.

Plasma ghrelin measurements

Active ghrelin in plasma samples was measured with a commercially available radioimmunoassay (RIA) kit by the double antibody/polyethylene glycol technique (Millipore Research, St. Charles, MO, USA). In this RIA kit, an antibody specific to the active form of ghrelin with an octanoyl group on serine 3 was used. Briefly, on day 1, guinea pig ghrelin antiserum add to three polystyrene tubes each contain 100 µL aliquots of one of the following: standard solution, plasma samples or control solution, and incubated at 4℃ for 20 to 24 hours. On day 2, 100 µL of 125I-ghrelin tracer was added and incubated at 4℃ for a further 20 to 24 hours. On day 3, 1 mL of cold precipitating reagent was added to each tube and incubated for 20 minutes at 4℃. After centrifugation at 2,000 to 3,000 rpm for 20 minutes at 4℃, radioactivity in the pellet was counted using a γ counter. Plasma ghrelin levels were then determined from a reference curve drawn using standard concentrations of ghrelin. The assay recognized only the active form of human ghrelin [2526], and showed no significant cross-reactivity with or interference by other factors related to ghrelin [27].

Statistical analysis

Sigma Stat software (Systat Software, San Jose, CA, USA) and MedCalc statistical software (MedCalc Software bvba, Ostend, Belgium) were used for data analysis. For comparisons of the two study groups, the t test was used; otherwise, the Mann-Whitney rank sum test (MW) was used when data were not normally distributed (when the normality test failed). Kruskal-Wallis one-way analysis of variance on ranks was used for comparisons of more than two groups. For all correlation analyses, the Pearson product moment correlation test and multiple regression analysis were used. Analysis of covariance was used to adjust for confounding factors (covariates), such as body mass index (BMI) and age. The Levene test for equality of error variances and homogeneity of regression slopes were always negative (P>0.05).

Ethical approval

All procedures performed in studies involving human participants were conducted in accordance with the ethical standards of the relevant institutional and national research committees and with the 1964 Helsinki Declaration and its later amendments.

RESULTS

IR as determined by HOMA-IR

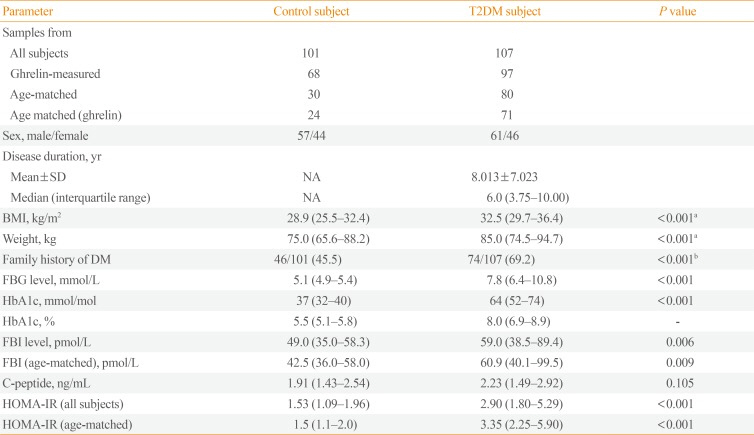
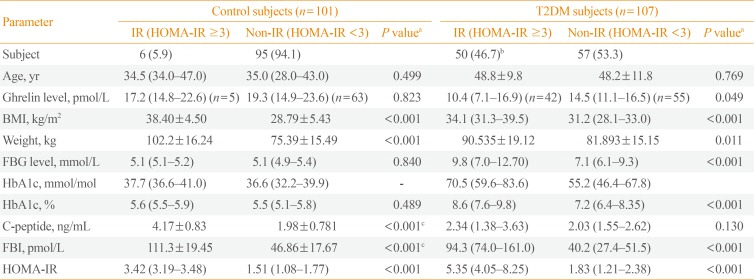
As shown in Table 2, the HOMA-IR index was significantly higher in T2DM subjects than in non-diabetic subjects (P<0.001). When comparisons were limited to age-matched T2DM patients (n=80) and healthy controls (n=30), the HOMA-IR index was still significantly higher in the T2DM patients (P<0.001) (Table 1). The frequency of IR in the T2DM subjects was 46.7% (50 of 107), including 26.2% (28 of 107) with severe IR. In contrast, the frequency of IR among the control subjects was 5.9% (six of 101), all of whom had moderate IR. The difference in the prevalence of IR between the two groups was highly significant (P<0.001) (Table 2).

Associations of ghrelin levels with T2DM and IR

As shown in Fig. 1A, patients with T2DM (n=97) were found to have significantly lower median levels of plasma ghrelin (14.24 pmol/L; interquartile range [IQR], 9.42 to 16.68), compared to the apparently healthy controls (n=68) (19.28 pmol/L; IQR, 14.83 to 23.44; P<0.001, MW). Limiting the analysis to age-matched T2DM subjects (n=71) and control subjects (n=24), the former still had significantly lower median plasma ghrelin levels (14.5 pmol/L; IQR, 9.6 to 16.3) than the latter (20.0 pmol/L; IQR, 14.8 to 27.8; P<0.001, MW) (Fig. 1B). Furthermore, after adjusting for the confounding factors of BMI and age, the association of T2DM with lower ghrelin levels than were found in control subjects remained significant ([estimated marginal mean, 14.1 pmol/L; 95% confidence interval (CI), 12.5 to 15.6] vs. [20.9 pmol/L; 95% CI, 19.0 to 22.8], P<0.001; Bonferroni-corrected analysis of covariance).
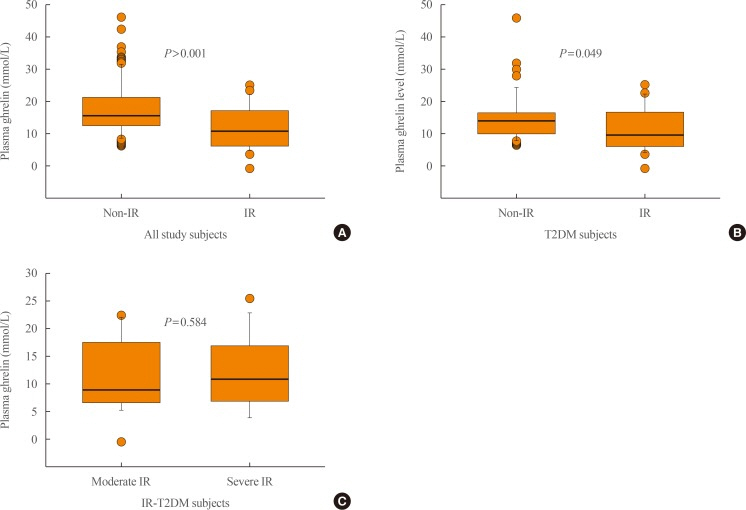
Furthermore, the median fasting blood insulin (FBI) level was significantly higher in T2DM subjects than in control subjects (P=0.006). Limiting the analysis to age-matched T2DM and control subjects, the level was still higher in the former group (P=0.009) (Table 1). For all subjects, the median ghrelin level was significantly lower in those with IR (11.6 pmol/L; IQR, 7.9 to 17.1) than those without IR (16.2 pmol/L; IQR, 13.6 to 21.4; P<0.001, MW) (Fig. 2). Limiting the comparison to subjects with T2DM, the median ghrelin level was still significantly higher in subjects with T2DM without IR (14.5 pmol/L; IQR, 11.1 to 16.5) than in those with T2DM with IR (10.4 pmol/L; IQR, 7.1 to 16.9; P=0.049, MW). After adjusting for the covariates of BMI and age, the differences in the estimated marginal means of ghrelin between the T2DM subjects with IR (12.4 pmol/L; 95% CI, 10.3 to 14.5) and T2DM subjects without IR (15.3 pmol/L; 95% CI, 13.5 to 17.2) remained significant (P=0.049, Bonferroni-corrected analysis of covariance). However, ghrelin median levels were comparable between T2DM subjects with moderate IR (9.3 pmol/L; IQR, 7.1 to 16.3) and severe IR (11.1 pmol/L; IQR, 8.0 to 16.9; P=0.584, MW). Although the non-IR control subjects (n=63) had higher levels of ghrelin (19.28 pmol/L; IQR, 14.91 to 23.58) than the control subjects with moderate IR (17.21 pmol/L; IQR, 14.83 to 22.62), the difference was not significant (P=0.823, MW) (data not shown); however, the number of the control subjects with moderate IR was too small (n=5) for these findings to be meaningful.

Correlates and associations of IR

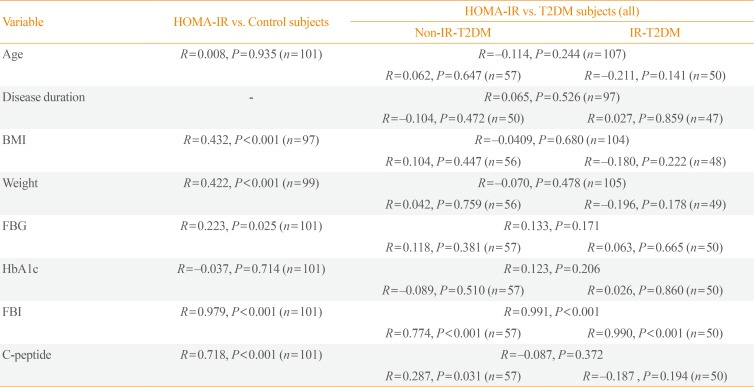
For all correlations, we used the Pearson product moment correlation test. The HOMA-IR index was not correlated with age in the control subjects (P=0.935) or among subjects with T2DM, whether analyzed as a single group (P=0.244), or split into non-IR (P=0.647), and IR (P=0.141) groups (Table 3). Additionally, the HOMA-IR index was not associated with sex (males vs. females: [median, 2.15; IQR, 1.50 to 3.60] vs. [median, 1.85; IQR, 1.20 to 3.40], P=0.344, MW). Furthermore, there was no significant difference in age between T2DM patients with IR and without IR (P=0.769, MW). Additionally, no significant age differences were found between the control subjects with or without IR (P=0.499, MW) (Table 2). Furthermore, the median HOMA-IR score was comparable between diabetic males (3.2; IQR, 2.1 to 5.9) and females (3.1; IQR, 2.1 to 5.2; P=0.644; MW). Finally, the HOMA-IR index was not correlated with the duration of T2DM, among all subjects analyzed as a whole (P=0.526), or separately analyzed among non-IR (P=0.472) and IR (P=0.859) T2DM patients (Table 3). The mean duration±standard deviation of disease was 8.01±7.02 years (Table 1).

Comparisons among controls, T2DM with and without IR

As shown in Table 2, FBG was significantly higher in T2DM patients with IR than in T2DM patients without IR (P<0.001), and no significant difference was found between control subjects with and without IR (P=0.840). A similar pattern was seen for HbA1c, which was significantly higher in patients with T2DM and IR than in T2DM patients without IR (P<0.001). Additionally, FBI levels were significantly higher in T2DM patients with IR than among those without IR (P<0.001), and a similar pattern was seen in non-diabetic healthy subjects. In contrast, C-peptide levels were not significantly different between IR and non-IR T2DM subjects, but among healthy subjects, they were higher in those with IR (P<0.001).

Correlations of HOMA-IR with glycemic indices

For all correlations, we used the Pearson product moment correlation test. As seen in Table 3, the HOMA-IR index was positively correlated with FBG in the control subjects (R=0.223, P=0.025), but not in T2DM subjects taken together (P=0.171), or divided into patients with IR (P=0.665) or without IR (P=0.381). Additionally, there was no significant correlation between the HOMA-IR index and HbA1c in the control subjects (P=0.714) or in subjects with T2DM (P=0.206). However, the HOMA-IR index was strongly significantly correlated with FBI in control subjects (R=0.979, P<0.001) and in T2DM subjects, whether analyzed as a whole (R=0.991, P<0.001) or split into IR (R=0.990, P<0.001) and non-IR (R=0.774, P<0.001) subjects. Finally, the HOMA-IR index was significantly correlated with C-peptide levels in control subjects (R=0.718, P<0.001) and in non-IR T2DM subjects (R=0.287, P=0.031), but not in T2DM subjects with IR (P=0.194). No correlation was found between FBI and C-peptide levels in all subjects (R=−0.101, P=0.300) (data not shown).

Correlations of ghrelin levels

For all correlations, we used the Pearson product moment correlation test, unless otherwise stated. As shown in Table 4, ghrelin levels were significantly inversely correlated with the HOMA-IR index in control subjects (R=−0.303, P=0.012), a borderline significant correlation was found in T2DM subjects (R=−0.195, P=0.055), but no significant correlation was found in the T2DM subjects with IR group (P=0.154). Ghrelin levels were not correlated with age or BMI in any group or subgroup, and were not correlated with duration of the disease in subjects with T2DM. Multiple regression analysis revealed an inverse correlation of plasma ghrelin with the HOMA-IR index (P=0.009) and BMI (P=0.033), but not age (P=0.087) in all study subjects (cases and controls) analyzed as a whole. However, in T2DM subjects, the only inverse correlation of plasma ghrelin was with HOMA-IR index (P=0.047). FBI was significantly inversely correlated with ghrelin levels in controls (R= −0.312, P=0.010), but not in T2DM subjects overall (P=0.059) or in the T2DM subjects with IR subgroup (P=0.168). Moreover, no correlations were found between ghrelin levels and other parameters (FBG, HbA1c, and C-peptide levels) in any study group or subgroup (Table 4).

DISCUSSION

The rate of IR in individuals with T2DM in Saudi Arabia is largely unknown, and the topic has not been researched because T2DM is thought to indicate IR by definition. In this study, we showed that only 47% of the T2DM subjects with IR, while the prevalence of IR among non-diabetic healthy subjects was 6% (Table 2). The exact mechanism of IR has not been precisely established, although it's clinical and laboratory correlates, such as metabolic syndrome, obesity, dyslipidemia, and hyperinsulinemia, have been identified [4728]. In the present study, we examined the possible association between ghrelin and IR in T2DM among subjects from eastern Saudi Arabia. The results revealed that low plasma ghrelin levels were associated with T2DM and IR (Figs. 1, 2), and ghrelin levels were correlated with IR markers such as body weight, FBI, and the HOMA-IR index in healthy controls (Table 4).
Subjects with T2DM were found to have lower active ghrelin levels than healthy subjects after correction for age differences between the study groups, even though the sample size was small (Fig. 1). A similar association of low levels of ghrelin with T2DM was reported among Finnish participants in the Oulu Project Elucidating Risk of Atherosclerosis study [27]. Importantly, in the present study, we showed that fasting ghrelin levels were significantly lower in T2DM subjects with IR than in T2DM subjects without IR; this difference remained significant when all IR subjects (T2DM and controls) were compared with non-IR subjects (Fig. 2). Among the T2DM patients, no significant difference was found in ghrelin levels between subjects with moderate and severe IR. Furthermore, we noted an inverse correlation between ghrelin levels and the HOMA-IR index (a measurable marker of IR) in healthy subjects, and an inverse correlation that fell just below the level of significance in T2DM subjects (Table 4). These findings agree with those of previous studies [2729]. In the current study, we also found that plasma ghrelin levels were inversely correlated with obesity, as shown by body weight (Table 4), as reported before [1830]. However, obesity is a clinical manifestation of IR, and is known to be associated with lower levels of insulin receptors in adipose tissue [31]. This is probably because high ghrelin levels decrease total body fat, and consequently increase the expression of insulin receptors in adipose tissue. In line with this hypothesis, using the same data, we found that triacylglycerides were the only lipids that were significantly different between T2DM patients with and without IR (manuscript in preparation). The lipogenic effect of ghrelin has been established [30], and an association of low ghrelin levels with metabolic syndrome and obesity has been reported before among Finnish subjects [32].
Anthropometric parameters (BMI and weight) and glycemic parameters (FBG, HbA1c, and FBI) were all significantly higher in the T2DM subjects with IR than in those without IR in this study (Table 2). The same parameters, except for FBG and HbA1c, were higher in control subjects with IR than in those without IR, although the number of the former group was too small for these observations to be meaningful. These findings are expected, and might indicate a reduced role of insulin in the control of metabolism in T2DM. Furthermore, significant correlations of most of these parameters with the degree of IR (HOMA-IR) were more common in the healthy subjects than in the T2DM subjects (Table 3), indicating disproportional metabolic responses to insulin, which are more marked in T2DM, supporting the findings of a previous study [4]. Negative correlations of the above parameters with ghrelin levels were observed, most significantly in the healthy subjects and to a lesser extent in T2DM subjects overall, but not in the T2DM subjects with IR subgroup (Table 4). If we exclude the smaller size of the T2DM subjects with IR subcategory as a contributory factor to the low chance of significant correlations among various parameters and HOMA-IR and ghrelin levels, a marked disturbance in homeostasis mechanisms could be the explanation. Metabolic disturbances in T2DM and IR have been previously reported [43334]. The finding that ghrelin is expressed in pancreatic islets and released into the pancreatic microcirculation, where it suppresses insulin secretion [35], can partially explain its role in T2DM, but not its contribution to IR.
It has been suggested that screening for T2DM should begin at 45 years of age and should be repeated every 3 years, and that it should begin sooner and be more frequent in those with risk factors [36]; however, it is worth including a parallel screening for IR. The latter is an important piece of information, as it can be used to trace IR milestones and the progress of the disease with increased age and disease duration. Furthermore, the management of T2DM with and without IR should be different. Interestingly, in the present study, the likelihood of IR in T2DM was not influenced by age or gender, since subjects who had T2DM with or without IR were comparable in age and had a similar gender distribution. Furthermore, the duration of diabetes had no influence on IR prevalence. If an individual with T2DM does not exhibit IR during the early course of the disease, he or she is unlikely to develop IR later, which emphasizes the role of genetic factors in IR [37].
The precise numerical HOMA-IR cutoff point for IR varies according to gender, age, race, and health status [38]. In various studies in different populations, the HOMA-IR index cutoff value for IR varied from 1.55 to 3.8 [38]. In our clinical and biochemical data, a HOMA-IR score of 3 was found to be the most discriminative between T2DM (highest IR) and non-diabetic apparently healthy controls (lowest IR). In the present study, using a HOMA-IR value of 3 as a cutoff point for IR, we showed that only 47% of T2DM cases exhibited IR (Table 2), although IR is a characteristic feature of T2DM [36]. However, if we reduced the HOMA-IR cutoff value for IR to 1.55, as proposed elsewhere [38], the frequency of IR in T2DM subjects would have increased approximately 2-fold (from 47% to 81.3% [87 of 107]), while in apparently healthy subjects it would have increased almost 8-fold (from 6% to 47% [48 of 101]) (data not shown). That indicates that a HOMA-IR value of 1.55 is unlikely to be a reliable cutoff point for IR in this setting. The prevalence of IR in T2DM in Caucasians (77%), Asians of Indian origin (81%), and Afro-Caribbeans (73%) [39] is considerably higher than was observed in the Arabs in this study. The role of IR in the progression from normal to impaired glucose tolerance, and then to frank diabetes, has been emphasized before [40]. However, two issues need to be considered here. First, these observations were reported from populations with different genetic makeups than Saudis. Second, the role of medications in the modification of insulin action should not be overlooked in our study, as the observations in the other studies were made in newly diagnosed T2DM subjects in a prospective manner.
In this study, HbA1c was significantly higher in T2DM subjects with IR than in those without IR, but HbA1c was not correlated with HOMA-IR or ghrelin in healthy or diabetic subjects. However, a larger sample size needs to be tested.
Finally, few studies have investigated C-peptide levels in relation to IR. The C-peptide level is expected to parallel the level of endogenous insulin, as the two peptides are secreted in equimolar concentrations in humans [41]. In our study, 37.4% of T2DM subjects used exogenous insulin. This may explain the lack of correlation of C-peptide levels with fasting insulin (data not shown), HOMA-IR (Table 3), and ghrelin (Table 4) in T2DM and T2DM subjects with IR, and the fact that the levels were comparable in T2DM subjects with and without IR (Table 2). Interestingly, C-peptide levels were significantly higher in apparently healthy subjects with IR than in those without IR, although the sample size of the former subgroup was small (Table 2). Still, it remains necessary to explain the lack of a correlation between C-peptide levels and ghrelin levels in the healthy subjects of this study (Table 4), and the lack of differences between the healthy and T2DM subjects in this regard (Table 1). Ultimately, we must acknowledge the limitations of this study; namely, the small overall sample size, the inadequately matched samples, and the ill-defined HOMA-IR cutoff value for the determination of IR.
In conclusion, this study revealed that low plasma active ghrelin levels were more likely to be associated with IR in T2DM patients, and that ghrelin levels showed a significant inverse correlation with the HOMA-IR index in healthy subjects, but not in T2DM patients with IR, among Saudi subjects. Furthermore, the degree of IR was not correlated with age, the duration of the disease, or gender. In addition, plasma ghrelin levels were comparable between T2DM subjects with moderate and severe IR. Nevertheless, low ghrelin levels were generally observed in T2DM subjects and in healthy subjects with IR in this study. Finally, we showed that the prevalence of IR in T2DM subjects was lower in this Saudi population compared with other populations.

ACKNOWLEDGMENTS

We would like to thank all the healthy volunteers and patients who agreed to participate in the present study. We express our sincere thanks to all physicians from the National Guard Health Affairs, the Primary Health Care Department, and the staff of the Biochemistry Department of King Abdulaziz National Guard Hospital, Al-Ahsa, Kingdom of Saudi Arabia, who helped in data collection and biochemical analysis. We extend our acknowledgements to Mrs. Lamees J Habieb and Mr. Abdullah J Hassan at the Salmania Medical Complex (SMC), Kingdom of Bahrain, for their technical assistance.
This study was funded by Arabian Gulf University-Bahrain (AGU 74-2011), King Abdullah International Medical Research Center-Saudi Arabia (IRBC-112-11), and WHO/EMRO (TSA 200303689).

Notes

CONFLICTS OF INTEREST: No potential conflict of interest relevant to this article was reported.

References

1. Joslin EP, Kahn CR, Weir GC. Joslin's diabetes mellitus. 13th ed. Philadelphia: Lea & Febiger;1994. p. 240–264. Chapter 16, Pathogenesis of non-insulin dependent (type II) diabetes mellitus.
2. Report of a WHO Study Group. Diabetes mellitus. World Health Organ Tech Rep Ser. 1985; 727:1–113. PMID: 3934850.
3. Prentki M, Nolan CJ. Islet beta cell failure in type 2 diabetes. J Clin Invest. 2006; 116:1802–1812. PMID: 16823478.
4. Grundy SM. Atherogenic dyslipidemia associated with metabolic syndrome and insulin resistance. Clin Cornerstone. 2006; 8(Suppl 1):S21–S27. PMID: 16903166.
crossref
5. Grundy SM. Metabolic syndrome: connecting and reconciling cardiovascular and diabetes worlds. J Am Coll Cardiol. 2006; 47:1093–1100. PMID: 16545636.
crossref
6. Hunter SJ, Garvey WT. Insulin action and insulin resistance: diseases involving defects in insulin receptors, signal transduction, and the glucose transport effector system. Am J Med. 1998; 105:331–345. PMID: 9809695.
7. Ma ZA, Zhao Z, Turk J. Mitochondrial dysfunction and beta-cell failure in type 2 diabetes mellitus. Exp Diabetes Res. 2012; 2012:703538. PMID: 22110477.
8. McGarry JD. Banting lecture 2001: dysregulation of fatty acid metabolism in the etiology of type 2 diabetes. Diabetes. 2002; 51:7–18. PMID: 11756317.
9. Stannard SR, Johnson NA. Insulin resistance and elevated triglyceride in muscle: more important for survival than “thrifty” genes? J Physiol. 2004; 554:595–607. PMID: 14608009.
crossref
10. Yamauchi T, Kamon J, Waki H, Terauchi Y, Kubota N, Hara K, et al. The fat-derived hormone adiponectin reverses insulin resistance associated with both lipoatrophy and obesity. Nat Med. 2001; 7:941–946. PMID: 11479627.
crossref
11. Kwon H, Pessin JE. Adipokines mediate inflammation and insulin resistance. Front Endocrinol (Lausanne). 2013; 4:71. PMID: 23781214.
crossref
12. Makki K, Froguel P, Wolowczuk I. Adipose tissue in obesity-related inflammation and insulin resistance: cells, cytokines, and chemokines. ISRN Inflamm. 2013; 2013:139239. PMID: 24455420.
crossref
13. Sanchez D, Miguel M, Aleixandre A. Dietary fiber, gut peptides, and adipocytokines. J Med Food. 2012; 15:223–230. PMID: 22181071.
14. Kojima M, Hosoda H, Date Y, Nakazato M, Matsuo H, Kangawa K. Ghrelin is a growth-hormone-releasing acylated peptide from stomach. Nature. 1999; 402:656–660. PMID: 10604470.
crossref
15. Dezaki K, Sone H, Yada T. Ghrelin is a physiological regulator of insulin release in pancreatic islets and glucose homeostasis. Pharmacol Ther. 2008; 118:239–249. PMID: 18433874.
crossref
16. Yada T, Dezaki K, Sone H, Koizumi M, Damdindorj B, Nakata M, et al. Ghrelin regulates insulin release and glycemia: physiological role and therapeutic potential. Curr Diabetes Rev. 2008; 4:18–23. PMID: 18220691.
crossref
17. Pacifico L, Poggiogalle E, Costantino F, Anania C, Ferraro F, Chiarelli F, et al. Acylated and nonacylated ghrelin levels and their associations with insulin resistance in obese and normal weight children with metabolic syndrome. Eur J Endocrinol. 2009; 161:861–870. PMID: 19773372.
crossref
18. Tschop M, Smiley DL, Heiman ML. Ghrelin induces adiposity in rodents. Nature. 2000; 407:908–913. PMID: 11057670.
crossref
19. Lopez M, Lage R, Saha AK, Perez-Tilve D, Vazquez MJ, Varela L, et al. Hypothalamic fatty acid metabolism mediates the orexigenic action of ghrelin. Cell Metab. 2008; 7:389–399. PMID: 18460330.
20. Wallace TM, Levy JC, Matthews DR. Use and abuse of HOMA modeling. Diabetes Care. 2004; 27:1487–1495. PMID: 15161807.
crossref
21. DeFronzo RA, Tobin JD, Andres R. Glucose clamp technique: a method for quantifying insulin secretion and resistance. Am J Physiol. 1979; 237:E214–E223. PMID: 382871.
crossref
22. Muniyappa R, Lee S, Chen H, Quon MJ. Current approaches for assessing insulin sensitivity and resistance in vivo: advantages, limitations, and appropriate usage. Am J Physiol Endocrinol Metab. 2008; 294:E15–E26. PMID: 17957034.
crossref
23. Laakso M. How good a marker is insulin level for insulin resistance? Am J Epidemiol. 1993; 137:959–965. PMID: 8317453.
crossref
24. Matthews DR, Hosker JP, Rudenski AS, Naylor BA, Treacher DF, Turner RC. Homeostasis model assessment: insulin resistance and beta-cell function from fasting plasma glucose and insulin concentrations in man. Diabetologia. 1985; 28:412–419. PMID: 3899825.
25. Prudom C, Liu J, Patrie J, Gaylinn BD, Foster-Schubert KE, Cummings DE, et al. Comparison of competitive radioimmunoassays and two-site sandwich assays for the measurement and interpretation of plasma ghrelin levels. J Clin Endocrinol Metab. 2010; 95:2351–2358. PMID: 20194708.
crossref
26. Cummings DE, Weigle DS, Frayo RS, Breen PA, Ma MK, Dellinger EP, et al. Plasma ghrelin levels after diet-induced weight loss or gastric bypass surgery. N Engl J Med. 2002; 346:1623–1630. PMID: 12023994.
crossref
27. Poykko SM, Kellokoski E, Horkko S, Kauma H, Kesaniemi YA, Ukkola O. Low plasma ghrelin is associated with insulin resistance, hypertension, and the prevalence of type 2 diabetes. Diabetes. 2003; 52:2546–2553. PMID: 14514639.
28. Weyer C, Bogardus C, Mott DM, Pratley RE. The natural history of insulin secretory dysfunction and insulin resistance in the pathogenesis of type 2 diabetes mellitus. J Clin Invest. 1999; 104:787–794. PMID: 10491414.
crossref
29. Katsuki A, Urakawa H, Gabazza EC, Murashima S, Nakatani K, Togashi K, et al. Circulating levels of active ghrelin is associated with abdominal adiposity, hyperinsulinemia and insulin resistance in patients with type 2 diabetes mellitus. Eur J Endocrinol. 2004; 151:573–577. PMID: 15538935.
crossref
30. Tschop M, Weyer C, Tataranni PA, Devanarayan V, Ravussin E, Heiman ML. Circulating ghrelin levels are decreased in human obesity. Diabetes. 2001; 50:707–709. PMID: 11289032.
31. Goldfine ID. The insulin receptor: molecular biology and transmembrane signaling. Endocr Rev. 1987; 8:235–255. PMID: 3308443.
crossref
32. Ukkola O, Poykko S, Paivansalo M, Kesaniemi YA. Interactions between ghrelin, leptin and IGF-I affect metabolic syndrome and early atherosclerosis. Ann Med. 2008; 40:465–473. PMID: 19160571.
crossref
33. Annuzzi G, De Natale C, Iovine C, Patti L, Di Marino L, Coppola S, et al. Insulin resistance is independently associated with postprandial alterations of triglyceride-rich lipoproteins in type 2 diabetes mellitus. Arterioscler Thromb Vasc Biol. 2004; 24:2397–2402. PMID: 15458975.
crossref
34. Rocha NP, Siqueira-Catania A, Barros CR, Pires MM, Folchetti LD, Ferreira SR. Analysis of several anthropometric measurements for the identification of metabolic syndrome, with or without disturbance of glucose metabolism. Arq Bras Endocrinol Metabol. 2010; 54:636–643. PMID: 21085769.
35. Dezaki K, Yada T. Islet beta-cell ghrelin signaling for inhibition of insulin secretion. Methods Enzymol. 2012; 514:317–331. PMID: 22975062.
36. Mayfield J. Diagnosis and classification of diabetes mellitus: new criteria. Am Fam Physician. 1998; 58:1355–1362. 1369–1370. PMID: 9803200.
37. Natali A, Muscelli E, Mari A, Balkau B, Walker M, Tura A, et al. Insulin sensitivity and beta-cell function in the offspring of type 2 diabetic patients: impact of line of inheritance. J Clin Endocrinol Metab. 2010; 95:4703–4711. PMID: 20660046.
38. Gayoso-Diz P, Otero-Gonzalez A, Rodriguez-Alvarez MX, Gude F, Garcia F, De Francisco A, et al. Insulin resistance (HOMA-IR) cut-off values and the metabolic syndrome in a general adult population: effect of gender and age: EPIRCE cross-sectional study. BMC Endocr Disord. 2013; 13:47. PMID: 24131857.
crossref
39. UK Prospective Diabetes Study Group. UK Prospective Diabetes Study. XII: Differences between Asian, Afro-Carib-bean and white Caucasian type 2 diabetic patients at diagnosis of diabetes. Diabet Med. 1994; 11:670–677. PMID: 7955993.
40. Martin BC, Warram JH, Krolewski AS, Bergman RN, Soeldner JS, Kahn CR. Role of glucose and insulin resistance in development of type 2 diabetes mellitus: results of a 25-year follow-up study. Lancet. 1992; 340:925–929. PMID: 1357346.
crossref
41. Horwitz DL, Starr JI, Mako ME, Blackard WG, Rubenstein AH. Proinsulin, insulin, and C-peptide concentrations in human portal and peripheral blood. J Clin Invest. 1975; 55:1278–1283. PMID: 1133173.
crossref
Fig. 1

Fasting plasma levels of ghrelin (pmol/L) in subjects with type 2 diabetes mellitus (T2DM) and healthy non-diabetic controls from Saudi Arabia. Comparison between (A) all subjects with T2DM versus all control subjects, and (B) age- and sex-matched subjects with T2DM versus healthy subjects. Ghrelin levels were consistently significantly lower in patients with T2DM. The horizontal line within each box represents the median, while the lower and upper ends of the box are the 25th and 75th percentiles, the cap of the vertical line is the 95th percentile, and the closed circles are outliers.

enm-32-230-g001
Fig. 2

Fasting plasma levels of ghrelin (pmol/L); comparison between (A) all study subjects (type 2 diabetes mellitus [T2DM] subjects and controls) with or without insulin resistance (IR) (homeostatic model assessment of insulin resistance [HOMA-IR] ≥3 and <3, respectively), (B) T2DM subjects with or without IR, and (C) T2DM subjects with moderate IR (HOMA-IR 3 to 5) and severe IR (HOMA-IR >5). Ghrelin levels were significantly lower in subjects with IR in (A) and (B) (P<0.001 and P=0.049, respectively). The horizontal line within each box represents the median, while the lower and upper ends of the box are the 25th and 75th percentiles, the cap of the vertical line is the 95th percentile, and the closed circles are outliers.

enm-32-230-g002
Table 1

Age and Biochemical Profiles of the Study Population, Comprising Saudi Subjects with T2DM and Apparently Healthy Non-Diabetic Subjects

enm-32-230-i001
Parameter Control subject T2DM subject P value
Samples from
 All subjects 101 107
 Ghrelin-measured 68 97
 Age-matched 30 80
 Age matched (ghrelin) 24 71
Sex, male/female 57/44 61/46
Disease duration, yr
 Mean±SD NA 8.013±7.023
 Median (interquartile range) NA 6.0 (3.75–10.00)
BMI, kg/m2 28.9 (25.5–32.4) 32.5 (29.7–36.4) <0.001a
Weight, kg 75.0 (65.6–88.2) 85.0 (74.5–94.7) <0.001a
Family history of DM 46/101 (45.5) 74/107 (69.2) <0.001b
FBG level, mmol/L 5.1 (4.9–5.4) 7.8 (6.4–10.8) <0.001
HbA1c, mmol/mol 37 (32–40) 64 (52–74) <0.001
HbA1c, % 5.5 (5.1–5.8) 8.0 (6.9–8.9) -
FBI level, pmol/L 49.0 (35.0–58.3) 59.0 (38.5–89.4) 0.006
FBI (age-matched), pmol/L 42.5 (36.0–58.0) 60.9 (40.1–99.5) 0.009
C-peptide, ng/mL 1.91 (1.43–2.54) 2.23 (1.49–2.92) 0.105
HOMA-IR (all subjects) 1.53 (1.09–1.96) 2.90 (1.80–5.29) <0.001
HOMA-IR (age-matched) 1.5 (1.1–2.0) 3.35 (2.25–5.90) <0.001

Values are expressed as number (%) or median (interquartile range).

T2DM, type 2 diabetes mellitus; NA, not available; BMI, body mass index; DM, diabetes mellitus; FBG, fasting blood glucose; HbA1c, hemoglobin A1c; FBI, fasting blood insulin; HOMA-IR, homeostatic model assessment of insulin resistance.

aMann-Whitney rank sum test; bChi-square test.

Table 2

Biochemical Profile of IR and Non-IR Healthy Subjects and T2DM Subjects from Saudi Arabia

enm-32-230-i002
Parameter Control subjects (n=101) T2DM subjects (n=107)
IR (HOMA-IR ≥3) Non-IR (HOMA-IR <3) P valuea IR (HOMA-IR ≥3) Non-IR (HOMA-IR <3) P valuea
Subject 6 (5.9) 95 (94.1) 50 (46.7)b 57 (53.3)
Age, yr 34.5 (34.0–47.0) 35.0 (28.0–43.0) 0.499 48.8±9.8 48.2±11.8 0.769
Ghrelin level, pmol/L 17.2 (14.8–22.6) (n=5) 19.3 (14.9–23.6) (n=63) 0.823 10.4 (7.1–16.9) (n=42) 14.5 (11.1–16.5) (n=55) 0.049
BMI, kg/m2 38.40±4.50 28.79±5.43 <0.001 34.1 (31.3–39.5) 31.2 (28.1–33.0) <0.001
Weight, kg 102.2±16.24 75.39±15.49 <0.001 90.535±19.12 81.893±15.15 0.011
FBG level, mmol/L 5.1 (5.1–5.2) 5.1 (4.9–5.4) 0.840 9.8 (7.0–12.70) 7.1 (6.1–9.3) <0.001
HbA1c, mmol/mol 37.7 (36.6–41.0) 36.6 (32.2–39.9) - 70.5 (59.6–83.6) 55.2 (46.4–67.8)
HbA1c, % 5.6 (5.5–5.9) 5.5 (5.1–5.8) 0.489 8.6 (7.6–9.8) 7.2 (6.4–8.35) <0.001
C-peptide, ng/mL 4.17±0.83 1.98±0.781 <0.001c 2.34 (1.38–3.63) 2.03 (1.55–2.62) 0.130
FBI, pmol/L 111.3±19.45 46.86±17.67 <0.001c 94.3 (74.0–161.0) 40.2 (27.4–51.5) <0.001
HOMA-IR 3.42 (3.19–3.48) 1.51 (1.08–1.77) <0.001 5.35 (4.05–8.25) 1.83 (1.21–2.38) <0.001

Values are expressed as number (%), median (interquartile range), or mean±SD.

IR, insulin resistance; T2DM, type 2 diabetes mellitus; HOMA-IR, homeostatic model assessment of insulin resistance; BMI, body mass index; FBG, fasting blood glucose; HbA1c, hemoglobin A1c; FBI, fasting blood insulin.

aMann-Whitney rank sum test; bThe prevalence of severe IR was 26.2% (28 of 107); ct test.

Table 3

Correlations of the HOMA-IR Index with Age, Disease Duration, and Anthropometric and Glycemic Parameters in Saudis (Healthy Subjects and Patients with IR and Non-IR T2DM)

enm-32-230-i003
Variable HOMA-IR vs. Control subjects HOMA-IR vs. T2DM subjects (all)
Non-IR-T2DM IR-T2DM
Age R=0.008, P=0.935 (n=101) R=–0.114, P=0.244 (n=107)
R=0.062, P=0.647 (n=57) R=–0.211, P=0.141 (n=50)
Disease duration - R=0.065, P=0.526 (n=97)
R=–0.104, P=0.472 (n=50) R=0.027, P=0.859 (n=47)
BMI R=0.432, P<0.001 (n=97) R=–0.0409, P=0.680 (n=104)
R=0.104, P=0.447 (n=56) R=–0.180, P=0.222 (n=48)
Weight R=0.422, P<0.001 (n=99) R=–0.070, P=0.478 (n=105)
R=0.042, P=0.759 (n=56) R=–0.196, P=0.178 (n=49)
FBG R=0.223, P=0.025 (n=101) R=0.133, P=0.171
R=0.118, P=0.381 (n=57) R=0.063, P=0.665 (n=50)
HbA1c R=–0.037, P=0.714 (n=101) R=0.123, P=0.206
R=–0.089, P=0.510 (n=57) R=0.026, P=0.860 (n=50)
FBI R=0.979, P<0.001 (n=101) R=0.991, P<0.001
R=0.774, P<0.001 (n=57) R=0.990, P<0.001 (n=50)
C-peptide R=0.718, P<0.001 (n=101) R=–0.087, P=0.372
R=0.287, P=0.031 (n=57) R=–0.187, P=0.194 (n=50)

HOMA-IR, homeostatic model assessment of insulin resistance; IR, insulin resistance; T2DM, type 2 diabetes mellitus; BMI, body mass index; FBG, fasting blood glucose; HbA1c, hemoglobin A1c; FBI, fasting blood insulin.

Table 4

Correlations of Plasma Ghrelin Levels with Anthropometric and Glycemic Parameters and the HOMA-IR Index in Saudi Subjects (Healthy and Patients with T2DM: All and with IR Only)

enm-32-230-i004
Variable Ghrelin vs.
Control subjects Total T2DM subjects T2DM subjects with IR
Age R=0.038, P=0.762 (n=68) R=–0.028, P=0.789 (n=97) R=–0.002, P=0.992 (n=42)
Duration NA R=0.194, P=0.068 (n=89) R=0.177, P=0.276 (n=40)
BMI R=–0.077, P=0.544 (n=64) R=–0.120, P=0.249 (n=95) R=0.084, P=0.604 (n=41)
Weight R=–0.255, P=0.039 (n=66) R=–0.255, P=0.012 (n=96) R=–0.149, P=0.347 (n=42)
FBG R=–0.038, P=0.761 (n=68) R=–0.0658, P=0.522 (n=97) R=–0.069, P=0.666 (n=42)
HbA1c R=0.215, P=0.078 (n=68) R=–0.0449, P=0.662 (n=97) R=0.020, P=0.898 (n=42)
FBI R=–0.312, P=0.010 (n=68) R=–0.192, P=0.059 (n=97) R=–0.217, P=0.168 (n=42)
C-peptide R=–0.217, P=0.076 (n=68) R=–0.0155, P=0.880 (n=97) R=0.027, P=0.867 (n=42)
HOMA-IR R=–0.303, P=0.012 (n=68) R=–0.195, P=0.055 (n=97) R=–0.224, P=0.154 (n=42)

HOMA-IR, homeostatic model assessment of insulin resistance; T2DM, type 2 diabetes mellitus; IR, insulin resistance; NA, not available; BMI, body mass index; FBG, fasting blood glucose; HbA1c, hemoglobin A1c; FBI, fasting blood insulin.

TOOLS
Similar articles