

 PDF
PDF ePub
ePub Citation
 Print
Print


INTRODUCTION
Obesity is the cause of a variety of metabolic disorders and increases the risk of cardiovascular disease (CVD) [1]. There are various anthropometric measures for assessing obesity. Body mass index (BMI) is the most frequently used measure for obesity. However, BMI is correlated with total body fat, and does not reflect body fat distribution. Body adiposity differs according to age, gender, and ethnicity, and BMI alone is not able to distinguish between a person with excess fat and a person with high muscle mass, who would thus have the same cardiovascular risk [2]. Waist circumference (WC) is another measure of obesity, which considers fat distribution and correlates well with abdominal imaging in its ability to discriminate visceral adiposity from simple obesity [3]. Recent studies have emphasized that where fat accumulates is more important than the simple fat mass [4]. Previous studies have found an association between visceral fat and atherosclerosis. Thus, indices that reflect central obesity such as WC, waist-hip ratio (WHR), and waist-height ratio (WHtR) have gained popularity for the measurement of relative visceral fat distribution [56]. Visceral obesity is a strong risk factor for metabolic disorders and is associated with increased risk for CVD [47].
Atherosclerosis is a major cause of CVD. Appropriate screening for atherosclerosis is important for the early detection and prevention of overt CVD. There are many studies on non-invasive methods for detecting arteriosclerosis [8]. Among them, coronary artery calcification (CAC) is considered to be a good surrogate marker for atherosclerosis and is positively associated with CVD events [9]. Multi-detector computed tomography (MDCT) allows for the detection and quantification of CAC, which correlates with plaque burden in patients at high risk for CVD [10]. An observational population-based cohort study has reported that there is a direct correlation between coronary artery calcium score (CACS) severity and CVD risk as assessed by the Framingham risk score [9].
There are many studies that have analyzed the relationship between the CACS and obesity. A recent study has reported a correlation between CAC and the hypertriglyceridemic waist phenotype [11]. The high triglyceride and enlarged WC group showed the highest correlation with CAC, and patients with elevated triglycerides or enlarged WC correlated with CAC as compared to those with normal triglycerides and normal WC [11]. However, whether BMI or WC predicted CAC better was not clarified yet.
In this study, we aimed to assess the risk for CAC based on BMI and WC in apparently healthy Korean adults. We divided participants into three groups by BMI and assessed metabolic variables with CACS in each group. We also divided patients into six groups based on BMI combined with WC and assessed for the presence of CAC as the dependent variable.
METHODS
Study design and study participants
This was a cross-sectional study composed of participants in the Kangbuk Samsung Health Study, which is a program at the Health Promotion Center of Kangbuk Samsung Hospital, Sungkyunkwan University School of Medicine, Seoul, Korea. The purpose of the program is to promote the health of employees through regular health checkups and to enhance the early detection of existing diseases. Most of the patients are employees and family members of various industrial companies from around the country. The costs of the medical examinations are largely paid for by their employers, and a considerable proportion of the patients undergo examinations annually or biannually.
Of the 34,462 subjects who participated in the checkup program between January 2010 and December 2012, we excluded subjects with a self-reported history of ischemic heart disease (n=419) or ischemic stroke (n=270) and subjects with missing information (n=642). Final analyses were performed in 33,432 subjects. Participants ranged in age from 23 to 89 years (mean, 41) and there were 26,836 men (80.3%). Participants were divided into three groups according to BMI: <23 kg/m2 (normal), 23 to 25 kg/m2 (overweight), and >25 kg/m2 (obese). In addition, participants were divided into two groups based on WC: <90 cm in men (normal), <85 cm in women (normal), ≥90 cm in men (obese), and ≥85 cm in women (obese) according to the Asian-specific WC criteria of the International Diabetes Federation [12]. For further analyses, the participants were divided into six groups according to BMI and WC.
Participants provided written informed consent for the use of their health screening data for research. The design, protocol, and the consent procedure of this study were reviewed and approved by Institutional Review Board of Kangbuk Samsung Hospital and is in accordance with the Helsinki Declaration of 1975.
Anthropometric and laboratory measurements
The height and weight of the participants were measured twice with participants wearing lightweight gowns, and were then averaged. The BMI was calculated by dividing the weight (kg) by the square of the height (m). The WC was measured in the standing position, at the midpoint between the anterior iliac crest and lower border of the last palpable rib by a single examiner. Blood pressure was measured using a standardized sphygmomanometer after 5 minutes of rest.
All of the participants underwent blood tests and were examined after an overnight fast. The hexokinase method was used to test fasting glucose concentrations (Hitachi Modular D2400, Roche, Tokyo, Japan). Fasting insulin concentrations were determined by an electrochemiluminescence immunoassay (Hitachi Modular E170, Roche). An enzymatic calorimetric test was used to measure the total cholesterol and triglyceride concentrations. The selective inhibition method was used to measure the level of high-density lipoprotein cholesterol, and a homogeneous enzymatic calorimetric test was used to measure the level of low density lipoprotein cholesterol (LDL-C). Serum high-sensitivity C-reactive protein levels were measured using a nephelometric assay and BNII nephelometer (Dade Behring, Deerfield, IL, USA). Insulin resistance was assessed by homeostasis model assessment index-insulin resistance [13].
The presence of diabetes mellitus was determined based on a self-completed questionnaire and the diagnostic criteria of the American Diabetes Association [14]. The presence of hypertension was defined by criteria recommended by the eighth report of the Joint National Committee for the prevention, detection, evaluation, and treatment of high BP (JNC 8) [15], with a blood pressure cutoff of ≥140/90 mm Hg or if the individual was presently taking anti-hypertensive medication. Smoking status was determined by a questionnaire. A smoker was defined as a participant who had ever smoked at least five total packs of cigarettes in his or her life.
Measurement of CACS
MDCT for CACS was undertaken by 64-slice spiral computed tomography (CT) scan (GE Healthcare, Tokyo, Japan) using the software HEARTBEAT-CS (Philips, Cleveland, OH, USA). The severity of CAC was assessed by the Agatston score [16]: 0, 1 to 10, 11 to 100, 101 to 400, and >400. A total CACS was determined by the sum of the individual scores for the four major epicardial coronary arteries: left main, left anterior descending, left circumflex, and right coronary. The MDCT examiners were blinded to all patient information. The presence of CAC was defined by a CACS >0.
Statistical analysis
All data are presented as the mean±standard deviations, and were analyzed using SPSS version 18.0 (SPSS Inc., Chicago, IL, USA). The one-way analysis of variance test was performed to compare the parameters between the three groups divided by BMI and the parameters between the six groups divided by BMI and WC. Comparisons of the prevalence of CAC among the three groups divided by BMI and among the six groups divided by BMI and WC were performed with the chi-square test. Multivariate logistic regression analyses with the CACS >0 as the dependent variable were performed with other confounding variables included in the model. Receiver operating characteristic (ROC) curve analysis for CACS >0 was performed with BMI and WC. Significance was defined as P<0.05.
RESULTS
Study population
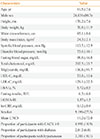
The general characteristics of the participants are presented in Table 1. The mean age of the participants was 41 years (range, 23 to 89). Eighty percentage of the participants were male, the mean BMI was 24.3 kg/m2, and the mean WC was 85 cm. The mean CACS was 11.2 and the proportion of participants with CACS >0 was 14.9%. Twenty-seven percentage of the participants had a smoking history and 6% had diabetes.
Comparison of the metabolic variables according to BMI
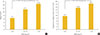
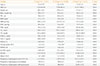
Participants were divided into three groups according to BMI: <23, 23 to 25, and >25 kg/m2. To compare metabolic variables based on BMI, post hoc analyses were performed (Table 2). As BMI increased, blood pressure, fasting blood sugar, total cholesterol, triglycerides, LDL-C, glycated hemoglobin, fasting insulin, and the proportion of participants with diabetes also increased. The proportion of male participants and smokers also increased with BMI. The mean value of CACS and the proportion of participants with CAC significantly increased as BMI increased from normal to overweight to obese (6.7±49.5, 11.7±75.3, 14.8±84.7; 9.9%, 15.6%, 18.7%, respectively; P<0.01) (Fig. 1).
Presence of coronary artery calcification according to the groups divided by BMI and WC
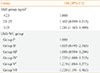
Participants were divided into six groups according to BMI and WC and we performed logistic regression analyses with the presence of CAC as the dependent variable. When the risk for CAC was analyzed in three groups divided by BMI, the risk for CAC increased as BMI increased after adjusting for confounding variables (odds ratio [OR], 1.102; 95% confidence interval [CI], 1.000 to 1.216; and 1.284 [95% CI, 1.169 to 1.410]; in the overweight and obese groups vs. the normal weight group). When the risk for CAC was analyzed in the six groups divided by BMI and WC, those with BMI and WC in the obese range showed the highest risk for CAC (OR, 1.321; 95% CI, 1.194 to 1.461) and those with BMI in the overweight range and WC in the obese range showed the second highest risk for CAC (OR, 1.235; 95% CI, 1.194 to 1.461), followed by those with BMI in the obese range and WC in the normal range (OR, 1.219; 95% CI, 1.084 to 1.371) after adjusting for confounding variables (Table 3).
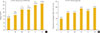
When the mean CACS was compared among the groups divided by BMI and WC, the groups with BMI >25 kg/m2 and WC in the obese range showed the highest value (Fig. 2). Comparison of the proportion of participants with CACS >0 among the six groups divided by BMI and WC showed that the group with BMI in the overweight range and WC in the obese range showed the significantly highest proportion followed by the group with BMI in the overweight range and WC in the obese range (Fig. 2).
When ROC curve analysis for CACS >0 was performed, WC showed higher area under the curve (AUC) compared to BMI for CACS >0 (0.59 vs. 0.60).
DISCUSSION
In this large study of Korean adults participating in a health screening program, the mean value of CACS and the proportion of participants with CAC significantly increased as BMI increased from the normal range to the obese range. We performed additional analysis of the relationship between BMI, WC, and CAC in the groups divided by BMI and WC. Those with a BMI and WC in the obese range showed the highest risk for CAC while those with BMI in the overweight range and WC in the obese range showed the second highest risk for CAC. In addition, WC showed higher AUC for CAC compared to BMI. This study suggests that WC as a marker of obesity is more predictive of CAC than BMI.
Among the various measurements of obesity, BMI is the first developed and most widely used, notably by the World Health Organization [17]. Obesity, as defined by BMI, is undoubtedly associated with an increased cardiovascular risk. However, BMI is correlated with total body fat, and does not reflect body fat distribution. Therefore, BMI alone is not able to distinguish between a person with excess fat and a person with high muscle mass, who would have the same cardiovascular risk [2]. Because the relationship between visceral fat and atherosclerosis is mechanistically clear, indices that reflect central obesity such as WC, WHR, and WHtR have gained popularity for the measurement of relative visceral fat distribution [56]. In the Healthy Twin Study performed in a Korean population, simple anthropometric measurements (WC, WHtR, and BMI) had better predictability for metabolic risks as compared to direct body fat measurements, and WC and WHtR also showed a closer association with metabolic risk factors than the indices of general adiposity [18]. Bosy-Westphal et al. [19] reported that although the differences were small and depended on sex and the type of risk factor, measures of central adiposity (WC/WHtR) tended to have a closer association with metabolic risk factors compared to measures of general adiposity. Schneider et al. [20] reported that WC and WHtR had better predictability for cardiovascular risk as compared to BMI. In a systemic review that analyzed the role of WHtR as a screening tool for the prediction of CVD and diabetes, some studies showed that WHtR and WC had a higher OR and hazard ratio compared to BMI or remained significant predictors after adjusting for BMI, and therefore WHtR and WC are better predictors for CVD and diabetes than BMI [6]. In a cross-sectional study performed in 305 individuals, WHtR and WC correlated better than BMI with arterial stiffness as evaluated by pulsed wave velocity and with subclinical atherosclerosis measured by carotid intima-media thickness [21]. From these previous studies and the result of our study, we believe that WC is a better marker for obesity, metabolic risk, and CAC than BMI.
Subclinical atherosclerosis is very important because it is a major causal risk factor for CVD at a stage when prevention could be meaningful [8]. However, the optimal practice for the detection of subclinical atherosclerosis has not yet been established. In this study, measurement of CAC was used as the detection method. CACS as measured by CT is an equivalent measure for coronary atherosclerotic burden in adults and shows good correlation with visceral adiposity and CVD [22]. There are many studies analyzing the association between WC, WHtR, WHR, BMI, and CAC. In the Jackson Heart Study, 2,884 participants underwent non-contrast CT for the assessment CAC and abdominal adiposity, which showed that visceral adipose tissue was positively associated with CAC, but this association was diminished with multivariable adjustment [23]. In a study performed in 321 Japanese participants, Ohashi et al. [24] reported that visceral adiposity was significantly associated with the presence and extent of CAC. In a study of 924 healthy Koreans, CAC showed a significant positive correlation with WC, WHR, and WHR as the most significant predictors for CAC [7]. Our study showed that the group that met the criteria for obesity by both BMI and WC had the highest CAC risk, followed by the group that met the criteria for overweight by BMI and obesity by WC. Therefore, the WC, which considers visceral adiposity, is a better predictor of CAC risk than BMI.
CAC is a good surrogate marker for cardiovascular risk, and many studies have tried to correlate CAC with indices of obesity, with recent reports emphasizing that visceral obesity has a better correlation with metabolic syndrome, CAC, and subsequent cardiovascular risk [4]. However, it is still unknown whether BMI or WC is a better predictor of CAC. To investigate this question, our study evaluated 33,432 Koreans participants divided into six groups according to BMI and WC. The group with BMI and WC in the obese range had the highest CAC values, followed by the group with BMI in the overweight range and WC in the obese range. In addition, in ROC curve analysis, WC showed higher AUC (0.60) compared to BMI (0.59) for CAC. Therefore, we suggest that WC as a marker of obesity is more predictive of CAC than BMI.
This study has several limitations. First, because the study population was not representative of the Korean population, the results of our study cannot be extrapolated to the general population in Korea. Second, our study had significantly fewer female participants than male participants, and the proportion of men likely resulted in more participants in the obese groups. Third, our study was cross-sectional, so a cause-and-effect relationship cannot be determined from this study. Fourth, because the study population consisted of relatively fit individuals in a health checkup program, there was only a small percentage of participants with CACS >0. Fifth, this study did not include relevant information such as past medical history and medication history because these were not available for analysis. Despite these limitations, our study is meaningful in that it is the first study performed in a Korean population assessing the relationship between BMI, WC, and CAC.
In conclusion, we found that participants with obesity as defined by both the BMI and WC showed the highest risk for CAC. Those with BMI in the overweight range but with WC in the obese range showed the second highest risk for CAC. Therefore we suggest that WC as a marker of obesity is more predictive of CAC than BMI. Further studies are needed to confirm the predictive value of WC in CAC in different ethnic and age groups.
 XML Download