

 PDF
PDF ePub
ePub Citation
 Print
Print


INTRODUCTION
Primary aldosteronism (PA) is the most common cause of secondary hypertension and is characterized by hypertension and hypokalemia. In the past, the prevalence of PA was considered to be less than 1%. Since the introduction of the aldosterone-torenin ratio (ARR), PA has been reported in more than 10% of hypertensive patients [1]. Furthermore, the rate of complications involving the cardiovascular system, kidney, and brain has been reported to be greater in patients with PA compared to those with essential hypertension (EH) [2]. Hence, the early diagnosis and management of PA is critical to prevent end organ damage.
ARR is a useful screening test for PA [134]. However, lack of uniformity in protocols and assay methods have led to different cut-off values for the ratio ranging from 20 to 100 (ng/dL)/(ng/mL/hr) [3]. Moreover, the ARR screening test depends on the precision and accuracy of the plasma renin activity (PRA) as the denominator [5]. Therefore, a subtle change in low PRA exaggerates ARR, leading to misdiagnose low-renin hypertension as PA. There is thus an unmet need for a more reliable screening test in detecting PA to reduce the chance for unnecessary confirmatory tests.
Previous guidelines recommended several confirmatory tests, including oral sodium loading test, saline infusion test (SIT), captopril challenge test (CCT), furosemide upright test (FUT), and fludrocortisone suppression test (FST) [134]. However, it is unclear which of these tests is the most reliable. The guidelines also advised that the choice of confirmatory test be determined by cost, patient compliance, laboratory routine, and local expertise [35]. The oral sodium loading test and SIT carry a potential risk for acute volume overload, especially in individuals with uncontrolled hypertension, heart failure, or renal dysfunction [3]. The FUT can precipitate orthostatic hypotension and aggravation of hypokalemia. The FST is cumbersome owing to 4-day test period. However, the CCT is simple, safe, less expensive, and easily performed in outpatient clinics. Some researchers reported that the diagnostic accuracy of CCT was comparable to other confirmatory tests [56789] whereas others asserted that CCT is unreliable and misleading [10]. In the present study, we aimed to establish the role of CCT in diagnosing PA from a different angle, suggesting dual cut-off values as a post-screening test and a confirmatory test.
METHODS
Study subjects
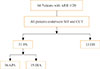
We initially included 64 patients with positive ARR (≥20) suspected of PA at Seoul National University Hospital and Seoul Metropolitan Government Seoul National University Boramae Medical Center from 2011 to 2014 (Fig. 1). The positive screening value of ARR for PA was based on the 2008 Endocrine Society clinical practice guideline for PA [3]. Patients were screened for PA due to adrenal incidentaloma (n=60) or unevoked hypokalemia and hypertension (n=4).
All patients underwent both SIT and CCT. All antihypertensive drugs including diuretics, β-blockers, angiotensin-converting enzyme-inhibitors, and angiotensin II receptor blockers were discontinued at least 4 weeks prior to measuring plasma aldosterone concentration (PAC) and PRA (at least 6 weeks in the case of spironolactone). Instead, calcium channel blockers (verapamil or amlodipine) and/or α-blockers (doxazosin) were administered. Patients were advised to maintain their regular diet and sodium intake. Hypokalemia was corrected before the two tests, which were done after an overnight fast and on two consecutive days. Patients received the SIT on the first day and the CCT on the second day. For the SIT test, patients were kept in the recumbent position for at least 30 minutes. Afterwards, 2 L of 0.9% NaCl was infused intravenously over 4 hours. Blood samples for PAC were drawn before and at the completion of the saline infusion. A positive test was considered if PAC post-SIT was ≥10 ng/dL [3]. For the CCT, baseline PAC and PRA were sampled after 30 minutes in a sitting position, and after administration of 50 mg captopril tablets, blood samples were drawn for measurement of PAC and PRA at 60 and 90 minutes [4].
Identification of aldosterone producing adenoma (APA) required all of the following criteria: (1) evidence of autonomous excess aldosterone production based on an ARR >20 (ng/dL)/(ng/mL/hr) and a PAC >10 ng/dL after SIT; (2) lateralization of aldosterone secretion at adrenal vein sampling; (3) evidence of adrenal adenoma on a computed tomography (CT); and (4) pathologically proven adrenal cortical adenoma after an adrenalectomy, and cure of hypertension without antihypertensive agents or improved hypertension, potassium, PAC, and PRA as described [611]. All APA patients underwent adrenalectomy. Before operation, blood pressure and potassium were corrected by spironolactone only or with calcium channel blocker (verapamil). Idiopathic hyperaldosteronism (IHA) was diagnosed based on the following modified criteria: (1) evidence of autonomous excess aldosterone production based on an >20 (ng/dL)/(ng/mL/hr) and a PAC >10 ng/dL after SIT; (2) non-lateralization of aldosterone secretion at adrenal vein sampling; and (3) evidence of bilateral diffuse enlargement or no mass on a CT. All IHA patients were treated with mineralocorticoid receptor antagonists, and serum potassium levels were normalized in those patients. The patients with negative SIT results were diagnosed with EH [12]. Finally, 36 patients were diagnosed with APA, and 15 patients with IHA (Fig. 1). The study protocol was approved by the Institutional Review Board of the Seoul National University and adhered to the principles of the Declaration of Helsinki.
Biochemical measurements
In all centers, PRA was measured using a PRA radioimmunoassay kit (TFB Inc., Tokyo, Japan). The intra- and interassay coefficients of variations were 3.8% and 6.7%, respectively. PAC was determined by radioimmunoassay using the SPAC-S aldosterone kit (TFB Inc.). The intra- and interassay coefficients of variations were 4.7% and 4.5%, respectively. Blood samples were obtained in the sitting position between 8:00 and 9:00 AM. Normal reference ranges of PRA and PAC in our study were 0.3 to 2.9 ng/mL/hr and 3 to 16 ng/dL, respectively.
Imaging studies
Further tests including a computed tomography scan of the adrenal gland and adrenal venous sampling (AVS) were carried out to differentiate subtypes in all patients. For the AVS, a cutoff of the cortisol-corrected aldosterone ratio from dominant to non-dominant side more than 4:1 and that from non-dominant side to inferior vena cava less than 1.0 is used to indicate unilateral aldosterone excess [13].
Statistical analyses
All evaluated parameters are expressed as number (%) or mean±SD. The normal distribution of the various parameters was investigated using the Kolmogorov-Smirnov test. Values between groups were compared by the one-way analysis of variance for parametric data and the Kruskall-Wallis test for the nonparametric data. For post hoc analysis, we used the Bonferroni method. Categorical variables was analysed by chi-square tests. Receiver operator characteristic (ROC) analysis was used to compare the diagnostic performance between ARR, ARR post-CCT, and PAC post-CCT, and to determine the optimal cut-off values of PAC post-CCT as a screening and confirmative test for PA. The different ROC curves were compared by the area under the curves (AUC) and by the method of DeLong et al. [14]. The Stata/SE version 13.1 (StataCorp LP, College Station, TX, USA) was used. A P value less than 0.05 was considered statistically significant.
RESULTS
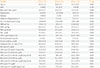
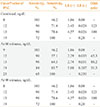
Clinical and biochemical characteristics of the study subjects (n=64) are shown in Table 1. PA including APA and IHA was diagnosed in 51 patients (79.7%) of all subjects. Age, sex, and body mass index were not significantly different between subjects with EH and PA. The prevalence of previous hypertension was higher, but that of diabetes was lower, in patients with PA. At baseline, PRA and PAC were not different between the two groups, but ARR was significantly higher in patients with PA, i.e., APA. The values of PAC and ARR after SIT or CCT were higher in patients with PA, APA, compared to those with EH.
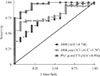
Fig. 2 shows the diagnostic powers of PAC post-CCT, ARR post-CCT, and ARR in PA. The AUC value of PAC post-CCT (AUC=0.956) was significantly higher than that of ARR post-CCT and ARR pre-CCT (AUC=0.797 and 0.748, respectively; P=0.001).
Next, we evaluated the optimal cut-off values of PAC post-CCT for diagnosing PA (Table 2). The sensitivity of CCT was 100% at a PAC of 9 ng/dL at 60 minutes and 8 ng/dL at 90 minutes. When combining PAC post-CCT measured at both 60 and 90 minutes, the diagnostic odds ratio was highest at 13 ng/dL, and the sensitivity and specificity were 98% and 78.6%, respectively. A PAC value of 12 ng/dL post-CCT at 60 or 90 minutes, which was suggested by the Japanese Endocrine Society [4], revealed the same sensitivity but lower specificity (71.4%) compared with a value of 13 ng/dL. A PAC post-CCT of 19 ng/dL had a specificity of 100%, and was deemed an optimal cut-off value for confirmation. We further analyzed values separately at each time point. The diagnostic performance of PAC post-CCT at 60 minutes was lower than that at 90 minutes across all values of PAC post-CCT. The AUCs of PAC post-CCT at 60 and 90 minutes were 0.949 and 0.955, respectively, which was not significantly different (P=0.763). Hence, it is sufficient to measure PAC post-CCT once at 90 minutes instead of twice at 60 and 90 minutes.
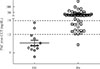
In Fig. 3, PAC post-CCT at 90 minutes in all patients with EH was less than 19 ng/dL, while 36 PA patients (70.6%) had a PAC post-CCT ≥19 ng/dL (APA, n=27; IHA, n=9). Therefore, a PAC post-CCT at 90 minutes ≥19 ng/dL was sufficient to diagnosis PA in these 36 patients without requiring further confirmatory tests such as SIT.
DISCUSSION
The present study showed the expanded diagnostic utility of the CCT by using the cut-off PAC values of <13 ng/dL for exclusion of PA and >19 ng/dL for confirmation of PA in Korean subjects. Moreover, we showed that measuring the cut-off value of PAC post-CCT once at 90 minutes was sufficient to diagnose PA.
Measurement of ARR is simple and convenient, but is well known to be affected by the variability of PRA, diurnal rhythm, postures, diet, phase of menstrual cycle, and medications [15]. Additionally, suppressed PRA falsely increased ARR while maintaining PAC at normal or even low levels, as occurs in socalled "low-renin essential hypertension" and in the elderly. This may interfere with the interpretation of the ARR [15]. The high false-positive rate may be more problematic nowadays because increasing adrenal incidentalomas have raised the number of ARR tests. In the present study, the AUCs of ARR were quite low and the accuracy was only 79.6%. The low accuracy of the screening tests increased the number of confirmatory tests, which were costly and required hospitalization [15]. Like the overnight dexamethasone suppression test for patients with suspected Cushing's syndrome, the CCT can be used subsequent to positive ARR. At a PAC of 13 ng/dL, the sensitivity of CCT was 98%, which is comparable to conventional ARR although with higher specificity. The confirmation test for diagnosing PA is based on the discrimination between the normal and autonomous secretion of aldosterone. In normal renin-aldosterone-angiotensin axis, captopril inhibits the enzymatic conversion of angiotensin to angiotensin II and decreases aldosterone production with increasing renin release due to negative feedback. In contrast, patients with autonomous production of aldosterone had been suggested that captopril has little or no effect on aldosterone secretion or renin production. Therefore, CCT can be used to confirm PA [9]. There were a few studies that compare the diagnostic performance of the CCT with the other confirmatory tests. A prospective head-to-head comparison of the accuracy of CCT and SIT for APA was performed by the Italy study group [6]. They suggested an optimal cut-off value for identifying APA of 13.9 ng/dL for the CCT, which was similar to our result. Intriguingly, the accuracy of the CCT for confirming APA was lower than the SIT in patients with a sodium intake ≤130 mEq per day, but similar for those with a higher salt intake [6]. High sodium diet can increase ARR false-positively by suppressing PRA while captopril can decrease PAC in hypertensive patients without autonomous aldosterone production. Considering the high dietary sodium intake of Korean people [16], the easier-to-perform CCT can be as accurate as the SIT. A Japanese group compared the diagnostic significance of CCT, FUT, and SIT in PA [7]. They reported that the SIT appears to be a suboptimal confirmatory test relative to the CCT and FUT because of low sensitivity. By contrast, Mulatero et al. [10] revealed that the CCT gave misleading results in 36% (4/11) of PA patients using the cut-off value of ARR >30. We demonstrated that the accuracy rate reached 93.7% using the PAC post-CCT instead of ARR. The Japanese Endocrine Society suggested ARR >20 or PAC >12 ng/dL after CCT at 60 or 90 minutes for diagnosing PA [4]. In our study, the diagnostic performance of ARR post-CCT was poor because of the low reliability of the PRA. Therefore, we preferred PAC post-CCT to ARR post-CCT. The previous study also reported that post-CCT ARR cut-off value was variable [5] and less accurate than PAC post-CCT. Regarding the cut-off values, a PAC post-CCT of 13 ng/dL had similar sensitivity but higher specificity compared to 12 ng/dL. These results suggest that PA in patients with a PAC post-CCT <13 ng/dL can be ruled out in outpatient settings without further confirmatory tests. When applying the higher cut-off value of 19 ng/dL, the CCT was sufficient to confirm PA. Some study proposed a PAC post CCT of 8.5 ng/dL as a cutoff value [8]. However, the number of study patients was smaller than our study (n=44 vs. n=64), and the other study reported that the optimal aldosterone cutoff value for identifying APA was 13.9 ng/dL for the CCT [6]. In our data, use of lower cutoff value may include a significant number of false positive PA.
Two-time measurements of PAC post-CCT were suggested, at 60 and 90 minutes [47]. However, this is burdensome for patients. The time-to-peak of oral captopril is more than 30 minutes, and the biological half-life of aldosterone is about 30 minutes while the half-life of PRA is about 15 minutes [11], the duration of elevated PAC post CCT will be longer than that of natural status. According to our data, measurement of PAC once at 90 minutes after captopril administration revealed results similar to the combined measurements at 60 and 90 minutes.
A potential limitation of our study is the small sample size with a high pre-test probability for PA. Adrenal incidentaloma was detected in 60 patients (93.8%) of all subjects by CT. This prevalence profile might affect high ARR. Therefore, our results need to be validated in other separated sample of patients with high ARR. Furthermore, a false negative result with SIT and CCT may also be possible. We controlled the procedure of test to avoid a false negative result so that the odds of failing the two confirmatory tests are extremely low. We defined EH patients if PAC post-SIT was less than 10 ng/dL, but we did not exclude the possibility that patients with 5 <PAC post-SIT <10 ng/dL can be PA patients. The positive criteria for SIT was designated as 10 ng/dL according to the 2008 Endocrine Society Guideline, but the other guidelines suggested the different criteria for PAC post-SIT for PA such as 6 or 11.45 ng/dL [417]. The success rate of AVS in the present study was 94.1%, the subtype classification might be different from the true pathology in three patients. Finally, because we did not determine the reproducibility of the two tests, we cannot rule out the possibility that a test would give different results if repeated.
Taken together, we suggest that subjects with PAC post-CCT at 90 minutes <13 ng/dL are less likely to have PA, while those with PAC post-CCT of ≥13 but <19 ng/dL should undergo a secondary confirmatory test such as an SIT. Subjects with PAC post-CCT at 90 minutes ≥19 ng/dL can be diagnosed with PA in outpatient setting. The results of the present study support that the CCT may be easily performed in outpatient setting subsequently after the positive ARR screening test. The findings in this population need to be corroborated and validated in a separate independent sample of patients with high ARR.
In conclusion, the CCT test may be a reliable post-screening test that can reduce the hospitalization cost or inconvenience for another confirmatory test in subjects with a falsely raised ARR for the diagnosis of PA.
 XML Download