

 PDF
PDF ePub
ePub Citation
 Print
Print


INTRODUCTION
Graves' disease is the most common cause of thyrotoxicosis. The management of Graves' disease generally begins with medical therapy [1]. The mainstay of antithyroid medications are the thionamides, such as methimazole (MMI) and propylthiouracil (PTU), which usually restore euthyroidism in 1 to 3 months [2].
When the medical treatments have failed, surgery or radioactive iodine (RAI) therapy is generally chosen. If the patient is scheduled to undergo surgery, prompt preoperative achievement of the euthyroid state is recommended to minimize potential complications. It usually requires pretreatment with thionamides or inorganic iodine. Adjunctive treatment with β-blockers, corticosteroids, and iopanoic acid may also be used to control symptoms [3]. However, literature reviews have reported a few cases of resistant thyrotoxicosis that did not respond to conventional modalities and required additional management [456].
Cholestyramine is an ion exchange resin which binds to iodothyronines in the intestines, lowering serum thyroid hormone levels when used adjunctively with thionamides and a β-blocker. Studies from the 1990s have shown cholestyramine to be safe and effective, but its use in clinical practice remains limited [78910].
In this paper, we report a case of one patient with thyrotoxicosis who was resistant to nearly all conventional medical therapies but successfully responded to high-dose cholestyramine prior to thyroidectomy.
CASE REPORT
A 40-year-old female patient presented with symptoms of thyrotoxicosis. She was initially diagnosed with hyperthyroidism 6 years ago and treated with antithyroid medication in local clinics for 5 months. Since then, she maintained a euthyroid state without any medication.
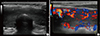
Seven months ago, she started to present thyrotoxic symptoms of fatigue, palpitation, hand tremor, heat intolerance, and dyspnea. Her blood pressure was 110/60 mm Hg, heart rate was 114 beats per minute, and body temperature was 37.2℃. The thyroid gland was diffusely enlarged and firm. Her thyroid function test revealed thyrotoxicosis with elevated thyroid stimulating hormone (TSH) receptor antibody (TRAb); free thyroxine (FT4) of 3.66 ng/dL, triiodothyronine (T3) of 3.65 ng/mL, TSH of 0.08 mIU/L, and TRAb of 4.15 IU/L (normal range: FT4, 0.85 to 1.86; T3, 0.78 to 1.82; TSH, 0.17 to 4.05; TRAb <1.0). The erythrocyte sedimentation rate (ESR) and C-reactive protein (CRP) level were 47 mm/hr and 0.36 mg/dL, respectively (normal range, ESR, 0 to 15; CRP, 0.01 to 0.47). The electrocardiogram showed sinus tachycardia. The thyroid ultrasonography revealed mild enlargement of both thyroid lobes with heterogeneous echogenicity and no discrete nodules (Fig. 1). The thyroid technetium-99m scan showed right thyroid gland enlargement with inhomogeneously increased activity.
Based on clinical presentation and laboratory findings, the diagnosis of thyrotoxicosis due to Graves' disease was made. We started MMI and propranolol, both at 30 mg/day, but thyrotoxic signs and symptoms persisted. Despite 4 months treatment, the FT4 and T3 levels increased to 4.27 ng/dL and 7.34 ng/mL, respectively. We increased the dose of MMI up to 45 mg/day but liver enzymes began to increase. Potassium iodide solution 15 mL/day was added for 2 weeks but that did not decrease thyroid hormone levels.
One month after the MMI dose increase, the aspartate aminotransferase and alanine aminotransferase levels had increased to 58 and 101 IU/L, respectively. Therefore, we changed MMI to PTU 300 mg/day and increased the dose of propranolol up to 120 mg/day. We asked if she was taking her medication during every visit and she said that she was taking it as recommended. Because she was also taking topiramate, tianeptine, etizolam, and itopride for migraines, we considered the possibility of drug interactions or side effects. Rarely has it been reported to the U.S. Food and Drug Adminstration that individuals taking these medications developed hyperthyroidism, and there was nothing in the literature that demonstrated a definitive relationship between them.
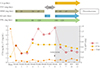
Despite our efforts, there were no effects on hyperthyroidism and her liver enzymes remained elevated (Table 1). During the treatment, she gained about 12 kg body weight and developed generalized edema.
Refractoriness to antithyroid drugs and inorganic iodides along with the subsequent hepatotoxicity led to the decision to schedule a thyroidectomy. She was admitted to our division of endocrinology and metabolism for pre-operative evaluation and close medical management of the thyrotoxicosis. We initially considered glucocorticoids but were not able to use them because she had a history of angioedema, sudden development of skin rash with pruritus, generalized edema, and dyspnea after the intravenous administration of steroids. A few cases in which high-dose cholestyramine successfully treated refractory thyrotoxicosis had been reported [5], so we added 12 g divided three times a day to the patient's treatment regimen.
DISCUSSION
There are several cases in the literature of refractory Graves' disease that resistant to conventional therapies. Refractory cases have shown resistance to high-dose thionamides, β-blockers, and rarely, to iodine [456111213]. In an attempt to restore euthyroidism in refractory cases before surgery, several modalities have been reported. Iopanoic acid, an oral cholecystographic agent, was used for rapid preoperative preparation in a patient with refractory Graves' disease but it is not available in many countries [312]. Lithium increases retention of RAI in the thyroid, and therefore, it is used with RAI rather than thyroidectomy in refractory cases [3611]. High dose of glucocorticoids can be used in management of thyroid crisis and for rapid preoperative preparation of resistant thyrotoxicosis [3]. Lastly, plasmapheresis can be considered as an emergent preoperative management of severe thyrotoxicosis. However, it is an invasive procedure and potential complications such as hypotension, hemolysis, allergic reactions, coagulopathy, vascular injury, and infection must be carefully monitored [313].
Possible mechanisms mediating resistant thyrotoxicosis have been suggested by Li et al. [4] in 1995 are; (1) drug malabsorption, (2) rapid drug metabolism, (3) the presence of antidrug antibodies, (4) impaired intrathyroidal drug accumulation or action, and (5) predominant elevation of T3 rather than T4.
In our patient, resistance to two different thionamides (MMI and PTU) and iodine was observed. Also, propranolol did not improve the symptoms of thyrotoxicosis. Malabsorption was ruled out by clinical and biochemical data. Serum and thyroid MMI levels and the presence of antidrug antibodies were not obtained in this case, but rapid drug metabolism, the existence of antidrug antibodies and impaired accumulation of MMI must be considered as possible reasons for drug resistance.
However, the most probable reason for refractoriness to antithyroid medications in this case is the severity of the hyperthyroidism, particularly high T3 level. Dahlberg et al. [14] found that the failure of carbimazole in the treatment of hyperthyroidism is primarily dependent upon the T3 level. When the T3 level is above 6 ng/mL before treatment, a higher dose of antithyroid drug was needed. Because the increase of liver enzyme was mild in our patient, we could not completely rule out the possibility of uncontrolled thyrotoxicosis as the reason of the liver enzyme abnormality. But we could not administer an unconventionally high-dose of MMI because of the risk of hepatotoxicity. During preparation for surgery, we also had limitation to use of glucocorticoids, because of the possibility of anaphylactic reaction from her past history. Rarely patients with hypersensitivity reactions to corticosteroids were reported [15]. Clinical manifestations of steroid hypersensitivity range from relatively minor reactions such as urticaria to more life-threatening ones, such as bronchospasm and anaphylaxis. Studies have shown that the most common steroids to which people develop hypersensitivity reactions to are hydrocortisone and methylprednisolone. A low dose challenge with oral prednisolone was considered, but the patient refused.
Cholestyramine is an anion exchange resin which binds bile in the gastrointestinal tract to prevent its reabsorption. It is mainly used to lower serum cholesterol and to treat pruritus due to cholestasis. A few rare cases of refractory thyrotoxicosis that were successfully treated with cholestyramine have been reported [516].
Thyroid hormones are metabolized mainly in liver by conjugating to glucuronides and sulphates and enter the enterohepatic circulation by excretion into bile. A fraction of conjugated products are deconjugated in the intestine, and free hormones are reabsorbed.
Cholestyramine has been shown to interfere with the enterohepatic circulation of endogenous thyroid hormones, which is increased in hyperthyroidism. A previous experiment showed that 50 mg of cholestyramine can bind to approximately 3,000 µg of T4 [17].
Several studies have reported that combining cholestyramine with the antithyroid drug and propranolol led to a more rapid reduction in serum thyroid hormone levels compared to only antithyroid drug and propranolol treatment. Solomon et al. [7] conducted a double-blind placebo-controlled cross-over study that included fifteen patients with thyrotoxicosis (14 Graves' disease, 1 toxic adenoma). They gave patients 16 g per day of cholestyramine with MMI, divided four times a day. Rapid decline in all thyroid hormone levels was observed during the first 2 weeks. Levels of thyroid-stimulating immunoglobulins and hyrotrophin-binding inhibitory immunoglobulins remained unaffected. A study done by Mercado et al. [8] were similar to Solomon et al. [7]'s. The study involved 30 patients with newly diagnosed Graves' disease. Cholestyramine dose was 12 g divided three times a day. In addition, new clinical trials that have combined PTU and low dose of cholestyramine have been reported with positive results [910].
Despite the prior reports of therapeutic efficacy of cholestyramine, its use in clinical practice remains limited. At first, despite prior studies showed a rapid decline in thyroid hormone for about initial 4 weeks, a long-term efficacy of this drug appears to be unclear: cholestyramine had no immune-modulating effects, compared to other antithyroid drugs of which the use showed decreasing concentration of TSH receptor antibody [7]. In our experience, the dramatic effect of cholestryamine seems to be confined only in short period. Second, cholestyramine is uncomfortable to eat because only available as a powder form, and of its bad taste and gastrointestinal side effect. Since the introduction of statins, cholestyramine has only a minor role for lipid-lowering drug and its clinical use has been decreased. Lastly, the lack of promotion from a pharmaceutical company might be another reason.
The known primary side effects of cholestyramine are constipation and abdominal discomfort. However, the aforementioned studies showed only a few minor complications like hyperdefecation and bad taste. Our patient also tolerated cholestyramine without any complications. Remarkably, in Tsai's study [9], which only included Chinese individuals, no one experienced constipation. They suggested high fiber diets in Chinese culture as the possible reason. Also considering that the main gastrointestinal symptom of thyrotoxicosis is diarrhea, constipation as a side effect may be favorable.
In conclusion, we recommend cholestyramine as an effective adjunctive therapy for preoperative preparation in patients with severe Graves' disease that is resistant to conventional therapies or when a failure of conventional therapies is expected due to high T3 level. Considering the safety profiles and dramatic effects of cholestyramine, it may be the primary option for treatment of severe thyrotoxic patients, along with antithyroid drugs. Also in contrast to antithyroid drugs which inhibit thyroid hormone synthesis and are used for the hyperthyroidism, cholestyramine could be an option for treatment of any condition with excessive thyroid hormone levels, including thyroiditis and factitious thyroid hormone disorder [16].

 XML Download