

 PDF
PDF ePub
ePub Citation
 Print
Print


INTRODUCTION
Obesity has been well-known as a risk factor for heart failure [1]. An echocardiographic study has reported an association between diastolic dysfunction and obesity, even in the absence of systolic heart failure [2]. Diastolic dysfunction has been considered the earliest sign of heart failure related to obesity [34]. Genetic experimental models have been proposed to determine the pathophysiological association between obesity and cardiac dysfunction [5]. Although genetic factors may contribute to an individual becoming obese, the high-fat diet (HFD) or over-nutrition model may promote a positive energy balance that leads to obesity and may also be an experimental model that reproduces many characteristics of human metabolism for obesity and other metabolic disorders, such as diabetic cardiomyopathy [567]. Metabolic imbalances caused by HFD-induced obesity have a complex impact on the myocardium. Mitochondria are highly vulnerable to oxidative damage [89]. The mitochondrial DNA (mtDNA) copy number, which reflects the content of mtDNA, is associated with mitochondrial biogenesis [10]. Mitochondrial dysfunction is expressed as a decrease in mtDNA copy number [10]. Mitochondrial dysfunction induced by oxidative stress is thought to contribute to the development of cardiometabolic diseases [11]. Reduced adenosine triphosphate (ATP) production from mitochondrial oxidative phosphorylation (OXPHOS) and increased oxidative stress are major triggers of senescence dysfunction for long-lived postmitotic cells, such as neurons, cardiac myocytes, skeletal muscle fibers and retinal pigment epithelium [11]. Twenty weeks of HFD feeding resulted in diastolic dysfunction, myocardial lipid accumulation associated with oxidative stress and fibrosis, and disturbed calcium homeostasis without systolic dysfunction and impairment of cardiac energetics in a mouse model of HFD-induced obesity [12]. High-fat, high-sucrose diet for 8 months in a mouse model caused increased oxidative stress in cardiac mitochondria associated with decreased ATP synthesis and decreased complex II activity of mitochondrial OXPHOS [13]. In another previous study, a high-sugar and HFD for 4 to 8 weeks impaired cardiac systolic and diastolic function in mice [14]. The results of HFD-induced changes in cardiac structure and function can vary in the mouse model.
The purpose of this study was to investigate whether cardiac dysfunction develops when rats are fed with a HFD for 10 weeks; additionally, we sought to investigate the association between mitochondrial abnormalities, ATP levels and cardiac dysfunction.
METHODS
Rats and housing
All animal procedures were approved by the Eulji University Institutional Animal Care and Use Committee at Daejeon, Republic of Korea. Wistar rats (6 weeks old, 150 g) were obtained from Harlan (Madison, WI, USA) and were housed at the Animal Care Center of Eulji University at Daejeon under controlled conditions. Briefly, rats were housed in pairs at 23℃±1℃ with a 12-hour light/12-hour dark cycle. The rats were given free access to water and rat chow for the 'standard diet (SD)' (10 kcal% fat, Harlan Laboratories), or 'HFD' (45 kcal% fat, Harlan Laboratories). The rats were randomly assigned to two groups, SD or HFD, which consisted of six rats each. The initial, weekly and final body weights were recorded. After 10 weeks, all rats (n=12) were fasted overnight and decapitated under CO2 anesthesia. The blood samples and tissues of all rats were collected. Serum was stored at -80℃ until further analysis. After blood collection, the heart, appendages, epicardial and perigonadal fat, and soleus muscle were snap-frozen and stored at -80℃ until further analysis. Some of the heart and soleus muscles were fixed for histologic examination or transmission electron microscopy (TEM).
Histology and transmission electron microscopy
Transverse sections of the left ventricle (LV) apex in the each group were fixed in 10% buffered formalin (Sigma Aldrich Co., St. Louis, MO, USA) and embedded in paraffin. Sections (1 µm thick) were cut from tissue blocks and stained with hematoxylin and eosin. For TEM, LV myocardial tissues were fixed in 2.5% paraformaldehyde-glutaraldehyde at 4℃ for 24 hours and then washed with 0.1 M phosphate-buffered solution at 4℃. After washing twice, the tissues were post-fixed with 1% OsO4-buffered solution (pH 7.4) for 90 minutes. Samples were dehydrated with serial ethanol and propylene oxide treatment and embedded in Poly/EM Bed812 embedding medium. The resin was then polymerized in a vacuum drying oven at 60℃ for 48 hours. Tissues were sectioned using an EM Ultra-microtome LKB-2088 and stained with 1% toluidine blue, and ultra-thin sections were then double-stained with uranyl acetate and lead citrate and examined with a Hitachi H-7600 electron microscope (Hitachi, Tokyo, Japan).
Echocardiographic analysis
Standard echocardiography measurements and calculations were performed as previously reported [15]. Before echocardiography, all rats were anesthetized with an intraperitoneal injection of a mixture of ketamine (50 mg/kg) and xylazine (1 mg/kg). The chest wall hair of all rats was carefully removed, and a warm ultrasound transmission gel was gently applied to ensure optimal image quality. Echocardiography was performed using a high-frequency 15-MHz linear transducer (Entos CL15-7, Philips Medical Systems, Bothell, WA, USA) connected to an ultrasound system (ATL-HDI5000, Philips Medical Systems). Imaging was performed at a 60° sector angle with 3 cm imaging depth. M-mode and 2-dimensional echocardiographic images were obtained from the short-axis, long-axis and 4 chamber views. All LV traces were manually measured with a caliper by the same observer according to the leading-edge method of the American Society of Echocardiography [16]. Measurements were recorded as the mean of at least three consecutive cardiac cycles. Left ventricle end-diastolic dimension (LVEDD), posterior wall thickness in diastole and anterior wall thickness in diastole were measured at the maximum diastolic dimension. Left ventricle end-systolic dimension (LVESD), posterior wall thickness in systole and anterior wall thickness in systole were also measured at the maximum anterior motion of the posterior wall. In addition, the early peak transmitral flow velocity (E) to late peak transmitral flow velocity (A) ratio (E/A) and the deceleration time (DT) were also measured. The LV ejection fraction (EF) and fractional shortening (FS) were calculated using the following formulas [17]:
Real-time polymerase chain reaction
A total of 10 to 30 mg of myocardium was homogenized using a polytron homogenizer (Fisher Scientific Inc., Pittsburgh, PA, USA). The homogenate was stored for 5 minutes to permit the complete dissociation of nucleoprotein complexes. Homogenates containing 0.2 mL of chloroform per 1 mL of TRI Reagent (Molecular Research Center Inc., Cincinnati, OH, USA) were vigorously shaken for 15 seconds. Total RNA from the homogenates was isolated according to the manufacturer's instructions. Equal amounts of total RNA were reverse transcribed into cDNA using the iScript cDNA Synthesis Kit (Bio-Rad, Hercules, CA, USA). The primer sequences are listed in Table 1. Real-time polymerase chain reaction (PCR) was performed in a 20 µL reaction mixture containing 1 µg cDNA, 10 pmo forward primer, 10 pmol reverse primer, and 10 µL SYBR Green Supermix (Bio-Rad) using a CFX96 Real-Time PCR Detection System (Bio-Rad Laboratories [Singapore] Pte Ltd., Singapore). The threshold cycle (Ct) values for each target mRNA were normalized to that of glyceraldehyde-3-phosphate dehydrogenase (GAPDH) mRNA, and the relative expression level of each target gene was calculated using CFX Manager software version 1.5 (Bio-Rad).
Western blot analysis
Myocardial tissue samples of approximately 10 to 30 mg were homogenized in Pro-Prep Protein Extraction Solution (Intron Biotechnology, Seoul, Korea) with protease (Roche Applied Science, Penzberg, Germany) and phosphatase inhibitors (Roche Applied Science). The homogenates were incubated for 20 to 30 minutes on ice and centrifuged at 13,000 rpm (4℃) for 5 minutes, and the supernatant was then transferred to a fresh 1.5 mL tube. Lysates were run in a 4% to 20% MP TGX Precast Gel (Bio-Rad) and transferred to polyvinylidene difluoride membranes using a wet vertical Criterion Blotter (Bio-Rad). Membranes were blocked with 5% skim milk in 50 mmol/L Tris-HCl (pH 7.4) and 150 mmol/L NaCl (Tris-buffered saline [TBS]) and then incubated overnight at 4℃ with antibodies. All antibody dilutions were made in 0.5% bovine serum albumin and 0.1% sodium azide-TBS-Tween 20. After washing, membranes were incubated with the appropriate horseradish peroxidase-conjugated secondary antibody for 1 hour. Antibody signals were developed using an enhanced chemiluminescence detection system (Millipore, Billerica, MA, USA). Anti-Akt (a serine/threonine kinase, protein kinase B; 1:500), anti-phospho-Akt (1:500), and anti-GAPDH (1:1,000) antibodies were obtained from Cell Signaling (Beverly, MA, USA), anti-peroxisome proliferator-activated receptor γ co-activator-1α (PGC1α; 1:1,000) was obtained from Abcam (Cambridge, UK), and nicotinamide adenine dinucleotide (NADH) dehydrogenase 1 β subcomplex 5 (NDUFB5; 1:1,000) was obtained from Novus Biologicals (Littleton, CO, USA). Secondary antibodies (goat anti-rabbit immunoglobulin G) were obtained from Cell Signaling.
Oxidative stress marker measurement
Of the numerous types of oxidative DNA damage markers, we measured the level of 8-hydroxydeoxyguanosine (8-OHdG) as a ubiquitous marker for oxidative stress. Genomic DNA from myocardial tissue was extracted using a DNeasy Blood & Tissue Kit (Qiagen Inc., Valencia, CA, USA). The levels of the oxidative DNA damage marker 8-OHdG were assayed spectrophotometrically according to the manufacturer's instructions (Oxiselect Oxidative DNA Damage ELISA Kit, Cell Biolabs Inc., San Diego, CA, USA). The optical density of 8-OHdG as measured at 450 nm (OD 450 nm) decreases with increased reactive oxygen species (ROS) damage.
Mitochondrial copy number measurement
mtDNA in myocardial tissue was extracted from 10 mg myocardium using a DNeasy Blood &Tissue Kit (Qiagen Inc.). A total of 20 ng of genomic DNA was used. The relative mtDNA copy number was measured by real-time PCR in an iCycler thermal cycler with SYBR Green Supermix (Bio-Rad) and gene-specific oligonucleotides for β-globin and the mitochondrial gene NADH dehydrogenase subunit 1 (ND1), which are listed in Table 1. After denaturation at 95℃ for 5 minutes, genomic DNA samples were treated at 95℃ for 1 second, 56℃ for 6 seconds, and 72℃ for 18 seconds for 40 cycles. The following equation was used to quantify the mtDNA copy number relative to β-globin: relative copy number=2ΔCt (ΔCt=Ctβ-globin-CtND1). Relative expression was calculated using CFX Manager software version 1.5 (Bio-Rad).
Measurement of ATP level
Myocardial tissue samples (approximately 10 mg each), which were obtained through snap-frozen, were homogenized in mammalian cell ATP lysis solution (Perkin-Elmer, Waltham, MA, USA). The homogenates were centrifuged at 12,000 rpm (4℃) for 5 minutes, and the supernatants were transferred to fresh 1.5 mL tubes. Then, the ATPlite assay procedure was performed according to the manufacturer's instructions (Perkin-Elmer). The luminescence emitted from the ATP-dependent luciferase reaction was measured with a 2030 Multi-label Reader (Perkin-Elmer).
Statistical analysis
Baseline and echocardiographic characteristics are expressed as mean±standard deviations. Other characteristics are expressed as mean±standard errors. Comparisons between two groups were analyzed using the independent Student t test. Statistical analyses were performed using SPSS version 15.0 (SPSS Inc., Chicago, IL, USA), and P values <0.05 were considered statistically significant.
RESULTS
Baseline characteristics
As shown in Table 2, the body weight of the HFD group (349.56±22.72 g) was significantly higher (P<0.01) than that of the SD group (286.83±14.91 g), and the weight of the perigonadal fat of the HFD group (13.15±6.38 g) was significantly higher (P<0.05) than that of the SD group (6.96±3.02 g). For the heart tissue weights, the epicardial fat weight of the HFD group (0.71±0.15 g) was significantly higher (P<0.05) than that of the SD group (0.37±0.29 g). However, the myocardium tissue weight of the HFD group (0.84±0.07 g) was not different compared to that of the SD group (0.81±0.12 g), and the appendage weight was not different between the two groups.
Comparison of echocardiographic parameters
In the echocardiogram shown in Table 3, Fig. 1, the thickness of the left ventricular posterior wall at diastole was significantly increased (P<0.05) in the HFD group (0.22±0.03 cm) compared with the SD group (0.17±0.01 cm). The EF, which is representative of LV systolic function in both groups, was within the normal range (80.43%±3.45% in the SD group vs. 70.66%±8.10% in the HFD group, P=0.022); however, for diastolic function, the level of E in the HFD group was significantly decreased (68.66±9.81 cm/sec in the SD group vs. 33.00±13.17 cm/sec in the HFD group, P<0.001), the level of A in the HFD group (52.33±11.87 cm/sec in the SD group vs. 83.00±14.05 cm/sec in the HFD group, P<0.001) was significantly increased, the E/A ratio in the HFD group was significantly decreased (1.33±0.13 in SD group vs. 0.42±0.22 in HFD group, P<0.001), and DT was significantly increased in the HFD group (436.66±0.18 ms, P<0.001) compared with the SD group (126.66±18.07 ms).
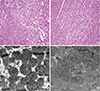
Histomorphologic and transmission electron microscopic images
The myocardial histology appeared to be similar in the two groups and demonstrated no striking morphological abnormalities after HFD (Fig. 2A, B). An electron microscopic image of the myocardium in the SD group appeared to be more electron-dense (Fig. 2C, D). Generally, electron microscopy images demonstrated no striking morphological abnormalities after HFD (Fig. 2C, D).
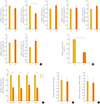
mRNA expression levels of a subset of OXPHOS subunits and PGC1α
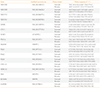
Cluster analysis grouped the regulated genes into five clusters based on three principal components in the mitochondria; however, the genes in complex I were highly focused on the manipulations, as previously reported [18]. We sought to confirm the expression of these OXPHOS genes by real-time quantitative PCR. As shown in Fig. 3A, the mRNA expression levels of the OXPHOS genes NDUFB5 was significantly (P<0.05) decreased, similar to the levels in skeletal muscle [19], compared with the complex I genes, including NDUFB3, NDUFB5, NADH dehydrogenase (ubiquinone) flavoprotein 1 (NDUFV1), and NADH dehydrogenase (ubiquinone) Fe-S protein 1 (NDUFS1). The mRNA expression levels of NDUFB 3, NDUFV1, and NDUFS1 of complex I, the succinate dehydrogenase complex, subunit B (SDHB) of complex II, cytochrome C1 (CYC1) of complex III, and surfeit 1 (SURF1) of complex IV were not different between the SD and HFD groups. In addition, the level of PGC1α expression associated with mitochondrial biogenesis [1920] was significantly (P<0.05) reduced by 54% in the HFD compared with the SD group (Fig. 3B).
mRNA expression levels of antioxidant enzymes
Increases in oxidative stress are coupled with reduced anti-oxidant species [21]. As shown in Fig. 3C, in the HFD group, the expression levels of anti-oxidant enzymes, such as Mn superoxide dismutase (SOD) and peroxiredoxins (Prdx) 1, 2, and 5, were significantly decreased compared with those in the SD group.
Myocardial collagen and calcium cycling protein mRNA expression
The mRNA expression levels of collagen type I, α 1 (COL1A1), which mostly determines myocardial wall stiffness [22] were not increased in the HFD group compared with those in the SD group (Fig. 3D). The mRNA expression level of sarcoendoplasmic reticulum calcium transport ATPase 2 (SERCA2), which is known to modulate calcium handling and cycling in myocardial contractility [22], was not decreased with HFD compared with that in the SD group (Fig. 3E).
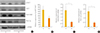
Western blot analysis
In Western blot analysis (Fig. 4), GAPDH expression appeared to be similar between the two groups, and phosphorylated AKT expression was decreased by 49% in the HFD group compared with the SD group (P=0.078). The protein expression of NDUFB5 (complex I), one of the OXPHOS subunits in the mitochondria, was 70% lower in the HFD group compared with the SD group, a difference that was significant (P<0.05). PGC1α protein expression was 73% lower in the HFD group compared with the SD group, a difference that was also significant (P<0.05).
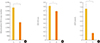
Mitochondrial DNA copy number
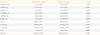
mtDNA copy number, which reflects the content of mtDNA and is associated with mitochondrial biogenesis, was 46% lower in the HFD group compared with the SD group, a difference that was significant (P<0.05) (Fig. 5A).
Oxidative stress damage markers
To investigate whether oxidative stress was increased in the HFD group, we measured oxidative stress damage markers such as 8-OHdG. There was a significant (P<0.05) increase in the expression of the oxidative stress damage marker 8-OHdG (16% decrease by optical density OD 450 nm) in the HFD group compared with the SD group (Fig. 5B).
Myocardial ATP level
The level of myocardial ATP 78% lower in the HFD group compared with the SD group, a difference that was significant (P<0.05) (Fig. 5C).
DISCUSSION
In our study, 10 week-HFD-induced obesity rats demonstrated diastolic dysfunction accompanied by increased ROS damage, decreased mtDNA content, decreased PGC1α, a decrease in the complex I, NDUFB5 of OXPHOS subunit, and decreased ATP levels without striking structural changes in the myocardium. These results were different to those data derived from 20 weeks [12] or 8 months [13] of HFD feeding in a mouse model, and also, were different to an impaired systolic and diastolic function in high-sugar and HFD fed mice for 4 to 8 weeks [14]. Further researches are required to define the mechanism of the difference. Our data suggest that increased ROS damage and mitochondrial abnormality resulting in a reduction in ATP may potentially contribute to early contractile dysfunction without striking myocardial structural changes.
Obesity is well known to be related to cardiac morbidities such as coronary artery disease, hypertension, atrial fibrillation, and heart failure [4]. HFD-induced or over-nutrition-induced obesity may be a precipitating factor for the development of cardiomyopathy, which has been confirmed in several animal models [212324], and in this study, HFD-induced obesity with excess body weight also demonstrated a decreased E/A ratio and increased DT for diastolic early filling (Table 3, Fig. 1), suggesting diastolic dysfunction compared with the SD group, as previously reported [5621].
Thus, a constant fuel supply is required. Mitochondria are responsible for meeting the constant energy demands of the postnatal mammalian heart via oxidative phosphorylation (gene set as OXPHOS), and consistently, cardiac myocytes contain numerous mitochondria [2325]. During metabolic dysfunction in obesity-associated cardiomyopathy, gene targets are associated with mitochondrial genes such as OXPHOS and PGC1α, a key metabolic regulator that coordinates the gene expression of pathways involved in mitochondrial biogenesis and respiratory function. PGC1α regulates the expression of several genes involved in the electron transport chain, mitochondrial biogenesis, and fatty acid β-oxidation and glucose oxidative metabolism [1926]. PGC1α acts as a crucial regulator of oxidative metabolism in cardiovascular disease [27]. PGC1α-null mice develop heart failure due to reduced mitochondrial fatty acid OXPHOS in mitochondrial energy metabolism [27]. In addition, ATP synthesis obtained during maximal respiration in permeabilized myocardial fibers was reduced in PGC1α-deficient mice. Previous studies demonstrating changes in mitochondrial number, structure and function in skeletal muscle in obesity support the direct association between obesity and mitochondrial dysfunction in the myocardium [2829]. In our study, structural changes in myocardial mitochondria in HFD-induced obese rats with diastolic dysfunction were not significantly different compared with SD non-obese rats without diastolic dysfunction. However, there was a decreased mtDNA copy number, reduced PGC1α expression, reduced expression of the OXPHOS subunit NDUFB5 and increased expression of oxidative stress markers, which were subsequently, associated with decreased ATP levels. ATP is essential for myocardial relaxation and contraction, and the decreased myocardial ATP level might be considered an earlier step than changes in the myocardial structure in HFD-induced obese rats. In the present study, systolic dysfunction didn't develop, although there was a decrease in myocardial ATP levels. We hypothesized that the development of systolic dysfunction might need additional myocardial abnormality beyond ATP supply in HFD-induced obese rats.
In previous studies, decreased calcium handling has been examined as an earlier change in diastolic dysfunction [624]. In our study, there was no decrease in SERCA2 expression, suggesting no influence on the early stages of diastolic dysfunction. The composition of collagen, which mainly determines the myocardial interstitial matrix of the LV, is important for the mechanical properties of LV walls [30]. In this viewpoint, increased collagen 1 correlates with LV stiffness, which occurs during diastolic dysfunction [31]. In our study, there was no decrease in SERCA2 and no increase in collagen 1, but there was mitochondrial dysfunction and a decreased ATP level.
Oxidative stress has been known to be another axis driving pathological processes in heart failure and metabolic syndrome [432]. Deficiencies in the anti-oxidant defense system may contribute to oxidative damage [33]. Previous data have indicated that mitochondria are an important source of ROS and have implications for the cardiovascular system [34]. In our study, the ROS damage marker 8-OHdG was significantly increased in the HFD group, and the expression levels of anti-oxidant enzymes such as SOD and Prdx 1, 2, and 5 in the HFD group were significantly decreased compared with those in the SD group, which is in agreement with previous reports [3435]. In other previous researches [363738], protein levels of antioxidant enzymes in HFD group were significantly decreased compared with those in the SD group. So, we think our results are consistent with these previous researches [363738], although we didn't examine the protein levels of antioxidant enzymes. This study suggests that myocardium in HFD-induced obese rats may be particularly susceptible to ROS damage and mitochondrial dysfunction subsequent to decreased ATP levels. We speculate that in the initial stage of HFD-induced obesity, mitochondrial dysfunction and decreased ATP levels without myocardial structural changes develop, resulting in diastolic dysfunction and evolving abnormalities over time, including increased interstitial fibrosis, hypertrophy and systolic dysfunction, eventually leading to heart failure. HFD-induced mitochondrial abnormality in myocardium might be one of systemic changes associated with HFD regardless of tissue.
This study has some limitations. First, there were no different micro- or macro-morphologic changes between the two groups. Second, activities of complexes of OXPHOS subunits and mitochondrial respiratory capacities were not examined. Thus we didn't use the term, mitochondrial dysfunction. Instead, we used the term, mitochondrial abnormality. Third, the underlying mechanisms that were responsible for the decreased expression of PGC1α and OXPHOS subunit NDUFB5, as well as the decreased mtDNA copy number, were not elucidated in this study. Fourth, we didn't evaluate the levels of important metabolic parameters or markers associated with mitochondrial function in other tissues such as adipose tissue, muscle and liver.
In conclusion, this study suggests that a decreased expression of OXPHOS subunit NDUFB5 in complex I and PGC1α, as well as a decreased mtDNA copy number in the myocardia of 10 weeks-HFD-induced obese rats (consequently resulting in a reduction in ATP), may potentially contribute to diastolic dysfunction in early stage cardiomyopathy without striking myocardial structural changes.


 XML Download