

 PDF
PDF ePub
ePub Citation
 Print
Print


INTRODUCTION
Helicobacter pylori infection is a common worldwide infectious disease affecting more than half of the world's population [1]. Current data indicate that the prevalence of H. pylori infection in type 2 diabetic patients is higher than the nondiabetics, suggesting a possible association between H. pylori infection and development of type 2 diabetes [23]. Furthermore, some investigations propose that H. pylori infection may be a major contributing factor for development of insulin resistance, subclinical inflammation, long-term diabetes complications, and cardiovascular risk factors, but there is limited data supporting this controversial association [456]. H. pylori infection may affect pancreatic β-cell function and insulin metabolism through induction of proinflammatory cytokines and oxidative stress [7]; H. pylori infection could also disturb lipid and lipoprotein metabolism and lead to increase serum levels of triglycerides, total cholesterol, low density lipoprotein cholesterol (LDL-C), apolipoprotein B (apo B), as well as decrease in apolipoprotein A and high density lipoprotein cholesterol (HDL-C) levels [8910]. Although it is suggested that these undesirable abnormalities induced by H. pylori may increase the risk of cardiovascular disease especially in diabetic patients, but data available on this hypothesis are controversial [1112]. Whereas it seems to be important, far too little attention has been paid to the quantitative association between H. pylori bacterial load and cardiometabolic risk factors.
Abnormal levels of pepsinogen I (PGI) and pepsinogen II (PGII; two zymogen forms of pepsin originated from mucosal cell of stomach) observed in H. pylori infection and chronic gastric inflammation, have been also observed in relation to some metabolic disorders [131415]; however, any potential associations of these biomarkers of H. pylori-induced chronic gastritis, especially PGI to PGII ratio, with glucose homeostasis parameters and cardiometabolic risk factors in diabetic patients have been less investigated.
In this cross-sectional study we aimed to investigate the association of the severity of active H. pylori infection (H. pylori stool antigen [HpSAg] levels), PGI to PGII ratio with insulin resistance, subclinical inflammation, lipids and lipid peroxidation, blood pressure (BP), anthropometric measurements and lipid accumulation product (LAP) in H. pylori infected type 2 diabetic patients.
METHODS
Study population
This study was conducted from April 2012 to January 2013. Men and women, aged 25 to 60 years, clinically diagnosed with type 2 diabetes for at least the past 1 year were recruited from the Iran Diabetes Society and the Endocrine Clinic of Taleghani Medical Center. Three hundred sixty-two type 2 diabetic patients were assessed for eligibility, and some potential participants were deemed ineligible if they had been treated in the past for H. pylori, consumed proton pump inhibitors, H2 receptor antagonists, bismuth compounds or antibiotics during the previous 4 weeks, had previous gastric surgery, had severe illness, gestation, or lactation and if they used estrogen, or any other supplements. Finally, 191 patients delivered stool samples for assessment of H. pylori infection.
Informed written consents were obtained from all participants. Ethics approval for the trial was obtained from Ethical Committee of the Research Institute for Endocrine Sciences of the Shahid Beheshti University of Medical Sciences.
H. pylori stool antigen test
Stool specimens were taken and tested using the HpSAg enzyme-linked immunosorbent assay (ELISA) kits (ACON laboratories Inc., San Diego, CA, USA), according to the manufacturers' instructions. H. pylori infection status of the participants was determined as follows: HpSAg ≥0.055 µg/mL as positive, 0.045≤HpSAg<0.055 µg/mL as borderline, and HpSAg<0.045 µg/mL as negative. The inter- and intra-assay coefficients of variation of the assay were both <5%.
Demographics, anthropometrics, and clinical measurement
Trained interviewers collected information using pretested questionnaires. Information on age, educational levels, medical history and medications, duration of diabetes, and oral antidiabetic drugs, were collected.
Anthropometric measurements were assessed by trained staff. Weight was measured to the nearest 100 g using digital scales, while the subjects were minimally clothed, without shoes. Height was measured to the nearest 0.5 cm, in a standing position without shoes, using a tape meter. Waist circumference (WC) was measured to the nearest 0.1 cm, midway between the lower border of the ribs and the iliac crest at the widest portion, over light clothing, using a soft measuring tape, without any pressure to the body. Body mass index was calculated as weight (kg) divided by square of the height (m2).
For BP measurements, after a 15-minute rest in the sitting position, two measurements of BP were taken, on the right arm, using a standardized mercury sphygmomanometer; the mean of the two measurements was considered as the participant's BP.
Biochemical measurement
For all biochemical measurements, 12-hour fasting blood samples were collected into tubes containing 0.1% ethylenediaminetetraacetic acid and were centrifuged at 4℃ and 500 g for 10 minutes to separate plasma. PGI/PGII ratio was measured as a reliable serological biomarker of H. pylori-induced gastric inflammation; PGI/PGII ratio <3 was considered as atrophic gastritis [13]. To determine PGI and PGII concentrations, ELISA kits (Cusabio Biotech, Wuhan, China) were used. Inter- and intra-assay coefficients of variation of the assays were both 5.8%.
Fasting serum glucose was measured by the enzymatic colorimetric method using a glucose oxidation kit (Pars Azmun Co., Tehran, Iran). Serum insulin concentrations were measured using ELISA kit (Mercodia, Uppsala, Sweden). The inter- and intra-assay coefficients of variation of the assay were both <5%. Insulin resistance was estimated using the homeostasis model assessment of insulin resistance (HOMA-IR) index, which is defined as fasting plasma insulin (mU/L) times the fasting plasma glucose (mmol/L) divided by 22.5.
Serum total cholesterol and triglyceride levels were measured by enzymatic colorimetric analysis with cholesterol esterase and cholesterol oxidase and glycerol phosphate oxidase, respectively (Pars Azmun Co.). HDL-C was measured by the immunoturbidimetry method after precipitation of apo B containing lipoproteins with phosphotungstic acid (Pars Azmun Co.). LDL-C was calculated from serum total cholesterol, triglycerides, and HDL-C, according to the Friedewald equation. Serum high-sensitive C-reactive protein (hs-CRP) (pg/mL) concentration was measured by using ELISA kit (Diagnostics Biochem Canada Inc., Dorchester, ON, Canada). Serum malondialdehyde (MAD) was measured spectrophotometrically by the thiobarbituric acid assay kit (Cayman Chemical Inc., Ann Arbor, MI, USA). Inter- and intra-assay coefficients of variations of all assays were <5%. LAP index, a novel central lipid accumulation and predictor of metabolic syndrome, cardiovascular disease, was calculated as follows: in men [WC (cm)-65]×[triglycerides (mmol/L)], and in women [WC (cm)-58]×[triglycerides (mmol/L)] [1516].
Statistical methods
The Kolmogorov-Smirnov test was used to test for normal distribution; if the variable was not normally distributed, logarithm of the skewed variable was entered in the models. The PGI/PGII ratio were categorized into quartiles; cardiometabolic risk factors of the patients were compared across the quartile categories using the general linear models with adjustment of age, gender, antidiabetic and antilipidemic drugs, and duration of diabetes. To clarify the association of HpSAg levels, pepsinogen levels, and PGI/PGII ratio with cardiometabolic risk factors, the two-tailed Pearson correlation test was used. To better estimate the association of PGI/PGII ratio and cardiometabolic risk factors, linear or logarithmic regression curve estimation models were also conducted and significant associations were presented as plots. Statistical analysis was performed with SPSS version 16.0 (SPSS Inc., Chicago, IL, USA). A P<0.05 was considered significant.
RESULTS
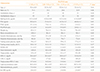
Among 191 type 2 diabetic patients assessed for H. pylori infection, using the stool antigen test, 56.6% (108) were diagnosed as H. pylori positive, 5.2% were borderline and 38.2% were negative. Of the 108 H. pylori positive patients, 84 patients agreed to complete the study for biochemical assessment, clinical and anthropometric measurements. The mean age of participants was 54±10 years, and 44% were men. Mean HpSAg levels and PGI/PGII ratio were 0.24±0.23 µg/mL and 9.9±9.0, respectively. The range of PGI/PGII ratio was <3.08, 3.08 to 5.94, 5.95 to 15.55, and >15.55 in the 1st, 2nd, 3rd, and 4th, respectively; the range of PGI/PGII ratio in the first quartile was accordant with the cutoff point of gastric atrophy. Table 1 presents the characteristics, and the biochemical measurements, BP and anthropometric values of the participants across quartile categories of PGI/PGII ratio. A significant decreasing trend of HpSAg levels was observed across increasing PGI/PGII ratio. Participants in the lowest, compared to the highest, quartile category of PGI/PGII ratio had higher weight (85±3.5 kg vs. 78±4.5 kg) and WC (105±3 cm vs. 98±3 cm); systolic and diastolic BP also was nonsignificantly higher in patients with lower PGI/PGII ratio. No significant differences were observed in serum fasting glucose, insulin and HOMA-IR across quartile categories of PGI/PGII ratio. Serum triglyceride levels decreased (135±15 mg/dL vs. 92±20 mg/dL, in first and fourth quartiles respectively, P=0.06) and HDL-C levels significantly increased (28.6±0.7 mg/dL vs. 32.0±0.9 mg/dL, in first and fourth quartiles respectively, P=0.01) across increasing trend of PGI/PGII ratio. Triglycerides/HDL-C ratio also significantly decreased (4.7±0.6 mg/dL vs. 2.9±0.7 mg/dL, in first and fourth quartiles respectively, P=0.01) across quartile categories of PGI/PGII ratio. Serum levels of MAD and hs-CRP statistically were similar across quartile categories of PGI/PGII ratio.
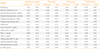
A significant correlation between HpSAg levels with PGI (r=0.24, P<0.05) was observed. Person correlation coefficients of HpSAg levels, serum pepsinogens and PGI/PGII ratio with cardiometabolic risk factors are presented in Table 2. Weight and WC were positively correlated with HpSAg levels and PGII, and were negatively correlated with PGI/PGII ratio. Serum PGI and PGI/PGII ratio were negatively correlated with both systolic and diastolic BP, fasting serum insulin, and hs-CRP. A significant positive association between PGI and PGI/PGII ratio with HDL-C, and a negative association between PGII and HDL-C were observed. Serum triglyceride levels were significantly correlated with PGII (r=0.27, P<0.01) and PGI/PGII ratio (r=-0.26, P<0.01). Triglyceride to HDL-C ratio also was positively correlated with PGII and negatively correlated PGI/PGII ratio. There is a considerable association between LAP index and HpSAg levels (r=0.21, P<0.05), PGII (r=0.34, P<0.01), and PGI/PGII ratio (r=-0.29, P<0.01).
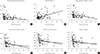
Curve estimation plots are presented in Fig. 1. A significant linear association of PGI/PGII ratio with serum triglycerides (β=-0.24, P<0.05), serum HDL-C (β=0.43, P<0.01), and triglycerides/HDL-C ratio (β=-0.28, P<0.05) was observed. A significant logarithmic association was also observed between the PGI/PGII ratio and LAP (β=-0.31, P<0.05), WC (β=-0.30, P<0.05), and body weight (β=-0.26, P<0.05).
DISCUSSION
The results of this cross-sectional study on type 2 diabetic patients with active H. pylori infection provided some evidence for possible association of HpSAg levels, serological biomarkers of gastric inflammation and cardiometabolic risk factors.
In this study, HpSAg levels were negatively correlated with PGI/PGII ratio, body weight and WC (Table 2). Serum levels of PGI were negatively associated with systolic and diastolic BP, fasting serum insulin, hs-CRP, and positively correlated with HDL-C levels. Higher levels of serum PGII were related to higher weight and WC, fasting serum glucose, triglyceride levels, triglycerides to HDL-C ratio, and lower levels of HDL-C (Table 2). Moreover, PGI/PGII ratio was negatively correlated with anthropometric measures, BP, glucose homeostasis parameters as well as atherosclerotic lipid and lipoprotein parameters and subclinical systemic inflammation (Table 2, Fig. 1).
Among both the invasive and non-invasive methods that have been developed to confirm H. pylori infection, stool antigen test is considered as an accurate, noninvasive, and cost-effective method to diagnose active infection [171819]; moreover, the levels of HpSAg quantitatively has been correlated with the bacterial load of H. pylori in the stomach, mucosal inflammation and severity of gastritis [20]. However there is evidence that H. pylori infection is associated with cardiometabolic risk factors and development of insulin resistance and cardiovascular disease [2122], but it is unclear whether severity of H. pylori bacterial load could quantitatively affect glucose and lipid homeostasis, systemic inflammation or oxidative stress. In the current study, H. pylori infection was quantitatively associated with higher weight and WC. The association between H. pylori infection and anthropometric measures is not yet well established and both weight loss and weight gain outcomes were reported after H. pylori eradication [2324]. Recent investigations have been proposed that circulating ghrelin (a peptide originated from stomach and regulator of food intake, body fat, and insulin secretion) may be a possible link between H. pylori and body weight [2526]. There is no consensus in this regard; however a systematic review and meta-analysis of the current data recently showed that H. pylori infected subjects compared to noninfected had lower levels of circulating ghrelin [27]. On the other hand, there is evidence showing that acylated ghrelin (active ghrelin)/total ghrelin levels had higher in patients with chronic atrophic gastritis [28]; acylated ghrelin could induce food intake, increase adiposity and fat gain, as well as insulin resistance [29]. Higher levels of acylated and lower levels of deacylated ghrelin have been reported in obese and diabetic patients, and fasting levels of acylated ghrelin was positively correlated with fat mass [30]. Based on this evidence, the association of HpSAg levels and anthropometric measures observed in the current study could partly be explained. Another important finding of this study was a positive correlation of HpSAg levels and LAP index; this index is a simple and accurate clinical indicator of metabolic syndrome and insulin resistance as well as predictor of cardiovascular disease [1631]. Our finding are in agreement with investigations reporting that chronic H. pylori infection could induce insulin resistance, and disturb both glucose and lipid homeostasis, and metabolism of adipocytokines [2232].
Recently, serum PG levels have been more considered as noninvasive biomarkers of H. pylori-induced gastric inflammation, and decreased serum PGI to PGII ratio has been used as an indicator of gastric mucosal atrophy [13]; moreover, a correlation between PGs levels and PGI to PGII ratio with metabolic parameters has been shown [1415]. In this study, patients with higher levels of HpSAg also had higher levels of PGII, lower levels of PGI to PGII ratio. Previously, comparison between H. pylori positive and negative patients showed that the levels of PGI and PGI/II ratio were lower and PGII was higher in H. pylori infected patients [33].
In the current study, higher levels of triglycerides, triglycerides/HDL-C ratio, central lipid accumulation, and lower HDL-C level were observed in patients categorized as atrophic gastritis (PGI/PGII ratio <3). PGI/PGII ratio had also considerable correlation with cardiometabolic parameters and systemic inflammatory markers. Another important finding of this study was a negative correlation of two independent predictors of cardiovascular disease, triglyceride to HDL-C ratio and lipid accumulation index, with PGI/PGII ratio. Data regarding the association of PGI/PGII ratio and metabolic and anthropometric parameters are limited; contrary to with our results, two previous studies reported that PGI to PGII ratio was positively correlated with glucose, triacylglycerol, and uric acid levels in healthy subjects, as well as urinary albumin excretion in diabetic patients [1415]. Surprisingly, in a recent cross-sectional analysis of 819 apparently healthy men, PGI/PGII ratio were related to both low body weight and obesity [34]; considering this point of view, it is thought that the association of PG levels with cardiometabolic risk factors is more complicated, and may affected bysome conditions such as active H. pylori infection, obesity, or diabetes.
To the best of our knowledge this study is the first investigation on the correlation of H. pylori bacterial load and serological bacterial load with cardiometabolic risk factor in diabetic patients. Some limitations that should be considered in the current study are the cross-sectional setting and low sample sizes. Moreover, some important variables including cardiovascular complications in diabetic patients have not been evaluated in this study. Further studies with large sample size and the assessment of other cardiovascular risk factors are needed to confirm the relationship observed and related mechanisms.
In conclusion, the results of this study showed that higher H. pylori bacterial load was associated with higher body weight and abdominal fat accumulation, and lower PGI/PGII ratio, as indicator of H. pylori-induced gastric inflammation, was associated with higher levels of cardiometabolic risk factors in H. pylori infected type 2 diabetic patients.
 XML Download