

 PDF
PDF ePub
ePub Citation
 Print
Print


INTRODUCTION
Mitochondrial dysfunction causes both insulin resistance and β-cell dysfunction, leading to glucose intolerance and diabetes [12]. In skeletal muscle, decreased mitochondrial fatty acid oxidation results in increased amounts of cytosolic long-chain acyl CoA and diacylglycerol, which leads to increased serine phosphorylation of insulin receptor substrate-1, thereby eliciting insulin resistance [3]. In pancreatic β-cells, decreased ATP generation due to impaired mitochondrial oxidative phosphorylation is linked to impaired insulin secretion, via a mechanism that reduces closure of the ATP-sensitive potassium channel [4]. In this regard, measures to improve mitochondrial function, either in the skeletal muscle or in the pancreatic β-cell, should be effective for treating diabetes.
Glucagon-like peptide-1 (GLP-1) is a gut-derived incretin hormone that stimulates insulin secretion and suppresses glucagon secretion, inhibits gastric emptying, and reduces appetite and food intake [56]. Because of its efficacy in lowering blood glucose by stimulating β-cell insulin secretion, GLP-1 analogues and incretin enhancers (i.e., dipeptidyl peptidase-4 inhibitors) are widely used in the clinic to treat diabetes [7]. Interestingly, it was reported that GLP-1 stimulates ATP synthesis in pancreatic MIN6 β-cells [8], suggesting a new mechanism for improving β-cell function using GLP-1 therapy. In this study, we examined the effect of GLP-1 and its analogue on mitochondrial biogenesis in pancreatic β-cells.
METHODS
INS-1 cell culture and glucose-stimulated insulin secretion
INS-1 rat insulinoma cells (passages 28 to 34) were grown in monolayer culture in RPMI-1640 supplemented with 10% fetal bovine serum, 10 mM 4-(2-hydroxyethyl)-1-piperazineethanesulfonic acid, 2 mM L-glutamine, 1 mM sodium pyruvate, 50 µM β-mercaptoethanol, 100 U/mL penicillin, and 100 µg/mL streptomycin, at 37℃ in a humidified atmosphere of 5% CO2 and 95% air. For glucose-stimulated insulin secretion, INS-1 cells were seeded in 24-well plates and treated with 0, 100, or 200 nM GLP-1 (Sigma-Aldrich, St. Louis, MO, USA) for 48 hours. Cells were then washed twice with Kreb's ringer bicarbonate buffer (KRBB), incubated in KRBB at 37℃ for 1 hour, and exposed to 5 or 10 mM glucose for 1 hour. The culture supernatant was collected and stored at -20℃ until assayed for insulin concentration using enzyme-linked immunosorbent assay (ELISA, Linco Research, St. Charles, MO, USA).
Measurement of mitochondrial mass and membrane potential
INS-1 cells (1×10⁵) were seeded in six-well plates and incubated with GLP-1 (100 to 400 nM) or exendin-4 (100 to 200 nM, Sigma-Aldrich) for 48 hours. Mitochondrial mass was measured by 10-n-nonyl-acridine orange staining (NAO, Invitrogen, Carlsbad, CA, USA), and the mitochondrial membrane potential was measured using tetramethylrhodamine ethyl ester perchlorate (TMRE, Invitrogen) with a FACSCalibur flow cytometer (Becton Dickinson, Franklin Lakes, NJ, USA), following the manufacturers' protocols. The strength of NAO or TMRE staining was expressed as the mean fluorescence intensity (MFI).
Transmission electron microscopy
INS-1 cells (5×10⁵) were seeded in 60-mm plates and incubated with exendin-4 for 48 hours. Cells were collected and processed for electron microscopy using standard methods. Ten random pictures were taken at a magnification of ×5,000, using an H-7100 transmission electron microscope (Hitachi, Tokyo, Japan). The volume density of mitochondria was estimated using a point-counting method in a blinded fashion by two separate examiners. For each set of 10 pictures, the average volume density was calculated, and the mean of 10 values was used to estimate the volume density for each individual cell.
Measurement of oxygen consumption
Oxygen consumption was measured using a high-resolution respirometer (Oxygraph-2k, Oroboros Instruments, Innsbruck, Austria) according to the manufacturer's instructions. A suspension of INS-1 cells at 1×10⁶ cells/mL in a 2-mL volume of culture medium (RPMI-1640) was measured in the respirometer at 37℃.
Reverse transcriptase polymerase chain reaction
Total RNA from cells was prepared using an RNeasy Mini kit (Qiagen, Valencia, CA, USA). cDNA was obtained from 1 µg RNA using random hexamers and avian myeloblastosis virus reverse transcriptase (Invitrogen). Samples were amplified in a Gene Amp polymerase chain reaction (PCR) system 9600 (Perkin-Elmer/Cetus, Norwalk, CT, USA). Digital images of the PCR products separated on 1% agarose gels were analyzed using a Gel Doc 2000 (BioRad Inc., Richmond, CA, USA).
RESULTS
Effects of GLP-1 and its analogue on insulin secretion and mitochondrial biogenesis in INS-1 cells
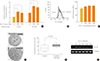
GLP-1 treatment of INS-1 cells for 48 hours enhanced glucose-stimulated insulin secretion (Fig. 1A) and mitochondrial mass (Fig. 1B, C). GLP-1 at 100, 200, and 400 nM increased NAO staining intensity to 121.64±11.54, 127.48±15.47, and 126.94±12.89 MFI, respectively (n=10) (Fig. 1C). A similar result was obtained using another mitochondrial dye (MitoTracker Green, data not shown). When mitochondrial density was measured using a point-counting method on transmission electron microscopy images, the mitochondria/cytosol area ratio was significantly increased by 100 nM exendin-4, from 7.60±3.12% to 10.53±2.70% (Fig. 1D, E). The expression of proliferator-activated receptor-gamma coactivator 1 α (PGC1α), a key regulator of mitochondrial biogenesis, was increased dramatically after 1 hour of GLP-1 treatment; after 4 hours, expression decreased gradually but remained above control levels for up to 48 hours of treatment (Fig. 1F).
Effects of GLP-1 and exendin-4 on mitochondrial function in INS-1 cells
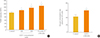
The intensity of TMRE staining, which is an indicator of the strength of the mitochondrial membrane potential, was increased in INS-1 cells treated with GLP-1 or exendin-4 for 48 hours (Fig. 2A). In line with this finding, the oxygen consumption rate of cells treated with GLP-1 for 48 hours exhibited a significant increase relative to controls (56.3±2.8 µmol/sec/105 cells vs. 42.0±1.6 µmol/sec/105 cells, P<0.05) (Fig. 2B).
DISCUSSION
Because mitochondrial oxidative phosphorylation is crucial to glucose-stimulated insulin secretion [4], the mechanisms mediating the effects of GLP-1 on mitochondria in pancreatic β-cells deserve further study. One possible mechanism is the mobilization of calcium into the mitochondrial matrix after GLP-1 treatment, which has been reported to enhance mitochondrial function in pancreatic MIN6 β-cells, possibly through the activation of several Krebs cycle dehydrogenases [8] and also in vascular smooth muscle cells [9]. Interestingly, in hepatocytes, nonapeptide fragments of GLP-1 (i.e., GLP-1 [28-36] amide) were shown to enter the cytoplasm rapidly and target mitochondria in a GLP-1 receptor-independent manner, and to be associated with decreased gluconeogenesis and oxidative stress [10]. However, in the present study, exendin-4 also exhibited a stimulatory effect on mitochondrial mass and function. Therefore, signaling through the GLP-1 receptor appears to be sufficient to increase both mitochondrial mass and function in pancreatic β-cells.
We report here a novel effect of GLP-1 on mitochondrial biogenesis and function. In INS-1 cells, GLP-1 and exendin-4 treatment triggered an increase in mitochondrial mass, mitochondrial density, mitochondrial membrane potential, and oxygen consumption. These increases were accompanied by up-regulation of PGC1α, a key regulator of mitochondrial biogenesis [11]. However, further studies are needed to characterize the time-course of GLP-1-stimulated biogenesis, as it relates to that of PGC1α expression. In conclusion, the present study provides evidence for a new mechanism of action of GLP-1 in pancreatic β-cells, linking mitochondrial biogenesis and function to glucose-stimulated insulin secretion.
 XML Download