Abstract
Results
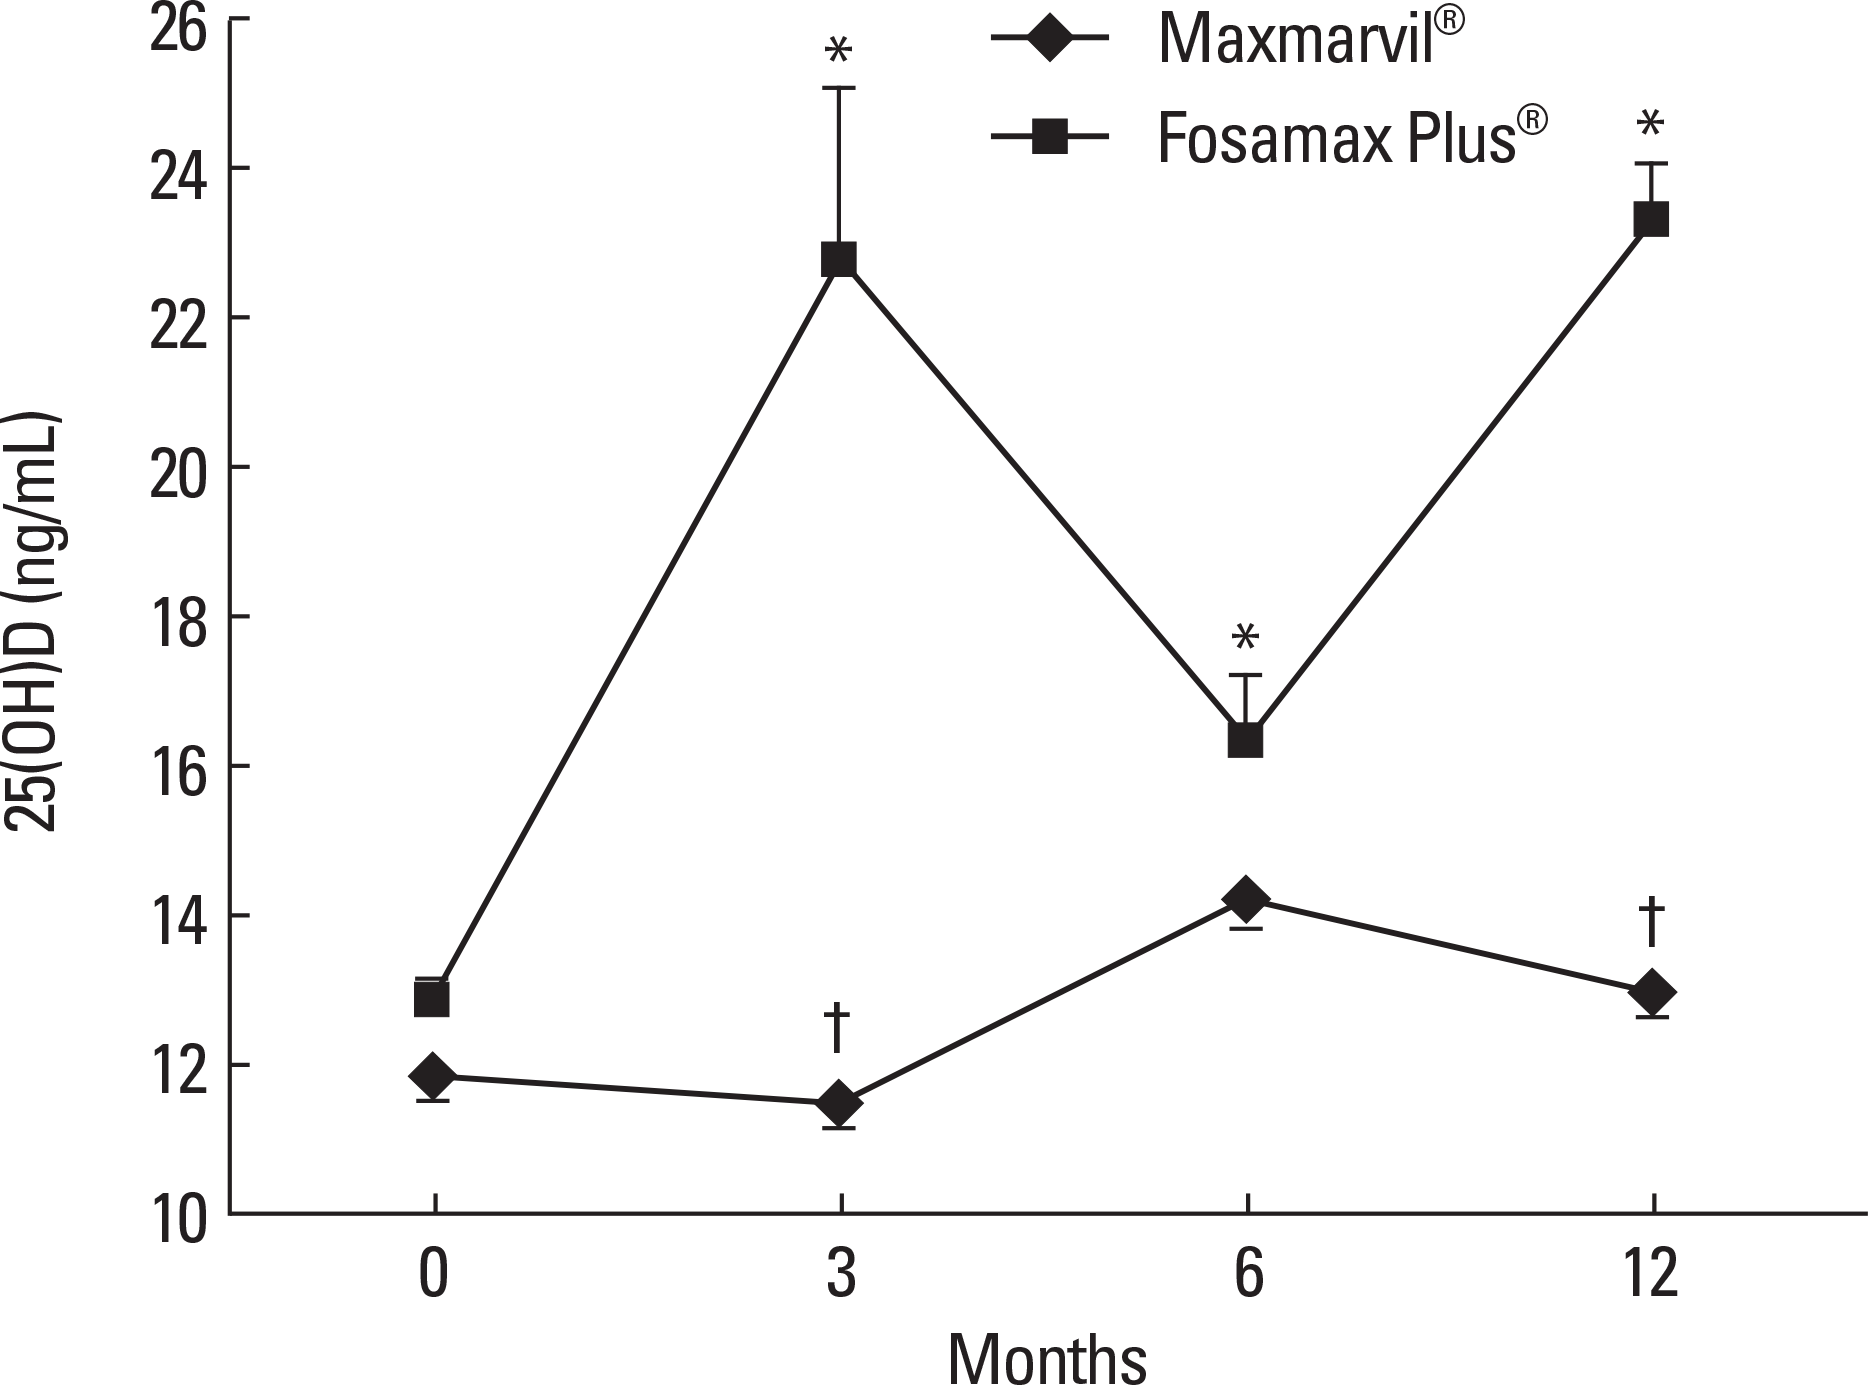
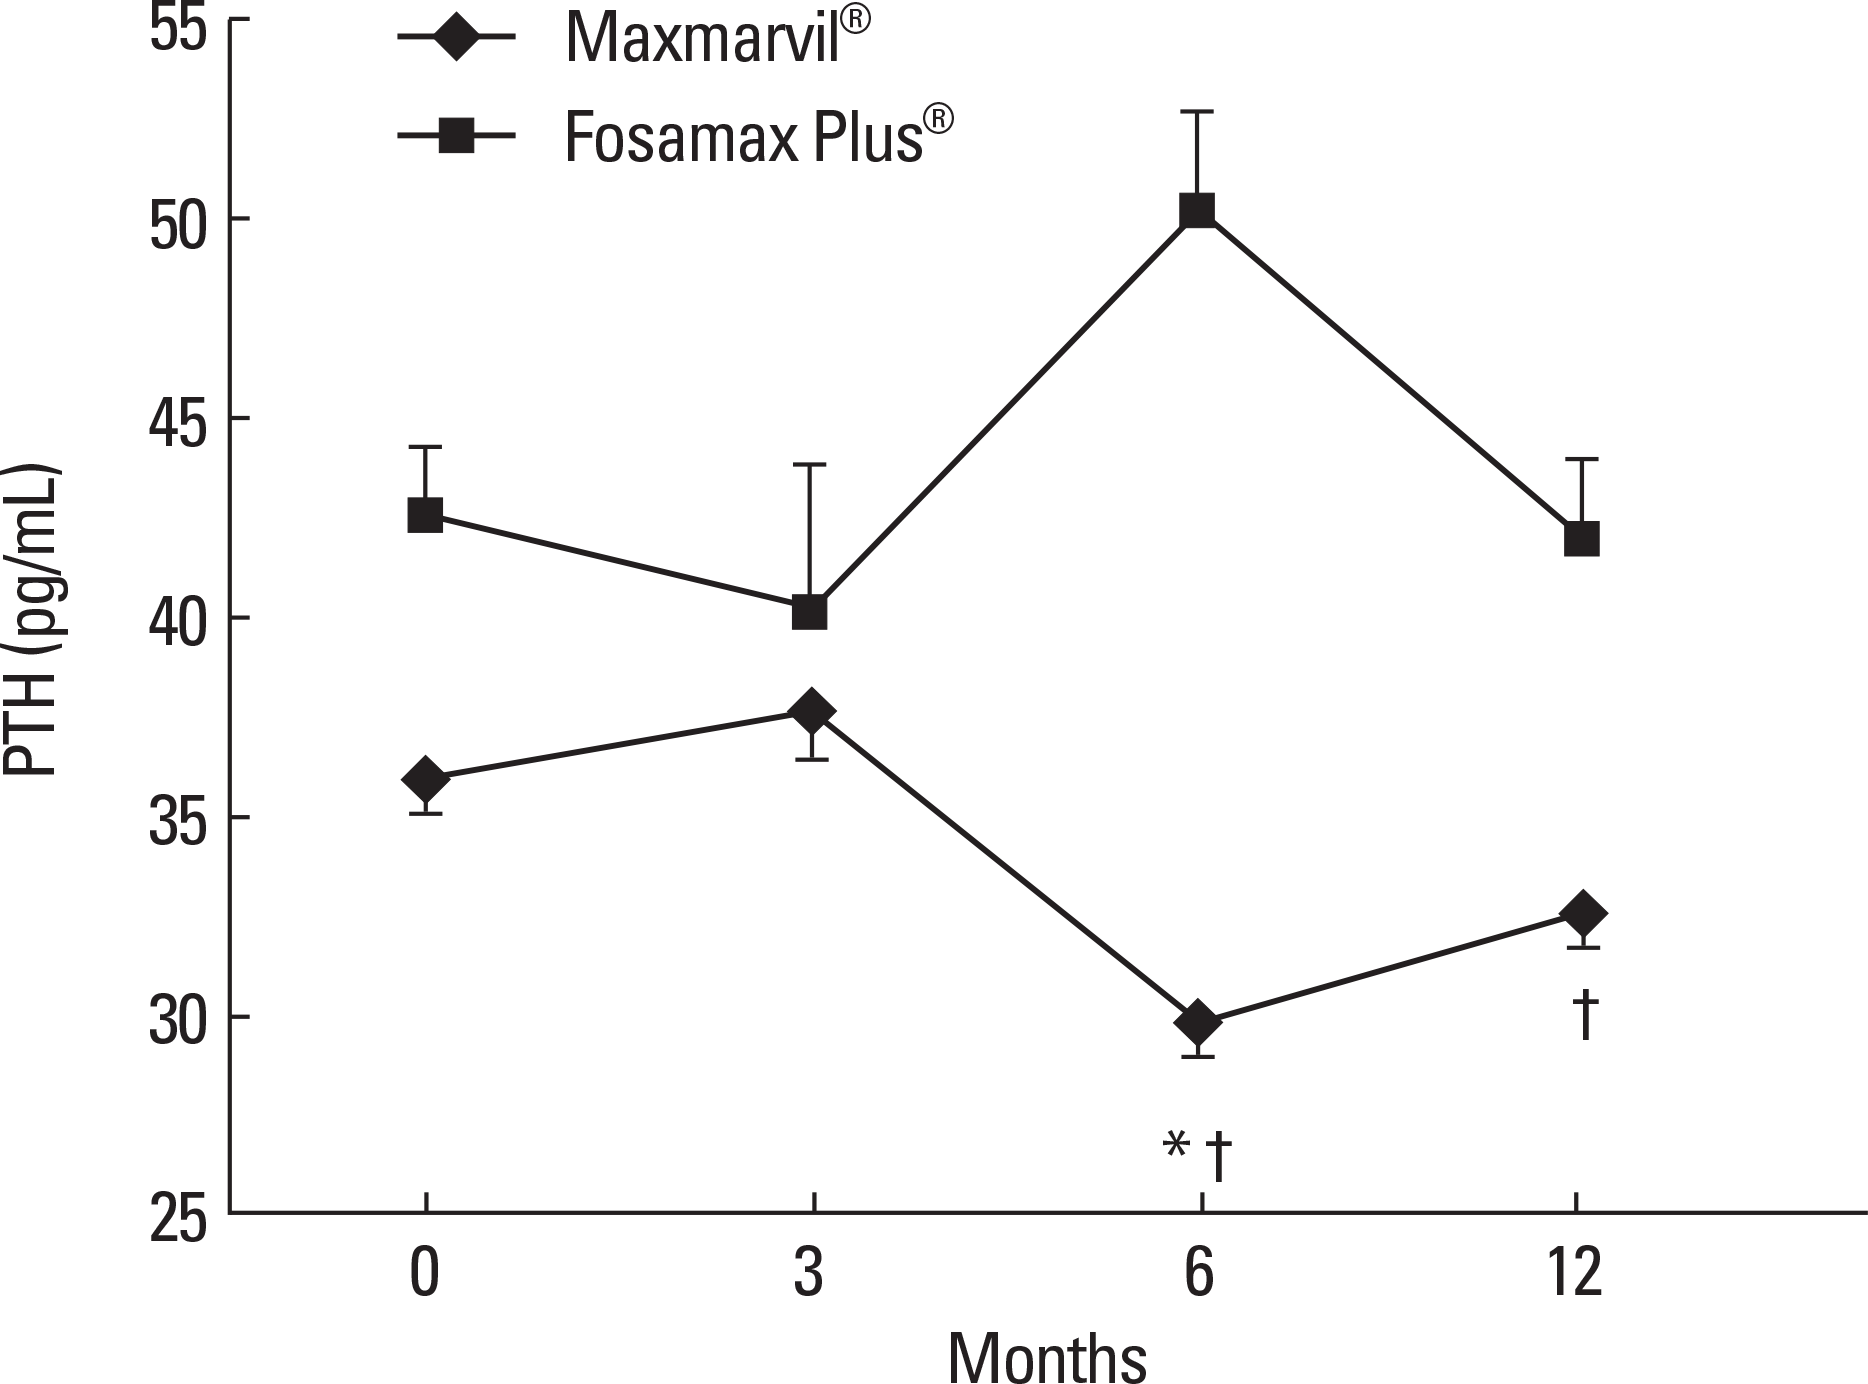
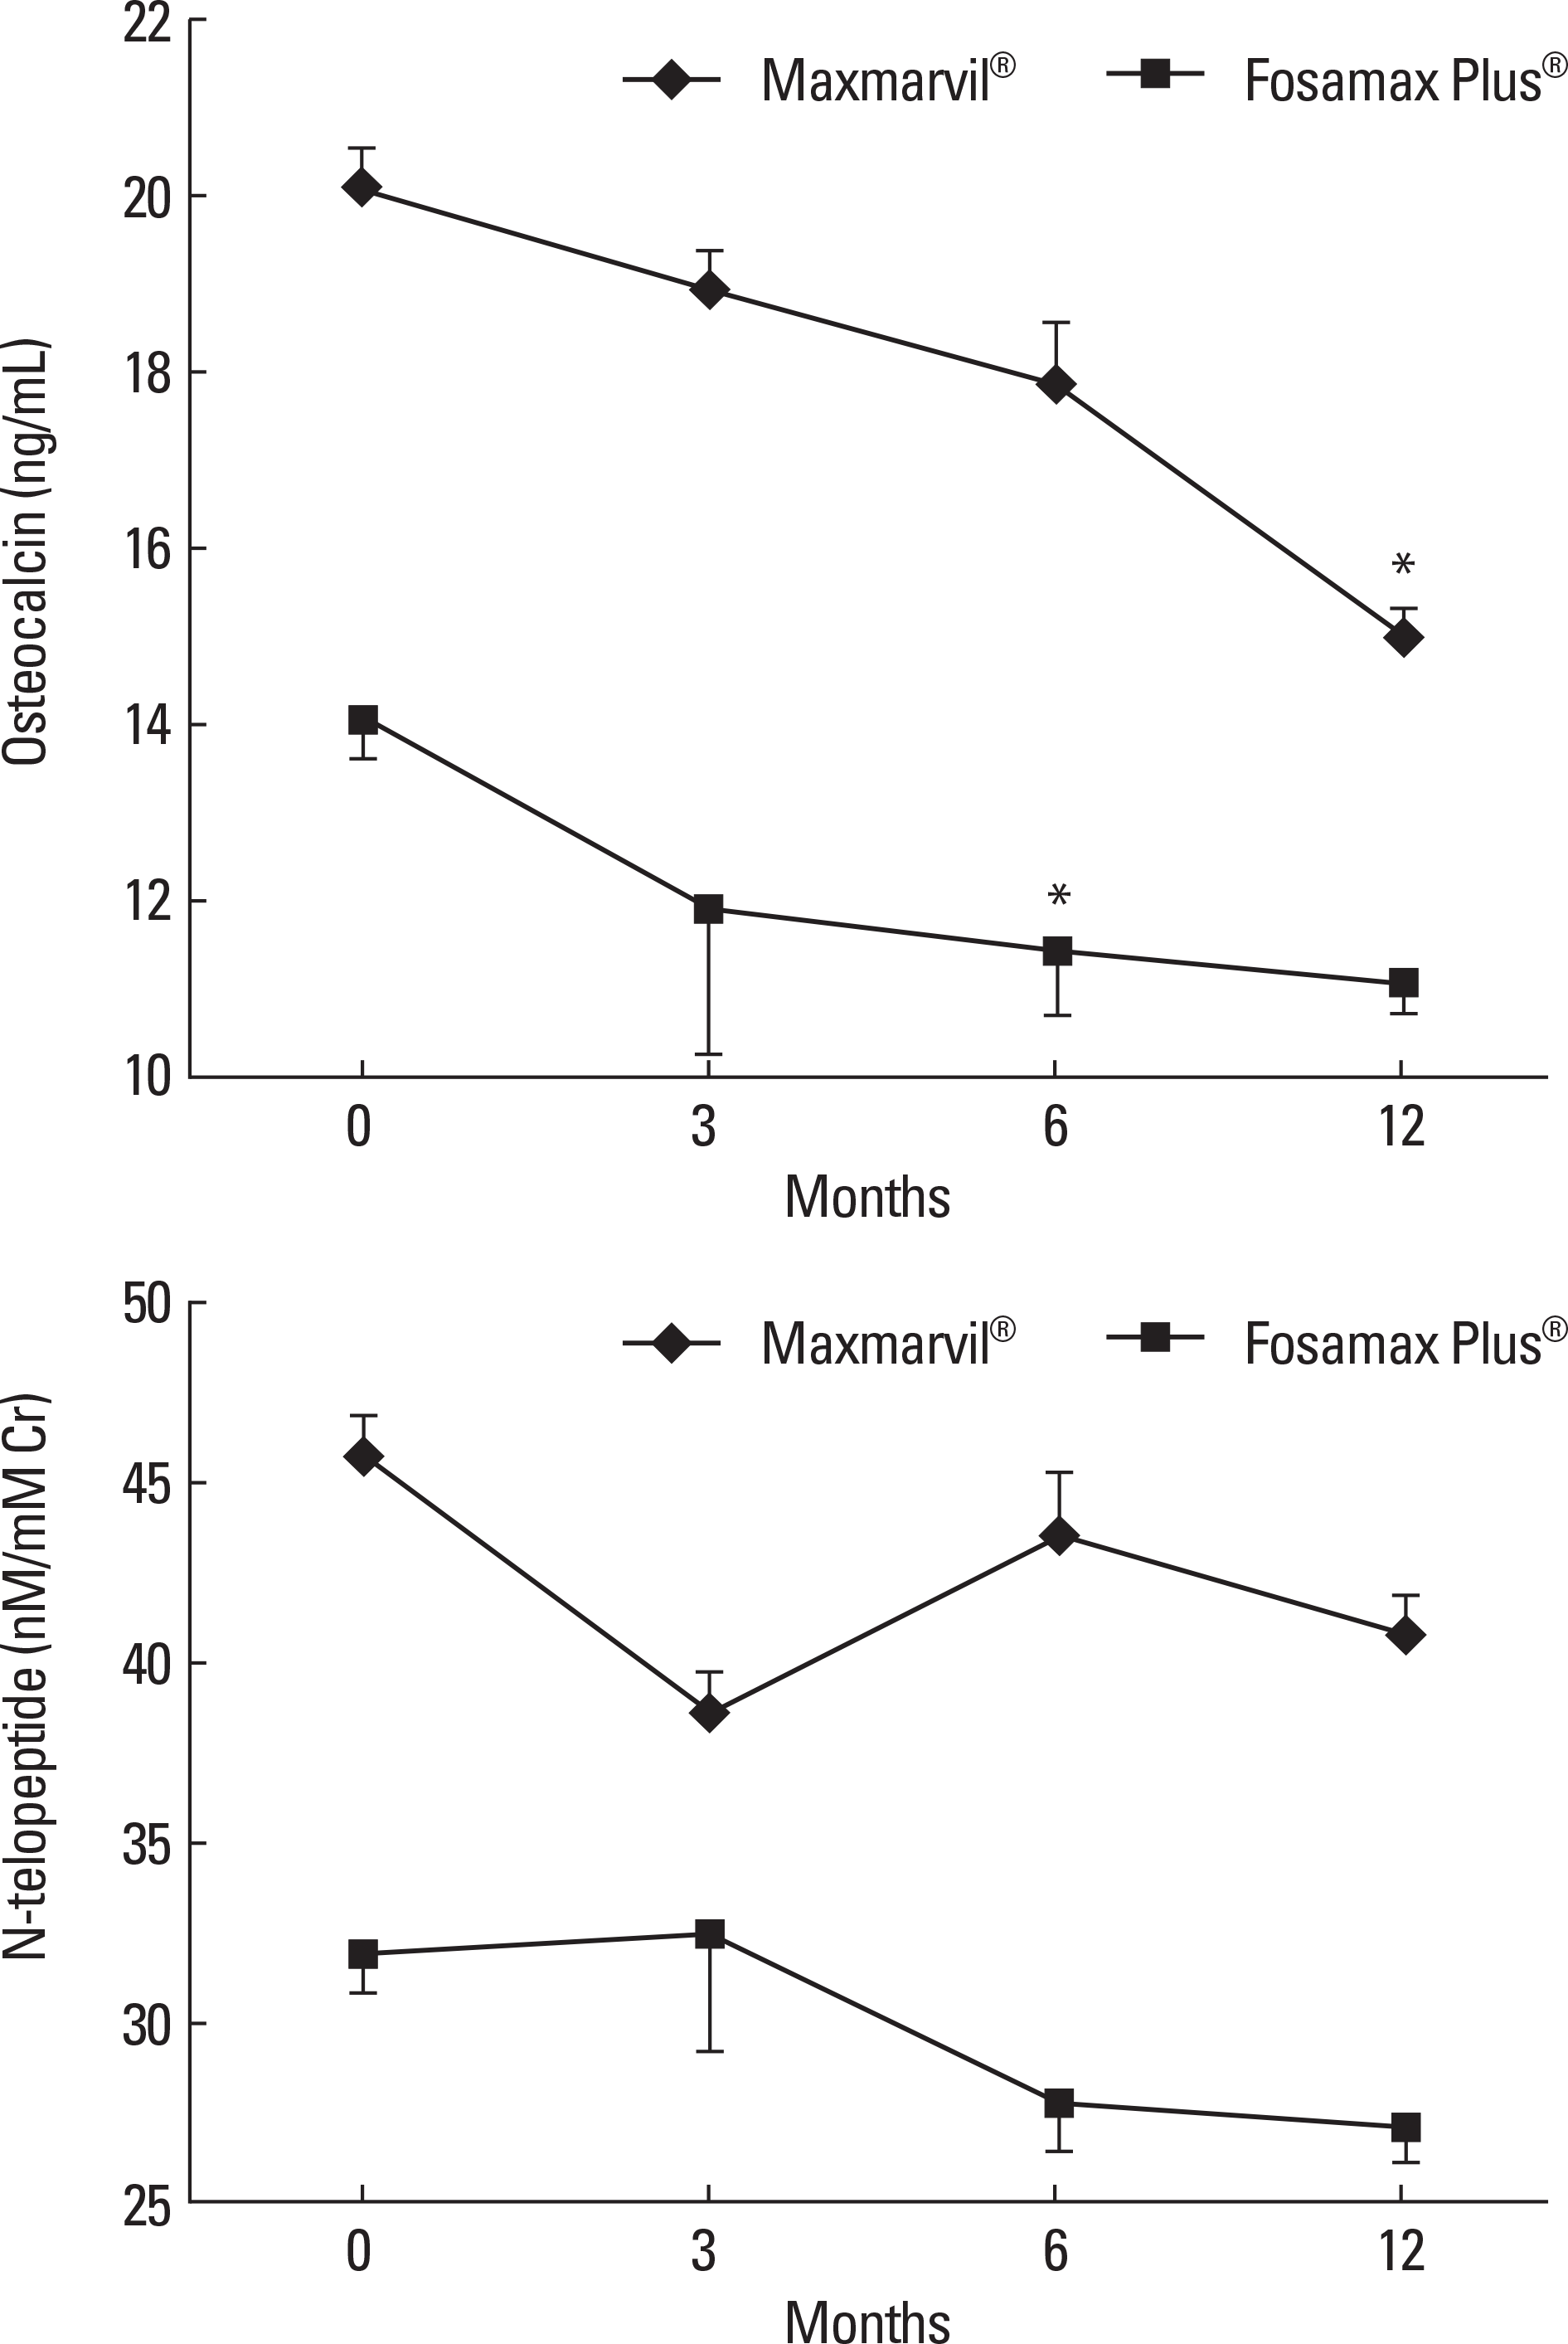
The data of 72 of the 297 patients were analyzed. In the Maxmarvil® group (n = 45), the serum PTH significantly decreased by 17% from baseline at 6 months (µ d = −6.10; ± 0.85 SE; P < 0.05) and it remained suppressed to 12 months. The serum 25(OH)D tended to increase, but without significance. In the Fosamax Plus® group (n = 27), the serum 25(OH)D significantly increased by 77% from baseline at 3 months (µ d = 9.87; ± 2.32 SE; P < 0.05) and it remained significantly higher than baseline at 6 months (µ d = 3.49; ± 0.86 SE; P < 0.05) and 12 months (µ d = 10.47; ± 0.71 SE; P < 0.001). However, the serum PTH showed no significant decrease. In the Maxmarvil® group, the serum osteocalcin significantly decreased by 26% from baseline at 12 months (µ d = −5.15; ± 0.35 SE; P < 0.05), and in the Fosamax Plus® group, the serum osteocalcin significantly decreased by 19% from baseline at 6months (µ d = −2.64; ± 0.73 SE; P < 0.05) and it remained suppressed to 12 months (µ d = −2.99; ± 0.37 SE; P = 0.32) without significance.
Conclusion
Maxmarvil® and Fosamax Plus® both improved the bone metabolism in Korean osteoporosis patients. Maxmarvil® significantly lowered the serum PTH levels, whereas Fosamax Plus® significantly elevated the serum 25(OH)D levels. (Endocrinol Metab 25:305–309, 2010)Background: The purpose of this study was to evaluate the effects of combined treatment with alendronate plus active or plain vitamin D on the vitamin D metabolism and bone turnover markers in patients with osteoporosis.
Methods
We investigated 297 osteoporosis outpatients who were treated with Maxmarvil® (alendronate 5 mg plus calcitriol 0.5 µ g) daily or Fosamax Plus® (alendronate 70 mg plus cholecalciferol 2,800 IU) weekly for 1 year. The serum levels of 25(OH)D, parathyroid hormone (PTH), calcium, phosphorus, osteocalcin and N-telopeptide were measured at baseline and after 3, 6, and 12 months
Results
The data of 72 of the 297 patients were analyzed. In the Maxmarvil® group (n = 45), the serum PTH significantly decreased by 17% from baseline at 6 months (µ d = −6.10; ± 0.85 SE; P < 0.05) and it remained suppressed to 12 months. The serum 25(OH)D tended to increase, but without significance. In the Fosamax Plus® group (n = 27), the serum 25(OH)D significantly increased by 77% from baseline at 3 months (µ d = 9.87; ± 2.32 SE; P < 0.05) and it remained significantly higher than baseline at 6 months (µ d = 3.49; ± 0.86 SE; P < 0.05) and 12 months (µ d = 10.47; ± 0.71 SE; P < 0.001). However, the serum PTH showed no significant decrease. In the Maxmarvil® group, the serum osteocalcin significantly decreased by 26% from baseline at 12 months (µ d = −5.15; ± 0.35 SE; P < 0.05), and in the Fosamax Plus® group, the serum osteocalcin significantly decreased by 19% from baseline at 6months (µ d = −2.64; ± 0.73 SE; P < 0.05) and it remained suppressed to 12 months (µ d = −2.99; ± 0.37 SE; P = 0.32) without significance.
Go to : 
References
1. NIH Consensus Development Panel on Osteoporosis Prevention, Diagnosis, and Therapy, March 7–29, 2000: highlights of the conference. South Med J. 94:569–573. 2001.
3. Holick MF, Chen TC. Vitamin D deficiency: a worldwide problem with health consequences. Am J Clin Nutr. 87:1080S–1086S. 2008.

4. Lips P, Duong T, Oleksik A, Black D, Cummings S, Cox D, Nickelsen T. A global study of vitamin D status and parathyroid function in postmenopausal women with osteoporosis: baseline data from the multiple outcomes of raloxifene evaluation clinical trial. J Clin Endocrinol Metab. 86:1212–1221. 2001.

5. National Osteoporosis Foundation. NOF osteoporosis prevention – Vitamin D recommendations. Internet:. http://www.nof.org/prevention/vitaminD.htm. (accessed August 20, 2009).
6. Richy F, Schacht E, Bruyere O, Ethgen O, Gourlay M, Reginster JY. Vitamin D analogs versus native vitamin D in preventing bone loss and osteoporosis-related fractures: a comparative metaanalysis. Calcif Tissue Int. 76:176–186. 2005.

7. Ringe JD, Schacht E. Prevention and therapy of osteoporosis: the roles of plain Vitamin D and alfacalcidol. Rheumatol Int. 24:189–197. 2004.

8. Frediani B, Allegri A, Bisogno S, Marcolongo R. Effects of combined treatment with calcitriol plus alendronate on bone mass and bone turnover in postmenopausal osteoporosis: two years of continuous treatment. Clin Drug Invest. 15:235–244. 1998.
9. Khan AA, Bilezikian JP, Kung AW, Ahmed MM, Dubois SJ, Ho AY, Schussheim D, Rubin MR, Shaikh AM, Silverberg SJ, Standish TI, Syed Z, Syed ZA. Alendronate in primary hyperparathyroidism: Alendronate in primary hyperparathyroidism: a double-blind, randomized, placebo-controlled trial. J Clin Endocrinol Metab. 89:3319–3325. 2004.
11. Bone HG, Hosking D, Devogelaer JP, Tucci JR, Emkey RD, Tonino RP, Rodriguez-Portales JA, Downs RW, Gupta J, Santora AC, Liberman UA. Alendronate Phase III Osteoporosis Treatment Study Group. Ten years' experience with alendronate for osteoporosis in postmenopausal women. N Engl J Med. 350:1189–1199. 2004.

13. Lau KH, Baylink DJ. Vitamin D therapy of osteoporosis: plain vitamin D therapy versus active vitamin D analog (D-hormone) therapy. Calcif Tissue Int. 65:295–306. 1999.

14. Recker R, Lips P, Felsenberg D, Lippuner K, Benhamou L, Hawkins F, Delmas PD, Rosen C, Emkey R, Salzmann G, He W, Santora AC. Alendronate with and without cholecalciferol for osteoporosis: Alendronate with and without cholecalciferol for osteoporosis: results of a 15-week randomized controlled trial. Curr Med Res Opin. 22:1745–1755.
15. Francis RM, Boyle IT, Moniz C, Sutcliffe AM, Davis BS, Beastall GH, Cowan RA, Downes N. A comparison of the effects of alfacalcidol treatment and vitamin D2 supplementation on calcium absorption in elderly women with vertebral fractures. Osteoporos Int. 6:284–290. 1996.

Go to : 
 | Fig. 1.The effect of combined treatment of alendronate and active or plain vitamin D on serum 25(OH)D. In the Maxmarvil® group, serum 25(OH)D showed no significant change. However, in the Fosamax Plus® group, serum 25(OH)D increased by 77% from baseline at 3 months (μ d = 9.87; ± 2.32 SE; P < 0.05) and remained significantly higher than baseline at 6 months (μ d = 3.49; ± 0.86 SE; P < 0.05) and 12 months (μ d = 10.47; ± 0.71 SE; P < 0.001).* P < 0.05 vs. baseline value; † P < 0.05 vs. Fosamax Plus® group. |
 | Fig. 2.The effects of combined treatment of alendronate and active or plain vitamin D on serum PTH. In the Maxmarvil® group, serum PTH decreased by 17% from baseline at 6 months (μ d = −6.10; ± 0.85 SE; P < 0.05) and remained suppressed at 12 months (μ d = −3.34; ± 0.95 SE; P = 0.54) without significance. In the Fosamax Plus® group, serum PTH showed no significant change.* P < 0.05 vs. baseline value; † P < 0.05 vs. Fosamax Plus® group. |
 | Fig. 3.The effects of combined treatment of alendronate and active or plain vitamin D on serum bone turnover markers. In the Maxmarvil® group, serum osteocalcin decreased by 26% from baseline at 12 months (μ d = −5.15; ± 0.35 SE; P < 0.05). In the Fosamax Plus® group, serum osteocalcin decreased by 19% from baseline at 6 months (μ d = −2.64; ± 0.73 SE; P < 0.05) and remained suppressed at 12 months (μ d = −2.99; ± 0.37 SE; P = 0.32) without significance. In both group, N-telopeptide showed no significant change.* P < 0.05 vs. baseline value. |
Table 1.
Baseline characteristics of subjects
| Variables | Maxmarvil® group | Fosamax Plus® group | P-value |
|---|---|---|---|
| Age (years) | 60.1 ± 0.4 | 65.7 ± 0.7 | < 0.05 |
| Male:Female | 6:39 | 1:26 | |
| 25(OH)D (ng/mL) | 11.9 ± 0.3 | 12.9 ± 0.4 | NS |
| PTH (pg/mL) | 35.9 ± 0.9 | 42.6 ± 1.7 | NS |
| Calcium (mg/dL) | 9.25 ± 0.02 | 9.16 ± 0.03 | NS |
| Phosphorus (mg/dL) | 3.51 ± 0.03 | 3.62 ± 0.05 | NS |
| Osteocalcin (ng/mL) | 20.2 ± 0.4 | 14.1 ± 0.4 | < 0.05 |
| NTx (nM/mM Cr) | 45.7 ± 1.1 | 31.9 ± 1.1 | < 0.05 |
| BMD, L-spine (g/cm2) | 0.897 ± 0.006 | 0.880 ± 0.013 | NS |
| BMD, femur total (g/cm2) | 0.796 ± 0.006 | 0.763 ± 0.011 | NS |


 PDF
PDF ePub
ePub Citation
 Print
Print


 XML Download