

 PDF
PDF ePub
ePub Citation
 Print
Print


INTRODUCTION
As the life span of individuals increases, metabolic disorder, especially type 2 diabetes mellitus (DM), has also been increasing rapidly worldwide [1]. Accordingly, DM has become a major health care problem regarding reduced life span, increased morbidity, and significant financial burden [2]. To date, it has been known that higher body mass, which is generally represented as increased weight or body mass index (BMI), correlates with insulin resistance and the risk of diabetes [34]. However, there is growing evidence that subjects with higher BMI may have a lower mortality and a better outcome in several chronic diseases; in fact, this phenomenon is described as the ‘obesity paradox’ [5]. This finding may indicate that BMI is a crude anthropometric index that does not accurately reflect an individual's fat mass/muscle mass status, nutritional status, and body fat distribution.
Several recent studies have suggested that adipose tissue stored in various body locations differentially impact metabolic health. Hu et al. [6] reported adverse risk for metabolic disorder with high trunk adiposity, but high leg adiposity was associated with a decreased risk of having two or more cardiometabolic risk factors in both African American and white adults. In addition, Snijder et al. [7] showed that larger leg fat mass was associated with lower fasting and postload glucose levels from a 75-g oral glucose tolerance test.
Sarcopenia, characterized by low muscle mass, has been considered to be associated with insulin resistance and type 2 diabetes [89]. Because skeletal muscle is the primary site of insulin-stimulated glucose disposal at euglycemia [10], low muscle mass may contribute to the development of diabetes. In that sense, larger thigh circumference, which reflects both larger leg muscle mass and larger leg fat mass, might have protective effects against metabolic disorders. In fact, a recent study reported that larger thigh circumference is associated with a lower risk of DM, independent of BMI, age, and waist circumference, whereas a larger waist circumference is associated with a higher risk of DM [11].
Although adipose tissue deposited in different body locations may differentially impact glucose tolerance, few studies have examined the association between regional body fat distribution and the prevalence of DM. In addition, while some studies have already suggested that both higher leg fat mass and higher leg muscle mass have beneficial effects on metabolic health, there are no studies regarding which parameter—leg fat mass or muscle mass—may be more important for diabetes in adult populations. The aim of our study was to determine whether the association between fat mass and the prevalence of DM is influenced by site-specific adipose tissue accumulation in relatively healthy Korean adult populations. We also evaluated the relative contributions of leg fat mass and leg muscle mass to DM prevalence according to sex.
METHODS
Study design and population
We recruited participants from the 2008 to 2010 Korea National Health and Nutrition Examination Surveys (KNHANES). The KNHANES has been performed periodically since 1998 by the Division of Chronic Disease Surveillance of the Korean Centers for Disease Control and Prevention in order to assess the health and nutritional status of the civilian, non-institutionalized population of Korea. It is a cross-sectional and nationally representative survey, composed of a health interview survey, a nutrition survey, and a health examination survey. Data were collected by household interviews and by direct, standardized physical examinations conducted in mobile examination centers. Daily total energy intake and medical history were evaluated using a 24-hour recall method. Regular exercise was indicated as “yes” if the subject exercised for more than 20 minutes at a time and more than three times per week. Women were also asked whether their menstruation had stopped and whether they had been treated with hormone replacement therapy. Postmenopausal status was defined as the self-reported cessation of menstruation for more than 1 year only and we excluded women who had undergone a hysterectomy (n=941). Considering that a rapid decline of sex hormones occurs at around the age of 50 in most adults, we included participants aged 50 years or older. Subjects with malignancy (n=88), thyroid disease (n=193), chronic liver disease (n=12), and chronic renal disease (n=21) or subjects taking medications, such as corticosteroids and statins (n=436) known to alter glucose level were excluded from the analysis. Finally, a total of 6,675 participants (3,027 men and 3,548 postmenopausal women) aged 50 years or older were recruited. Because the KNHANES survey data are publicly available, ethical approval was not required for this study. The data used from the KNHANES database were fully anonymized.
Data collection and measurements
Body weight and height were obtained using standard protocols. Waist circumference was measured at the narrowest point between the lower borders of the rib cage and the uppermost borders of the iliac crest at the end of normal expiration. Well-trained observers manually measured blood pressure with a mercury sphygmomanometer (Baumanometer; WA Baum Co., Copiague, NY, USA). Body composition, including truncal/peripheral fat mass and appendicular skeletal muscle mass (ASM), were measured by dual-energy X-ray absorptiometry (DXA; QDR 4500A; Hologic Inc., Waltham, MA, USA). Collected blood samples were immediately refrigerated, transported to the Central Testing Institute in Seoul, Korea, and analyzed within 24 hours. Fasting plasma glucose, total cholesterol, triglycerides (TG), and high density lipoprotein cholesterol (HDL-C) levels were measured with a Hitachi 700–110 chemistry analyzer (Hitachi, Tokyo, Japan). Glycosylated hemoglobin (HbA1c) levels were analyzed by high performance liquid chromatography using HLC-723G7 (Tosoh, Tokyo, Japan) in subjects with DM. Serum 25-hydroxyvitamin D3 level was measured by radioimmunoassay (DiaSorin Inc., Stillwater, MN, USA) using a γ-counter (1470 Wizard; PerkinElmer, Turku, Finland). The homeostasis model assessment of β-cell function (HOMA-β) was calculated using the following formula: [fasting plasma insulin (µIU/mL)×20]/[fasting glucose (mmol/L)–3.5] [12].
Definition of DM
We defined DM as the presence of 1 or more of the following components: (1) fasting plasma glucose 126 mg/dL (7.0 mmol/L) or higher; (2) a medical diagnosis of DM by a trained medical professional; and (3) treatment with oral hypoglycemic agents or insulin injections.
Statistical analyses
Statistical analyses were conducted using PASW Statistics version 20 (IBM Co., Armonk, NY, USA). A comparison between the groups was performed using the t-test for continuous variables. For categorical variables, a chi-square test was used to compare frequencies among the groups. To assess the association between leg fat mass and parameters, we performed a partial correlation analysis after adjustment for age. A multiple logistic regression analysis was used to examine the association between leg fat mass and DM by evaluating the odds ratio (OR) after adjusting for confounding factors. Last, to investigate the relative contributions of leg fat mass and leg muscle mass to DM in different combinations, we additionally subdivided the participants into four groups according to the median values of leg fat mass and leg muscle mass. These groups were high fat-low muscle (HF-LM), high fat-high muscle (HF-HM), low fat-low muscle (LF-LM), and low fat-high muscle (LF-HM).
RESULTS
Baseline characteristics of participants
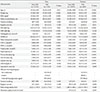
Table 1 summarizes the demographic and clinical characteristics of participants according to the presence of diabetes. The mean age of the participants was 63.76±8.96 years for men and 64.67±9.17 years for women (50 to 93 years of age). The overall prevalence of DM was 16.95% in men and 13.22% in postmenopausal women. As expected, obesity indices such as body weight, BMI, waist circumference, total body fat (%), and truncal/arm fat mass were higher in the DM group compared with those of the non-DM group. However, leg fat mass was lower in postmenopausal women with diabetes but this trend was not shown in men. Skeletal muscle mass index (ASM/weight) was lower in the DM group in both sexes. People with diabetes were more likely to have higher total cholesterol and TG and lower HDL-C levels in both sexes.
Prevalence of DM according to body fat distribution
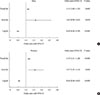
To investigate the independent contribution of trunk and extremities adiposity to DM, we calculated the adjusted OR of each kilogram increase in trunk and upper/lower extremities fat mass for DM using a multiple logistic regression analysis (Fig. 1). A 1-kg increase in trunk fat mass was associated with a 15% increase in the presence of DM in men and a 19% increase in women after adjustment for BMI, ASM, current smoking status, regular exercise, total cholesterol, TG, systolic blood pressure, daily total energy intake, and hormone replacement therapy status (women). Similarly, a 1-kg increase in arm fat mass also tended to be associated with an increased risk of DM in both sexes. Conversely, each kilogram increase in leg fat mass was significantly associated with a 51% reduction of DM in men and a 44% reduction in women after adjustment for confounding factors.
Correlation between leg fat mass and metabolic parameters
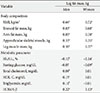
In a partial correlation analysis adjusted for age, leg fat mass was positively associated with BMI, trunk fat mass, and arm fat mass in both sexes (Table 2). There was a significant positive association between leg fat mass and ASM in both sexes (men: Rp=0.33, P<0.001; women: Rp=0.35, P<0.001). Leg fat mass was inversely associated with HbA1c in both sexes and fasting glucose in women. There was a significant positive relationship between leg fat mass and HOMA-β in both sexes. With respect to lipid profile, leg fat mass was positively associated with total cholesterol and TG, and negatively associated with HDL-C only in men.
Prevalence of DM according to leg fat mass and leg muscle mass
When the participants were classified into four groups according to sex-specific leg fat mass quartiles, the OR for the presence of DM significantly decreased gradually as leg fat mass increased in both sexes after adjustment for potential confounding factors (Table 3). To define the relative importance of leg fat mass and leg muscle mass on DM, we categorized subjects into four groups according to the sex-specific median value of leg fat mass and leg muscle mass: HF-LM, HF-HM, LF-LM, and LF-HM. Compared with the LF-LM group which is at the highest risk of metabolic disorder, higher leg fat mass groups (HF-HM and HF-LM) were associated with a decreased risk of DM in both sexes (Table 4). However, the lower leg fat mass groups, even though they have a large leg muscle mass, were associated with an increased risk of DM especially in women.
DISCUSSION
Our study found that higher leg fat mass was independently associated with a lower risk of DM in adult populations. We also demonstrated that adipose tissue, deposited in different body locations, may differentially impact the risk of DM. In addition, we observed that subjects with higher leg fat mass have a lower risk of DM even though they have a low leg muscle mass; but subjects with lower leg fat mass have a higher risk of DM even though they have large leg muscle mass. To our knowledge, this is the first population-based study of the association between body compositions and DM considering body fat distribution.
Adiposity is a well-known risk factor for DM and cardiovascular disease [13]. Abdominal adiposity and specifically visceral fat are considered to be more closely associated with metabolic abnormalities and cardiovascular disease [141516]. However, there is growing evidence that lower-extremity adiposity might be protective against adverse metabolic disease risk [1718]. Therefore, recent studies have suggested that upper body versus lower body obesity, represented by the waist-hip ratio, is more closely associated with metabolic disorders [19]. Finally, these facts suggest a discrepancy between regional fat depots and their relation to the risk of disease, such that lower-body adiposity appears more protective and upper body or trunk adiposity appears more harmful for metabolic disorder. From this perspective, we speculated that the increased leg fat mass, reflecting increased subcutaneous fat, may have a protective role in diabetes after controlling for the highly detrimental effects of abdominal visceral adiposity. Because there is a paucity of systemic data for the association between leg fat mass and the prevalence of DM, we investigated this association in community-dwelling adult Korean populations.
In our study, in contrast to trunk fat mass and arm fat mass, there was a negative association between leg fat mass and DM prevalence. This result is consistent with a recent study showing that leg fat mass was inversely associated with glucose levels and homeostatic model assessment of insulin resistance from an oral glucose tolerance test [7]. The possible protective role of leg fat mass and the differential role of adiposity according to location in DM can be explained by the following mechanisms. The first possible mechanism is that adipocytes in lower extremities are less lipolytic [20] and counter free fatty acid release from upper-body fat regions [21]. Consequently, the decrease in free fatty acids, as they are taken up in the adipose tissue of the lower extremities, may protect pancreatic β-cells from lipotoxicity. In contrast to lower body adiposity, upper body adiposity is more sensitive to lipolysis and secretes a higher amount of inflammatory cytokines [22]. Second, differential secretion of adipokines by different fat depots may also be involved. Adiponectin, predominantly produced by adipocytes, has been considered to have insulin-sensitizing, anti-inflammatory, and anti-atherosclerotic properties [2324]. It is known to enhance glucose uptake and lipid oxidation through activation of adenosine monophosphate-activated protein kinases [25]. Recent studies reported that lower body fat was positively associated with adiponectin levels, while trunk fat was negatively associated with adiponectin levels [26]. Furthermore, Kovacova et al. [27] reported that visceral adipose tissue has lower gene expression of total adiponectin than subcutaneous depots. The above mechanisms can explain the potential beneficial impact of leg fat on pancreatic β-cell function and glucose tolerance. Our study demonstrated that leg fat mass was positively associated with HOMA-β, which is a well-known index of pancreatic β-cell function. This result suggests that leg fat may positively influence glucose tolerance by protecting pancreatic β-cells from lipotoxicity and inflammatory cytokines.
Recently, the interaction between appendicular muscle mass and glucose tolerance has been a subject of interest. Because skeletal muscle is responsible for insulin-mediated glucose disposal, low muscle mass can have a negative impact on glucose tolerance. Therefore, previous studies have shown that larger hip or thigh circumference is associated with decreased diabetes risk [112829]. However, these studies did not completely analyze which component of lower extremities has a more dominant effect on DM. In our study, we observed that leg fat mass may contribute more to DM than leg muscle mass. In addition, we found that higher leg fat mass was associated with higher ASM. From these findings, we speculate that anti-inflammatory properties of leg fat may protect against age-related loss of skeletal muscle mass and consequently may favorably influence glucose metabolism. This fact may partly explain the dominant effect of leg fat over leg muscle on DM.
In addition, although in both genders there was a significant inverse relationship between leg fat mass and DM after adjustment for confounding factors, including BMI, we found that the association between leg fat mass and DM was more prominent in postmenopausal women than in men based on an independent t-test and a partial correlation analysis. In addition, we also found that there was a significant positive relationship between leg fat mass and TG in men but there was no association between leg fat mass and TG in women. Similarly, Van Pelt et al. [30] reported favorable correlation between lower-body adiposity with markers of insulin resistance and dyslipidemia in postmenopausal women after adjusting for upper-body adiposity. These gender differences in the association of lower-body adiposity and DM can be explained by the fact that women have an increased propensity to store fat in lower extremity adipose tissue and away from abdominal visceral tissue depots. In line with this fact, our data also showed that leg fat mass was more strongly associated with upper body adiposity in men than in women (Table 2). This result suggests that the benefit of leg fat on glucose tolerance and lipid metabolism is countered by the greater upper body adiposity in men.
The major strength of our study is that we analyzed representative data collected from a nationwide survey in Korea, including large numbers of participants of both sexes. In addition, we compared significant associations between body compositions and DM according to gender for the first time. However, there were some limitations in this study. First, as the present study was a cross-sectional study, a causal relationship between leg fat mass and diabetes could not be definitively established. Second, because DXA is unable to distinguish between subcutaneous and intramuscular fat in the lower and upper extremities, we could not conclude whether the beneficial effects of leg fat on glucose tolerance were due to subcutaneous or intramuscular fat. Third, although the association between leg fat and glucose tolerance was presumed to result from adipokines and inflammatory factors, we could not further prove it due to lack of data. Finally, as we did not examine the associations between other ethnic groups with different body compositions, we were not able to extend our results to other ethnic groups.
In conclusion, our study demonstrates that, in contrast to trunk and arm adiposity, there is a favorable association of leg adiposity with DM in Korean adults aged 50 years or older. We also found that the contributory effects of lower extremity fat on DM are more dominant than those of the lower extremity muscle. Our findings support the notion that subcutaneous fat and glucose metabolism are intimately interlinked. Further prospective studies are needed to confirm the causal interactions between leg fat mass and the development of diabetes.


 XML Download