Journal List > Diabetes Metab J > v.41(4) > 1084963

Kim, Choi, Kim, An, Kim, Kim, and Kim: Determinants of Long-Term Durable Glycemic Control in New-Onset Type 2 Diabetes Mellitus

Abstract

Background

Long-term durable glycemic control is a difficult goal in the management of type 2 diabetes mellitus (T2DM). We evaluated the factors associated with durable glycemic control in a real clinical setting.

Methods

We retrospectively reviewed the medical records of 194 new-onset, drug-naïve patients with T2DM who were diagnosed between January 2011 and March 2013, and were followed up for >2 years. Glycemic durability was defined as the maintenance of optimal glycemic control (glycosylated hemoglobin [HbA1c] <7.0%) for 2 years without substitution or adding other glucose-lowering agents. Clinical factors and glycemic markers associated with glycemic durability were compared between two groups: a durability group and a non-durability group.

Results

Patients in the durability group had a higher baseline body mass index (26.1 kg/m2 vs. 24.9 kg/m2) and lower HbA1c (8.6% vs. 9.7%) than the non-durability group. The initial choice of glucose-lowering agents was similar in both groups, except for insulin and sulfonylureas, which were more frequently prescribed in the non-durability group. In multiple logistic regression analyses, higher levels of education, physical activity, and homeostasis model assessment of β-cell function (HOMA-β) were associated with glycemic durability. Notably, lower HbA1c (<7.0%) at baseline and first follow-up were significantly associated with glycemic durability (adjusted odds ratio [OR], 7.48; 95% confidence interval [CI], 2.51 to 22.3) (adjusted OR, 9.27; 95% CI, 1.62 to 53.1, respectively), after adjusting for confounding variables including the types of glucose-lowering agents.

Conclusion

Early achievement of HbA1c level within the glycemic target was a determinant of long-term glycemic durability in new-onset T2DM, as were higher levels of education, physical activity, and HOMA-β.

INTRODUCTION

Type 2 diabetes mellitus (T2DM) is considered a progressive metabolic disorder caused by two major pathophysiological defects: insulin resistance and β-cell dysfunction [1]. Large-scale, randomized controlled trials have proved that intensive glucose control decreases the risk of microvascular complications [23], and even the risks of cardiovascular events or mortality, as shown in long-term follow-up studies [45]. However, mainly because of progressive decline in β-cell function and clinical inertia, long-term durable glycemic control remains a difficult goal to attain in the management of T2DM [678].
During past decades, the development of novel glucose-lowering agents and strategies has demonstrated more positive impact on glycemic durability than previously observed. A report from the Swedish National Diabetes Register demonstrated that, in real clinical practice, metformin resulted in superior glycemic durability than sulfonylureas or meglitinides [9]. Similarly, in the A Diabetes Outcome Progression Trial (ADOPT) study, rosiglitazone proved to be a better choice in achieving glycemic durability than either sulfonylureas or metformin [6]. Among recently developed novel agents, some, but not all, sodium glucose cotransporter-2 inhibitors and glucagon-like peptide-1 receptor agonists have shown more tolerable glycemic control than metformin and sulfonylureas [1011]. Results of several trials have suggested that an early intensive insulin therapy can even lead to a complete disease resolution in patients with new-onset T2DM and help attain glycemic durability [1213]. However, these results are based on tightly regulated clinical trials comprising highly selective patients, which limit their applicability in real clinical practice. In fact, other studies have noted patient-related factors or characteristics other than the use of specific glucose-lowering agents, such as tolerability, patient acceptance, and costs, that can affect durable glycemic control [1415]. On the other hand, current treatment guidelines and recommendations have reached a consensus that tight glycemic control is more beneficial to patients with short-duration diabetes or those who are free of related complications [16].
Nonetheless, despite improved understanding of inter-patient differences affecting responses to therapy, little information is available on factors that are strongly associated with durable glycemic control in real clinical settings. Therefore, we aimed to assess the major determinants of durable glycemic control in new-onset T2DM using 2 years of observational data.

METHODS

Study population

We retrospectively reviewed clinical data of patients who were diagnosed with T2DM between January 2011 and March 2013 at the Korea University Anam Hospital. Among the 314 new-onset T2DM patients, 194 patients were followed up for at least 2 years, with the last follow-ups ended in March 2015, and were included in this study. All diagnoses were made in accordance with the American Diabetes Association (ADA) criteria [17]. All included subjects were aged ≥18 years and had not taken any glucose-lowering agents before their diagnosis.
The study subjects were classified into the durability group or the non-durability group based on their glycemic durability. Glycemic durability was defined as the maintenance of optimal glycemic control (glycosylated hemoglobin [HbA1c] <7.0%) over 6 months after diagnosis for 2 years, without substitution or adding other glucose-lowering agents. Subjects who did not maintain their HbA1c values at the desired level were included in the non-durability group.
This study was approved by the Institutional Review Board of Korea University Hospital (IRB number: ED16182).

Clinical and laboratory variables

A structured interview was conducted at the patients' first visit, and demographic characteristics and medical histories were recorded by two trained diabetes education nurses. Anthropometric parameters were also measured at this visit. Demographic information included age, sex, residential area, lifestyle, occupation, and education level. Medical information included any history of hypertension, dyslipidemia, cardiovascular disease, malignancy, and the use of medications for any of these conditions.
Patients' histories of smoking, alcohol consumption, physical activity, and education level were also recorded. For statistical analyses, these demographic data were stratified further into two or three groups as follows: smoking (never smokers, former smokers, or current smokers), alcohol consumption (yes or no), educational level (lower than middle school, high school, or higher than college), and physical activity (none, ≤twice per week, or ≥three times per week).
Anthropometric data including height, body weight, and waist circumference were measured by nurses. The initial laboratory tests included evaluations of fasting plasma glucose (mg/dL), 2-hour postprandial glucose (mg/dL), HbA1c (%), basal C-peptide (ng/mL), basal insulin (µIU/mL), serum creatinine (mg/dL), estimated glomerular filtration rate (mL/min/1.73 m2), and lipid profiles (total cholesterol, high density lipoprotein cholesterol, and triglycerides). The following equations were used to calculate insulin resistance and β-cell function: homeostasis model assessment of insulin resistance (HOMA-IR)=fasting insulin (µIU/mL)×fasting plasma glucose (mmol/L)/22.5; HOMA of β-cell function (HOMA-β)=20×fasting plasma insulin (µIU/mL)/[fasting plasma glucose (mmol/L)–3.5].

Follow-up measurements

Patients were followed up every 2 to 3 months over the 2-year period, and their HbA1c levels, fasting plasma glucose, systolic and diastolic blood pressure, and body weight were measured at each follow-up visit. The enrolled patients were educated on structured lifestyle modifications, including diet control and regular exercise. Physicians generally followed the current ADA/European Association for the Study of Diabetes (EASD) guidelines for the management of T2DM [16]; however, they were not obliged to select specific glucose-lowering agents. The determination of therapeutic options, including the selection of a specific class of glucose-lowering agents or regimens, or recommending observation without medications, was entirely at the physicians' discretion.

Statistical analyses

Patients were divided into two groups according to a prespecified definition of glycemic durability. A repeated measures logistic model for the longitudinal analysis of HbA1c over time was performed to compare mean HbA1c trajectories between the groups.
At baseline, the mean values of various laboratory findings were compared between the durability and the non-durability groups using a paired t-test and a Mann-Whitney U test. Categorical variables were compared using univariate analysis. Results were presented as numbers/percentage or mean±standard deviation values. Multiple logistic regression analysis was performed to investigate the clinical and laboratory factors associated with glycemic durability. The factors used in the multivariate analysis were adjusted for age, sex, body mass index (BMI), medication use, and the baseline HbA1c. A P<0.05 was considered statistically significant. All statistical analyses were performed using SPSS version 22.0 (IBM Co., Armonk, NY, USA).

RESULTS

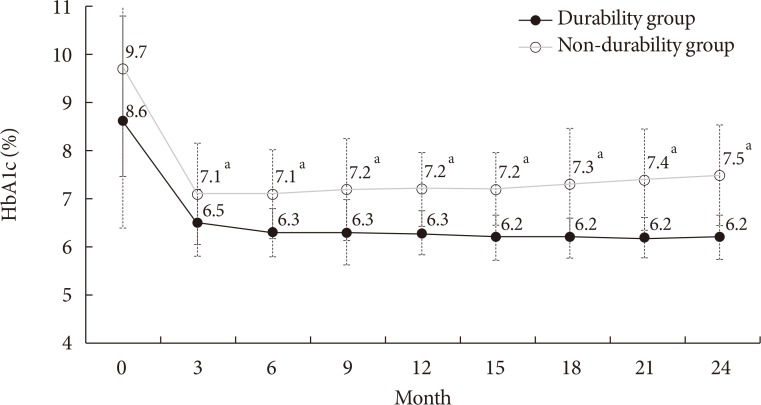
Subjects were divided into the durability group (n=114) and the non-durability group (n=80). Fig. 1 and Supplementary Fig. 1 shows the changes in the mean HbA1c levels in both groups during the 2-year follow-up period. The baseline HbA1c level was significantly higher in the non-durability group than in the durability group (mean, 9.7% vs. 8.6%). Three months after diagnosis, the difference in HbA1c between groups was 0.6%, however, the gap increased during folllow-up, producing ~1.3% difference in the mean HbA1c level 2 years after diagnosis (7.5% vs. 6.2%, P<0.01).
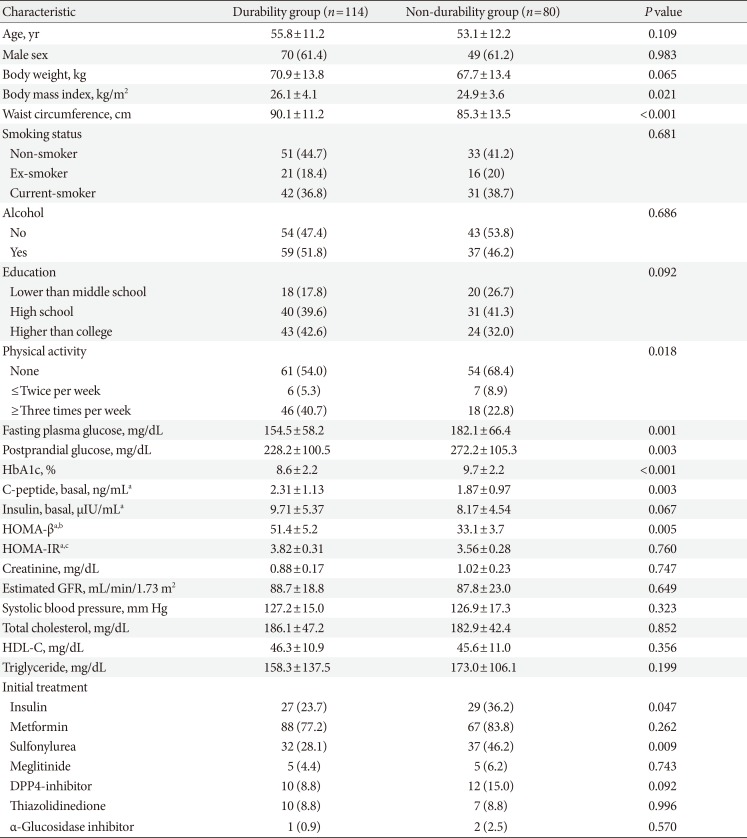
The baseline patient characteristics are described in Table 1. Subjects in the durability group had a higher BMI (26.1 kg/m2 vs. 24.9 kg/m2, P=0.021), and waist circumference (90.1 cm vs. 85.3 cm, P<0.001) than those in the non-durability group. Although the lifestyle factors were comparable between the groups, a comparison of the level of physical activity indicated that subjects in the durability group were more physically active. The durability group also had higher HOMA-β levels than the non-durability group, although the HOMA-IR levels were comparable between the two groups.
Metformin was the most frequently prescribed initial glucose-lowering agent in both groups, followed by sulfonylureas. The difference in treatment regimen between the two groups was the use of insulin and sulfonylureas, which were used more frequently in the non-durability group than in the durability group (Table 1). The usage frequencies of each prescription glucose-lowering agent during the entire follow-up period are displayed in Supplementary Table 1.

Clinical and laboratory factors related to glycemic durability

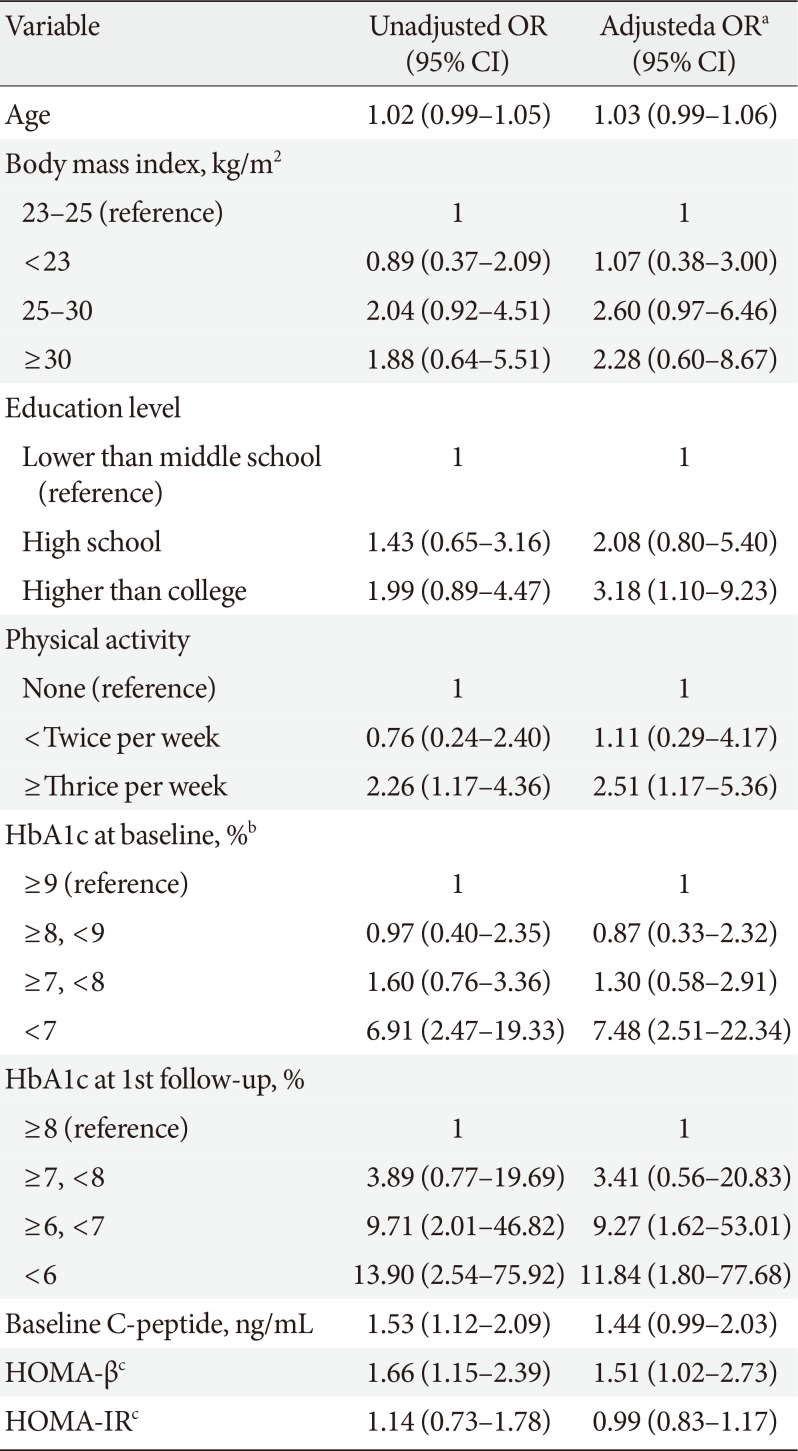
We selected candidate variables associated with glycemic durability based on the differences between the two study groups at baseline. Table 2 shows the variables and their glycemic durability predicting values, which we evaluated using multiple logistic regression analyses.
The result of an adjusted multiple regression model indicated that higher levels of education, physical activity, and baseline HOMA-β were significantly associated with an increased likelihood of glycemic durability than were lower values of these variables. However, age, BMI, and HOMA-IR did not show a significant effect on glycemic durability.
The HbA1c levels at both the baseline and the first follow-up visit were significantly associated with glycemic durability. Subjects with baseline HbA1c values <7.0% tended to maintain optimal glycemic control during the 2-year follow-up period, with an adjusted odds ratio (OR) of 7.48 (95% confidence interval, 2.51 to 22.3), compared to subjects with baseline HbA1c >9.0%. Further, in an adjusted regression model, lower HbA1c levels at the first follow-up visit (<6.0%, and between 6.0% and 7.0%) demonstrated significantly higher ORs for glycemic durability compared to a higher HbA1c level at this visit (OR, 11.84 and 9.27, respectively).

HbA1c level at early treatment phase as a determinant of long-term durable glycemic control

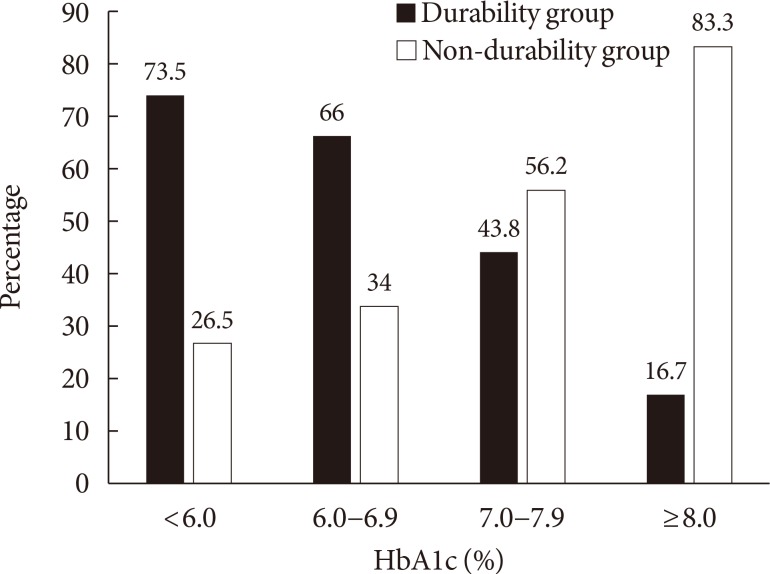
Based on the results of the multiple logistic regression analyses, we further analyzed the association between the HbA1c level at the early treatment phase following diagnosis and glycemic durability. As illustrated in Fig. 2, 86.8% of the patients with baseline HbA1c <7.0% maintained durable glycemic control during the 2-year follow-up period. However, only 51.1% of the patients with baseline HbA1c >9.0% were likely to maintain durable glycemic control. This pattern was more apparent for HbA1c levels noted at the first follow-up visit, which commonly measured 2 to 3 months after diagnosis (Fig. 3). For example, patients with HbA1c <6.0% at the first follow-up visit were 4 times more likely to maintain durable glycemic control than those with HbA1c ≥8.0% (73.5% vs. 16.7%, P<0.001). Table 3 shows the association between the duration required to reach the target HbA1c value (<7.0%) and glycemic durability. Compared to patients who reached the target HbA1c value 6 months after diagnosis, those who reached the target value in <3 months were ~6 times more likely to maintain durable glycemic control during the 2-year period.

DISCUSSION

This study showed that some clinical factors contribute to the maintenance of durable glycemic control in new-onset T2DM. HbA1c levels at the time of diagnosis, and at the first follow-up visit were important determinants of glycemic durability. In addition, higher levels of education, physical activity, and HOMA-β were associated with durable glycemic control during a 2-year follow-up period.
HbA1c is the most widely used marker of glycemic control, and reflects overall glycemic exposure for the previous 2 to 3 months [18]. A higher baseline HbA1c level in the non-durability group suggests long-term exposure to hyperglycemia before the diagnosis. Therefore, we assume that a higher glucotoxicity in the non-durability group may have impaired both insulin secretion and activity [19]; thereby, lowering the possibility of maintaining favorable glycemic control in these patients. A significantly lower HOMA-β level in the non-durability group further supported this explanation.
Interestingly, we observed that a lower HbA1c level at the first follow-up visit was a strong indicator of glycemic durability. The significance of this association was maintained even after adjusting for baseline HbA1c levels and the type of glucose-lowering agents. Two possible explanations, with divergent mechanisms, should be considered for this observation. First, a rapid correction of hyperglycemia may be responsible for the glycemic durability in patients with new-onset T2DM. In this context, several studies have reported that early and intensive therapy produced favorable outcomes, i.e., recovery and maintenance of β-cell function, in drug-naïve patients at the onset of T2DM. In a meta-analysis to assess the efficacy of intensive insulin therapy, approximately 42.1% of patients experienced drug-free remission of diabetes during a 2-year period with only 2 to 3 weeks of intensive insulin therapy at the onset of diabetes [12]. Intensive insulin therapy provides rest to the β-cells by decreasing the hepatic glucose production, and by reducing glucotoxicity and lipotoxicity [13]. Our results, although retrospectively analyzed, expanded on the concept that a rapid correction of hyperglycemia, with or without insulin, may aid in the long-term maintenance of hyperglycemia within the target range. Second, patients in the durability group may be “good responders” to the glucose-lowering treatments. When the analysis was done among patients who attained HbA1c <7.0% at 6 months, we also observed similar findings (Supplementary Tables 2 and 3). This may partly be due to relatively short-term exposure to hyperglycemia or due to their having genetically healthier β-cells than patients in the non-durability group. However, individual differences that may affect therapeutic responses remain unclear. More targeted studies will be required to recognize the degree to which alterations in specific aspects of glucose homeostasis will differ between individuals, and how an individual will respond to a specific medication in a real clinical setting [20].
Our results further demonstrated that T2DM patients' educational and physical activity levels were associated with long-term glycemic durability. Several studies have identified patient-specific factors that may influence the durability of glycemic responses, emphasizing the need to personalize therapies based on patient characteristics. In a Japanese study, the avoidance of weight gain contributed to the maintenance of better glycemic control [21]. In another study by Mamza et al. [7], female gender, smoking, longer duration of diabetes, and a higher baseline HbA1c level were associated with a poor durability of therapeutic efficacy.
Patients' education level and physical activity are factors that need to be considered as seriously as socioeconomic status and patient attitude [2223]. Patients with low socioeconomic status are more exposed to unhealthy lifestyles and adverse environmental factors such as obesity, physical inactivity, and smoking, as they are less likely to avail themselves of routine health checkups and health education compared to those with high socioeconomic status [24]. The European Diabetes (EURODIAB) Prospective Complications study reported that a healthy lifestyle was more prevalent among better-educated men and women with diabetes [22]. A previous study noted that exercise training, which promotes a higher physical activity level, could directly reduce HbA1c level in addition to reducing the risk of developing diabetic complications [25]. Another report identified patient adherence as an important determinant of response to treatment for T2DM [26]. Therefore, patients' attitude to treatment and their educational level should also be considered as predictive indicators of response to treatment and long-term glycemic control.
There are several limitations to this study. First, some factors varied because they were controlled by clinicians. Physicians in this study generally followed the current ADA/EASD guideline that recommends the following: HbA1c <7.0% as the glycemic target, metformin as the initial glucose-lowering agent, and lifestyle modifications. However, the glycemic targets were set individually, and the choice of glucose-lowering agent was solely dependent on the clinician's discretion. This is an inevitable limitation of a retrospective study design. Second, because we included only those patients who attended follow-up visits for at least 2 years, all our study subjects demonstrated good adherence to treatment, which may limit the applicability of our results to a broader patient spectrum.
In conclusion, our findings will help illuminate inter-individual differences in responses to therapy by providing evidence for various factors that can affect the durability of glycemic control. Above all, an early treatment response in terms of glycemic control was an important predictor of continuing durable glycemic control. Further well-controlled trials will be needed to confirm this hypothesis.

Notes

CONFLICTS OF INTEREST: No potential conflict of interest relevant to this article was reported.

References

1. Ramlo-Halsted BA, Edelman SV. The natural history of type 2 diabetes. Implications for clinical practice. Prim Care. 1999; 26:771–789. PMID: 10523459.
2. UK Prospective Diabetes Study (UKPDS) Group. Intensive blood-glucose control with sulphonylureas or insulin compared with conventional treatment and risk of complications in patients with type 2 diabetes (UKPDS 33). Lancet. 1998; 352:837–853. PMID: 9742976.
3. ADVANCE Collaborative Group. Patel A, MacMahon S, Chalmers J, Neal B, Billot L, Woodward M, Marre M, Cooper M, Glasziou P, Grobbee D, Hamet P, Harrap S, Heller S, Liu L, Mancia G, Mogensen CE, Pan C, Poulter N, Rodgers A, Williams B, Bompoint S, de Galan BE, Joshi R, Travert F. Intensive blood glucose control and vascular outcomes in patients with type 2 diabetes. N Engl J Med. 2008; 358:2560–2572. PMID: 18539916.
4. Holman RR, Paul SK, Bethel MA, Matthews DR, Neil HA. 10-Year follow-up of intensive glucose control in type 2 diabetes. N Engl J Med. 2008; 359:1577–1589. PMID: 18784090.
crossref
5. Hayward RA, Reaven PD, Wiitala WL, Bahn GD, Reda DJ, Ge L, McCarren M, Duckworth WC, Emanuele NV. VADT Investigators. Follow-up of glycemic control and cardiovascular outcomes in type 2 diabetes. N Engl J Med. 2015; 372:2197–2206. PMID: 26039600.
crossref
6. Kahn SE, Haffner SM, Heise MA, Herman WH, Holman RR, Jones NP, Kravitz BG, Lachin JM, O'Neill MC, Zinman B, Viberti G. ADOPT Study Group. Glycemic durability of rosiglitazone, metformin, or glyburide monotherapy. N Engl J Med. 2006; 355:2427–2443. PMID: 17145742.
crossref
7. Mamza J, Mehta R, Donnelly R, Idris I. Important differences in the durability of glycaemic response among second-line treatment options when added to metformin in type 2 diabetes: a retrospective cohort study. Ann Med. 2016; 48:224–234. PMID: 26982210.
crossref
8. Turner RC, Cull CA, Frighi V, Holman RR. UK Prospective Diabetes Study (UKPDS) Group. Glycemic control with diet, sulfonylurea, metformin, or insulin in patients with type 2 diabetes mellitus: progressive requirement for multiple therapies (UKPDS 49). JAMA. 1999; 281:2005–2012. PMID: 10359389.
9. Ekstrom N, Svensson AM, Miftaraj M, Andersson Sundell K, Cederholm J, Zethelius B, Eliasson B, Gudbjornsdottir S. Durability of oral hypoglycemic agents in drug naive patients with type 2 diabetes: report from the Swedish National Diabetes Register (NDR). BMJ Open Diabetes Res Care. 2015; 3:e000059.
10. Ridderstrale M, Andersen KR, Zeller C, Kim G, Woerle HJ, Broedl UC. EMPA-REG H2H-SU trial investigators. Comparison of empagliflozin and glimepiride as add-on to metformin in patients with type 2 diabetes: a 104-week randomised, active-controlled, double-blind, phase 3 trial. Lancet Diabetes Endocrinol. 2014; 2:691–700. PMID: 24948511.
11. Umpierrez G, Tofe Povedano S, Perez Manghi F, Shurzinske L, Pechtner V. Efficacy and safety of dulaglutide monotherapy versus metformin in type 2 diabetes in a randomized controlled trial (AWARD-3). Diabetes Care. 2014; 37:2168–2176. PMID: 24842985.
crossref
12. Kramer CK, Zinman B, Retnakaran R. Short-term intensive insulin therapy in type 2 diabetes mellitus: a systematic review and meta-analysis. Lancet Diabetes Endocrinol. 2013; 1:28–34. PMID: 24622264.
crossref
13. Weng J, Li Y, Xu W, Shi L, Zhang Q, Zhu D, Hu Y, Zhou Z, Yan X, Tian H, Ran X, Luo Z, Xian J, Yan L, Li F, Zeng L, Chen Y, Yang L, Yan S, Liu J, Li M, Fu Z, Cheng H. Effect of intensive insulin therapy on beta-cell function and glycaemic control in patients with newly diagnosed type 2 diabetes: a multicentre randomised parallel-group trial. Lancet. 2008; 371:1753–1760. PMID: 18502299.
14. Kruger DF. Managing diabetes from first diagnosis: choosing well-tolerated therapies with durability. Diabetes Educ. 2012; 38(4 Suppl):4S–11S. PMID: 22713263.
15. Nathan DM, Buse JB, Kahn SE, Krause-Steinrauf H, Larkin ME, Staten M, Wexler D, Lachin JM. GRADE Study Research Group. Rationale and design of the glycemia reduction approaches in diabetes: a comparative effectiveness study (GRADE). Diabetes Care. 2013; 36:2254–2261. PMID: 23690531.
crossref
16. Inzucchi SE, Bergenstal RM, Buse JB, Diamant M, Ferrannini E, Nauck M, Peters AL, Tsapas A, Wender R, Matthews DR. Management of hyperglycemia in type 2 diabetes, 2015: a patient-centered approach: update to a position statement of the American Diabetes Association and the European Association for the Study of Diabetes. Diabetes Care. 2015; 38:140–149. PMID: 25538310.
crossref
17. Genuth S, Alberti KG, Bennett P, Buse J, Defronzo R, Kahn R, Kitzmiller J, Knowler WC, Lebovitz H, Lernmark A, Nathan D, Palmer J, Rizza R, Saudek C, Shaw J, Steffes M, Stern M, Tuomilehto J, Zimmet P. Expert Committee on the Diagnosis and Classification of Diabetes Mellitus. Follow-up report on the diagnosis of diabetes mellitus. Diabetes Care. 2003; 26:3160–3167. PMID: 14578255.
18. Woerle HJ, Neumann C, Zschau S, Tenner S, Irsigler A, Schirra J, Gerich JE, Goke B. Impact of fasting and postprandial glycemia on overall glycemic control in type 2 diabetes Importance of postprandial glycemia to achieve target HbA1c levels. Diabetes Res Clin Pract. 2007; 77:280–285. PMID: 17240473.
19. Del Prato S. Role of glucotoxicity and lipotoxicity in the pathophysiology of type 2 diabetes mellitus and emerging treatment strategies. Diabet Med. 2009; 26:1185–1192. PMID: 20002468.
crossref
20. Smith RJ, Nathan DM, Arslanian SA, Groop L, Rizza RA, Rotter JI. Individualizing therapies in type 2 diabetes mellitus based on patient characteristics: what we know and what we need to know. J Clin Endocrinol Metab. 2010; 95:1566–1574. PMID: 20194712.
crossref
21. Kubota A, Yabe D, Kanamori A, Kuroe A, Takahashi N, Saito T, Matsuba I, Nabe K, Kurose T, Seino Y. Factors influencing the durability of the glucose-lowering effect of sitagliptin combined with a sulfonylurea. J Diabetes Investig. 2014; 5:445–448.
crossref
22. Chaturvedi N, Stephenson JM, Fuller JH. The relationship between socioeconomic status and diabetes control and complications in the EURODIAB IDDM Complications Study. Diabetes Care. 1996; 19:423–430. PMID: 8732703.
crossref
23. Hassan K, Loar R, Anderson BJ, Heptulla RA. The role of socioeconomic status, depression, quality of life, and glycemic control in type 1 diabetes mellitus. J Pediatr. 2006; 149:526–531. PMID: 17011326.
crossref
24. Connolly V, Unwin N, Sherriff P, Bilous R, Kelly W. Diabetes prevalence and socioeconomic status: a population based study showing increased prevalence of type 2 diabetes mellitus in deprived areas. J Epidemiol Community Health. 2000; 54:173–177. PMID: 10746110.
crossref
25. Boule NG, Haddad E, Kenny GP, Wells GA, Sigal RJ. Effects of exercise on glycemic control and body mass in type 2 diabetes mellitus: a meta-analysis of controlled clinical trials. JAMA. 2001; 286:1218–1227. PMID: 11559268.
crossref
26. Rhee MK, Slocum W, Ziemer DC, Culler SD, Cook CB, El-Kebbi IM, Gallina DL, Barnes C, Phillips LS. Patient adherence improves glycemic control. Diabetes Educ. 2005; 31:240–250. PMID: 15797853.
crossref

SUPPLEMENTARY MATERIALS

Supplementary Table 1

Proportion of glucose-lowering agents prescribed during the 2-year follow-up period
dmj-41-284-s001.pdf

Supplementary Table 2

Baseline characteristics of patients who initially attained HbA1c goal (HbA1c <7%) at 6 months
dmj-41-284-s002.pdf

Supplementary Table 3

Factors associated with glycemic durability among patients who initially attained HbA1c goal (HbA1c <7%) at 6 months
dmj-41-284-s003.pdf

Supplementary Fig. 1

Mean change in glycosylated hemoglobin (HbA1c) from baseline to 24 months.
dmj-41-284-s004.pdf
Fig. 1

Changes in the mean glycosylated hemoglobin (HbA1c) levels during the 2-year follow-up period. aDifference between groups P<0.01.

dmj-41-284-g001
Fig. 2

The frequency of glycemic durability and non-durability according to the baseline glycosylated hemoglobin (HbA1c) levels (P<0.005).

dmj-41-284-g002
Fig. 3

The frequency of glycemic durability and non-durability according to the glycosylated hemoglobin (HbA1c) level at the first follow-up visit (P<0.001).

dmj-41-284-g003
Table 1

Baseline characteristics according to glycemic durability

dmj-41-284-i001
Characteristic Durability group (n=114) Non-durability group (n=80) P value
Age, yr 55.8±11.2 53.1±12.2 0.109
Male sex 70 (61.4) 49 (61.2) 0.983
Body weight, kg 70.9±13.8 67.7±13.4 0.065
Body mass index, kg/m2 26.1±4.1 24.9±3.6 0.021
Waist circumference, cm 90.1±11.2 85.3±13.5 <0.001
Smoking status 0.681
 Non-smoker 51 (44.7) 33 (41.2)
 Ex-smoker 21 (18.4) 16 (20)
 Current-smoker 42 (36.8) 31 (38.7)
Alcohol 0.686
 No 54 (47.4) 43 (53.8)
 Yes 59 (51.8) 37 (46.2)
Education 0.092
 Lower than middle school 18 (17.8) 20 (26.7)
 High school 40 (39.6) 31 (41.3)
 Higher than college 43 (42.6) 24 (32.0)
Physical activity 0.018
 None 61 (54.0) 54 (68.4)
 ≤Twice per week 6 (5.3) 7 (8.9)
 ≥Three times per week 46 (40.7) 18 (22.8)
Fasting plasma glucose, mg/dL 154.5±58.2 182.1±66.4 0.001
Postprandial glucose, mg/dL 228.2±100.5 272.2±105.3 0.003
HbA1c, % 8.6±2.2 9.7±2.2 <0.001
C-peptide, basal, ng/mLa 2.31±1.13 1.87±0.97 0.003
Insulin, basal, μIU/mLa 9.71±5.37 8.17±4.54 0.067
HOMA-βa,b 51.4±5.2 33.1±3.7 0.005
HOMA-IRa,c 3.82±0.31 3.56±0.28 0.760
Creatinine, mg/dL 0.88±0.17 1.02±0.23 0.747
Estimated GFR, mL/min/1.73 m2 88.7±18.8 87.8±23.0 0.649
Systolic blood pressure, mm Hg 127.2±15.0 126.9±17.3 0.323
Total cholesterol, mg/dL 186.1±47.2 182.9±42.4 0.852
HDL-C, mg/dL 46.3±10.9 45.6±11.0 0.356
Triglyceride, mg/dL 158.3±137.5 173.0±106.1 0.199
Initial treatment
 Insulin 27 (23.7) 29 (36.2) 0.047
 Metformin 88 (77.2) 67 (83.8) 0.262
 Sulfonylurea 32 (28.1) 37 (46.2) 0.009
 Meglitinide 5 (4.4) 5 (6.2) 0.743
 DPP4-inhibitor 10 (8.8) 12 (15.0) 0.092
 Thiazolidinedione 10 (8.8) 7 (8.8) 0.996
 α-Glucosidase inhibitor 1 (0.9) 2 (2.5) 0.570

Values are presented as mean±standard deviation or number (%).

HbA1c, glycosylated hemoglobin; HOMA-β, homeostasis model assessment for β-cell function; HOMA-IR, homeostasis model assessment for insulin resistance; GFR, glomerular filtration rate; HDL-C, high density lipoprotein cholesterol; DPP4, dipeptidyl peptidase 4.

aStatistical significance was estimated after log transformation, bHOMA-β was calculated using: [20×fasting plasma insulin (µIU/mL)]/[fasting plasma glucose (mmol/L)–3.5], cHOMA-IR was calculated using: [fasting insulin (µIU/mL)×fasting plasma glucose (mmol/L)]/22.5.

Table 2

Factors associated with glycemic durability

dmj-41-284-i002
Variable Unadjusted OR (95% CI) Adjusteda ORa (95% CI)
Age 1.02 (0.99–1.05) 1.03 (0.99–1.06)
Body mass index, kg/m2
 23–25 (reference) 1 1
 <23 0.89 (0.37–2.09) 1.07 (0.38–3.00)
 25–30 2.04 (0.92–4.51) 2.60 (0.97–6.46)
 ≥30 1.88 (0.64–5.51) 2.28 (0.60–8.67)
Education level
 Lower than middle school (reference) 1 1
 High school 1.43 (0.65–3.16) 2.08 (0.80–5.40)
 Higher than college 1.99 (0.89–4.47) 3.18 (1.10–9.23)
Physical activity
 None (reference) 1 1
 <Twice per week 0.76 (0.24–2.40) 1.11 (0.29–4.17)
 ≥Thrice per week 2.26 (1.17–4.36) 2.51 (1.17–5.36)
HbA1c at baseline, %b
 ≥9 (reference) 1 1
 ≥8, <9 0.97 (0.40–2.35) 0.87 (0.33–2.32)
 ≥7, <8 1.60 (0.76–3.36) 1.30 (0.58–2.91)
 <7 6.91 (2.47–19.33) 7.48 (2.51–22.34)
HbA1c at 1st follow-up, %
 ≥8 (reference) 1 1
 ≥7, <8 3.89 (0.77–19.69) 3.41 (0.56–20.83)
 ≥6, <7 9.71 (2.01–46.82) 9.27 (1.62–53.01)
 <6 13.90 (2.54–75.92) 11.84 (1.80–77.68)
Baseline C-peptide, ng/mL 1.53 (1.12–2.09) 1.44 (0.99–2.03)
HOMA-βc 1.66 (1.15–2.39) 1.51 (1.02–2.73)
HOMA-IRc 1.14 (0.73–1.78) 0.99 (0.83–1.17)

OR, odds ratio; CI, confidence interval; HbA1c, glycosylated hemoglobin; HOMA-β, homeostasis model assessment for β-cell function; HOMA-IR, homeostasis model assessment for insulin resistance.

aAdjusted for age, sex, body mass index, physicians, glucose-lowering agents, and baseline HbA1c, bAdjusted for age, sex, body mass index, physicians, and glucose-lowering agents, cOR shows effect per 1-unit increase for each variable after logarithmic transformation.

Table 3

Association between the time needed to reach target glycemic control level (HbA1c <7.0%) and glycemic durability

dmj-41-284-i003
No. Unadjusted OR (95% CI) Adjusted Ora (95% CI)
>6 Months 39 1 1
>3, ≤6 Months 39 5.18 (1.96–13.69) 4.12 (1.42–11.93)
≤3 Months 116 6.19 (2.73–14.03) 5.90 (2.35–14.77)

HbA1c, glycosylated hemoglobin; OR, odds ratio; CI, confidence interval.

aAdjusted for age, sex, body mass index, physicians, glucose-lowering agents, and baseline HbA1c.

TOOLS
Similar articles